R E S E A R C H A R T I C L E
Open Access
Gender differences and typical nutrition
concerns of the diets of preschool children
–
the results of the first stage of an
intervention study
Sylwia Merkiel-Paw
ł
owska
*and Wojciech Chalcarz
Abstract
Background:Nutrition in children has an important influence on health both in childhood and adulthood. Actions aimed at improving children’s nutrition are essential, not only to the children and their families, but also to the whole society. The aim of the study was to present the results of nutrient intake before starting a nutrition and physical activity intervention programme, to investigate gender differences in nutrient intake and to discuss whether the preschoolers’nutrient intake is similar to the intake of their peers from other countries.
Methods:Nutrient intake was estimated from seven-day weighed food records kept by parents and preschool staff individually for 122 4–6-year-old children who attended two preschools in Piła, north-western Poland. Nutrient intake was calculated using Dieta 4.0 computer programme including water intake and intake of nutrients from dietary supplements. Statistical analysis was performed using the IBM SPSS Statistics computer programme, version 21.0, according to gender. The study was approved by the Bioethics Committee of the Poznan University of Medical Sciences (reference number 886/08).
Results:Boys, in comparison to girls, were found to have statistically significantly higher intakes of total protein, total protein per kg of body weight, saturated fatty acids, total carbohydrates, available carbohydrates, lactose, sucrose, total water, vitamin A, beta-carotene, vitamin B2, vitamin B12, vitamin C, calcium, phosphorus, and magnesium. Statistically significantly higher percentage of girls than boys had intakes of vitamin E below AI. Conclusions:Gender was a significant factor of nutrient intake in the studied preschool children. The main nutritional concerns in the studied preschoolers’diets, irrespective of gender, are typical of the diets of preschool children from various parts of Europe and indicate the need to work out common nutritional strategies to improve preschoolers’nutrition across Europe to reduce future burden of diet-related diseases to the European societies. Keywords:Preschool children, Nutrient intake, Energy, Macronutrients, Vitamins, Minerals, Intervention, Nutrition, Diet
Background
Nutrition plays a crucial role in human growth, develop-ment and health [1]. Adequate nutrition during child-hood not only has an important influence on the current health status of the child but also prevents diet-related diseases in adulthood [1, 2]. Nevertheless, studies have showed many dietary inadequacies in children of all ages
[e.g. [3–7]]. These inadequacies are reflected in bio-chemical blood indices [e.g. [3, 8]] and inadequate hy-dration status [5] all of which may have adverse effect on health, both at present and in the future. A diet mod-elling study based on NHANES 2007–2010 [9] showed that consuming the daily recommended amounts of dairy products would reduce the prevalence of inad-equate micronutrient intakes in children of all ages. This study proved that dietary interventions are necessary to improve children’s nutrition. Planning and carrying out such interventions is essential not only to the children * Correspondence:[email protected]
Food and Nutrition Department of the Eugeniusz Piasecki University School of Physical Education in Poznan, Królowej Jadwigi 27/39 Street, 61-871 Poznan, Poland
themselves and to their families, due to increasing the quality of life and the possibilities of personal physical, mental and emotional development [1], but also to the whole society, due to reducing the costs of health care, reducing absence rate at work due to illness and increas-ing the productivity [10–12].
To plan a nutrition intervention adequately, it is ne-cessary to know which nutrients should be targeted to successfully balance children’s diets. The results should be analysed separately for girls and boys because the ef-fect of an intervention may be influenced by gender [13]. Moreover, gender should be taken into account be-cause this variable was showed to have different influ-ence on the response to diet [14–16]. Although this difference was showed in adults, tracking dietary behav-iour [17–19] indicates that as early as at preschool age children should be taught such dietary behaviour which is expected in older childhood, adolescence and adulthood.
Many nutrition intervention programmes for pre-school children have been presented in the international literature so far [20]. However, to our knowledge, we carried out the first nutrition intervention programme for Polish preschool children, which aimed to modify diet and physical activity in preschool children in order to improve their nutritional status and physical fitness. In the current article, we report the results of nutrient intake from the first stage of the intervention programme, that is before introducing education of the preschool staff and parents, and before modifying chil-dren’s diets. Apart from presenting the results, our aim was also to investigate any potential gender differ-ences in nutrient intake and to discuss whether the studied preschoolers’ nutrient intake is similar to the intake of their peers from other countries based on the published literature.
Methods
General information
The outline and detailed methodology of the whole intervention programme were presented in the previous articles [21, 22]. The study was approved by the Bioeth-ics Committee of the Poznan University of Medical Sci-ences. Only children whose parents provided written consent took part in the study.
Subjects
From among 234 children who attended two randomly selected preschools in Piła, north-western Poland, complete and valid food records were provided by parents of 122 4–6-year-old children. All the details on the subjects exclusion were provided in the previ-ous article [23].
Nutrient intake
Data collection
Nutrient intake was estimated from seven-day weighed food records kept by parents and preschool staff indi-vidually for each child, including water and any dietary supplements. Both parents and preschool staff were instructed how to keep the food record, how to weigh foods and beverages, especially the ingredients of com-plex dishes, and how to weigh leftovers [22]. They were equipped with Soehnle Page 66100 electronic scales. The authors helped the staff in keeping the food records at preschools and were fully available (both personally at preschools and on the telephone) to parents in case help was needed. All the details on data collection were pro-vided previously [22, 23].
Dietary assessment and comparison with nutritional guidelines
Two underreporters were identified and excluded from further analysis as described previously [23]. Intakes of macronutrients, vitamins and minerals were calculated using Dieta 4.0 computer programme and modified as described previously [21] for the sake of the data accur-acy. The Microsoft Excel 2010 computer programme was used to calculate intake of total protein per kg of body weight, and intake of animal and plant protein expressed as % of total protein.
Statistical analysis
Statistical analysis was performed using the IBM SPSS
Statistics computer programme, version 21.0
(Armonk, NY: IBM Corp.). All the results were ana-lysed according to gender. Means and standard devia-tions (SD) were calculated. However, since in the case of AI assessing the prevalence of inadequate intake in a group requires comparison to the median intake, we also included medians and standard errors (SE) for the nutrients with AI. The percentages of pre-schoolers with nutrient intakes below or above the recommendations were calculated as previously [32]. The analysis of quantitative variables began with test-ing the normality ustest-ing the Shapiro-Wilk statistic with the level of significance set at P≤0.05. Statisti-cally significant differences were investigated using the unpaired Student’s t test for normally distributed variables and the non-parametric Mann-Whitney U test for skewed variables with the level of significance set at P≤0.05. Qualitative variables were presented in contingency tables. Statistical significance was deter-mined using Pearson’s chi-square test at P≤0.05. Results
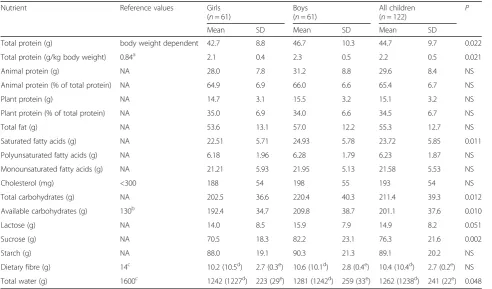
Table 1 shows macronutrient intake in the studied girls and boys from Piła and Table 2 shows the percentages of
the studied girls and boys in the reference ranges for macronutrient intake. Boys, in comparison to girls, were found to have statistically significantly higher intakes of total protein (46.7 vs 42.7 g), total protein per kg of body weight, (2.3 vs 2.1 g/kg body weight), saturated fatty acids (24.93 vs 22.51 g), total carbohydrates (220.4 vs 202.5 g), available carbohydrates (209.8 vs 192.4 g), lac-tose (15.9 vs 14.0 g), sucrose (82.2 vs 70.5 g), and total water (1281 vs 1242 g).
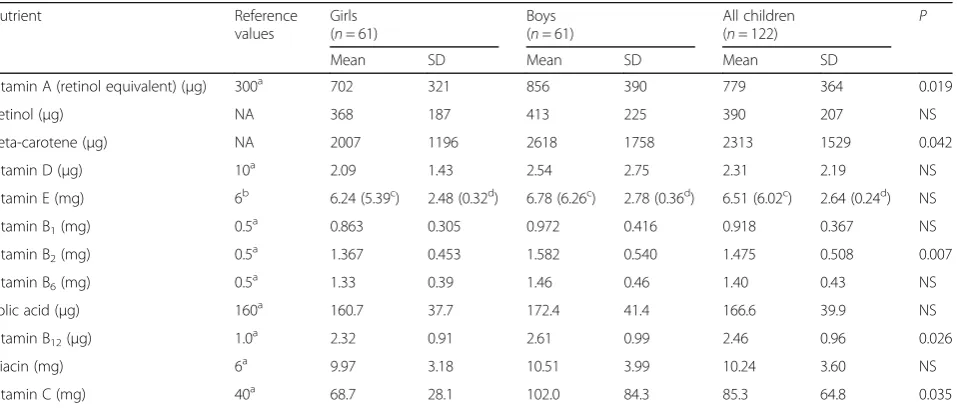
Tables 3 and 4 present vitamin intake in the studied girls and boys from Piła and the percentages of the stud-ied girls and boys in the reference ranges for vitamin in-take, respectively. Boys, compared to their female peers, were characterised by statistically significantly higher in-take of vitamin A (856 vs 702 μg), beta-carotene (2618 vs 2007μg), vitamin B2(1.582 vs 1.367 mg), vitamin B12 (2.61 vs 2.32μg), and vitamin C (102.0 vs 68.7 mg). Sta-tistically significantly higher percentage of girls (57.4%) than boys (37.7%) had intakes of vitamin E below AI.
Tables 5 and 6 show mineral intake in the studied girls and boys from Piła and the percentages of the studied girls and boys in the reference ranges for mineral intake, respectively. Statistically significantly higher intakes in boys than in girls were observed for calcium (625 vs 529 mg), phosphorus (829 vs 749 mg), and magnesium (179 vs 167 mg).
Table 1Macronutrient intake in the studied children from Piła according to gender
Nutrient Reference values Girls
(n= 61)
Boys (n= 61)
All children (n= 122)
P
Mean SD Mean SD Mean SD
Total protein (g) body weight dependent 42.7 8.8 46.7 10.3 44.7 9.7 0.022
Total protein (g/kg body weight) 0.84a 2.1 0.4 2.3 0.5 2.2 0.5 0.021
Animal protein (g) NA 28.0 7.8 31.2 8.8 29.6 8.4 NS
Animal protein (% of total protein) NA 64.9 6.9 66.0 6.6 65.4 6.7 NS
Plant protein (g) NA 14.7 3.1 15.5 3.2 15.1 3.2 NS
Plant protein (% of total protein) NA 35.0 6.9 34.0 6.6 34.5 6.7 NS
Total fat (g) NA 53.6 13.1 57.0 12.2 55.3 12.7 NS
Saturated fatty acids (g) NA 22.51 5.71 24.93 5.78 23.72 5.85 0.011
Polyunsaturated fatty acids (g) NA 6.18 1.96 6.28 1.79 6.23 1.87 NS
Monounsaturated fatty acids (g) NA 21.21 5.93 21.95 5.13 21.58 5.53 NS
Cholesterol (mg) <300 188 54 198 55 193 54 NS
Total carbohydrates (g) NA 202.5 36.6 220.4 40.3 211.4 39.3 0.012
Available carbohydrates (g) 130b 192.4 34.7 209.8 38.7 201.1 37.6 0.010
Lactose (g) NA 14.0 8.5 15.9 7.9 14.9 8.2 0.051
Sucrose (g) NA 70.5 18.3 82.2 23.1 76.3 21.6 0.002
Starch (g) NA 88.0 19.1 90.3 21.3 89.1 20.2 NS
Dietary fibre (g) 14c 10.2 (10.5d) 2.7 (0.3e) 10.6 (10.1d) 2.8 (0.4e) 10.4 (10.4d) 2.7 (0.2e) NS
Total water (g) 1600c 1242 (1227d) 223 (29e) 1281 (1242d) 259 (33e) 1262 (1238d) 241 (22e) 0.048
Psignificance,NAnot available,NSnot significant (P> 0.05) a
Discussion
General comments
In the previous article [33], we presented sociodemo-graphic characteristics and selected indices of health sta-tus of the studied preschoolers and their families. However, in the current article we did not present nutri-ent intake of six children, that is two girls and four boys, because their parents provided incomplete food records. Nevertheless, it does not change the overall characteris-tics of this population. Although the preschools for the intervention were selected randomly, the studied chil-dren’s parents turned out to be better educated than
their peers in the general population [33]. Moreover, high percentages of them assessed the economic status of the family as good or very good [33]. These findings, together with the fact that the parents voluntarily gave their informed consent to take part in the study, would suggest an expectation that the parents would be inter-ested in providing a healthy diet to their children. Add-itionally, the high percentages of the studied children’s parents who reported diet-related diseases in their fam-ilies [33] are another factor which should induce parents to follow current nutrition recommendations, irrespect-ive of their child’s gender.
In the previous article [23], we also presented a de-tailed analysis of energy intake in relation to the studied children’s BMI. These results indicated a low probability of misreporting children’s food intake since energy in-take increased through the percentile categories for BMI unlike energy intake in other groups of children in the same or similar age range [34–38].
Gender differences
In the studied preschool children from Piła, gender turned out to be a significant factor of nutrient intake, since intakes of as many as 16 nutrients out of 40 were statistically significantly different in girls and boys. How-ever, in two previously published studies on nutrient in-take in preschool children, inin-take of even more nutrients differed according to gender, that is 24 nutrients in 4-year-old urban children from all over Poland [39] and 17 nutrients in Belgian 4–6.5-year-old preschoolers [40]. In the remaining studies, in which the influence of gender on nutrient intake in preschoolers was analysed, less dif-ferences were found [32, 37, 41–46].
Table 2The percentages of the studied children from Piła in the reference ranges for macronutrient intake according to gender
Nutrient Girls
(n= 61) Boys (n= 61)
All children (n= 122) P
Percent Percent Percent
Total protein (g/kg body weight)
Below EAR 0.0 0.0 0.0 #
Cholesterol (mg)
Within the recommendations 96.7 96.7 96.7 NS
Above the recommendations 3.3 3.3 3.3
Dietary fibre (g)
Below AI 96.7 88.5 92.6 NS
AI or above 3.3 11.5 7.4
Total water (g)
Below AI 95.1 88.5 91.8 NS
AI or above 4.9 11.5 8.2
Psignificance, NS not significant (P> 0.05) #–Pcannot be calculated when percentage is 0.0
Table 3Vitamin intake in the studied children from Piła according to gender
Nutrient Reference
values
Girls (n= 61)
Boys (n= 61)
All children (n= 122)
P
Mean SD Mean SD Mean SD
Vitamin A (retinol equivalent) (μg) 300a 702 321 856 390 779 364 0.019
Retinol (μg) NA 368 187 413 225 390 207 NS
Beta-carotene (μg) NA 2007 1196 2618 1758 2313 1529 0.042
Vitamin D (μg) 10a 2.09 1.43 2.54 2.75 2.31 2.19 NS
Vitamin E (mg) 6b 6.24 (5.39c) 2.48 (0.32d) 6.78 (6.26c) 2.78 (0.36d) 6.51 (6.02c) 2.64 (0.24d) NS
Vitamin B1(mg) 0.5a 0.863 0.305 0.972 0.416 0.918 0.367 NS
Vitamin B2(mg) 0.5a 1.367 0.453 1.582 0.540 1.475 0.508 0.007
Vitamin B6(mg) 0.5a 1.33 0.39 1.46 0.46 1.40 0.43 NS
Folic acid (μg) 160a 160.7 37.7 172.4 41.4 166.6 39.9 NS
Vitamin B12(μg) 1.0 a
2.32 0.91 2.61 0.99 2.46 0.96 0.026
Niacin (mg) 6a 9.97 3.18 10.51 3.99 10.24 3.60 NS
Vitamin C (mg) 40a 68.7 28.1 102.0 84.3 85.3 64.8 0.035
NAnot available,Psignificance,NSnot significant (P> 0.05) a
Among the nutrients on which gender had statisti-cally significant influence, seven nutrients in the group of 4-year-old urban children from all over Poland [39] were the same as in the studied pre-schoolers. These nutrients included: total protein, sat-urated fatty acids, available carbohydrates, vitamin A, vitamin B12, phosphorus and magnesium. In Belgian 4–6.5-year-old preschoolers [40], eight nutrients on which gender had statistically significant influence were the same as in the studied preschoolers, that is: total protein, total carbohydrates, total water, vitamin B2, vitamin C, calcium, phosphorus and magnesium.
It is interesting to note that the nutrients which dif-fered most often according to gender were total protein
and magnesium: statistically significant differences were found in the studied preschoolers, in urban 4-year-olds from all over Poland [39], and in Belgian 4– 6.5-year-olds [40].
It is noteworthy that intakes of all the nutrients on which gender had statistically significant influence, and also intakes of all the remaining nutrients except for iron, were higher in the studied boys compared to girls. It is natural due to the higher energy intake among boys found in the studied children [23] and in other pre-schoolers [37–40, 46].
Assessment of macronutrient intake
The favourable feature of the studied preschoolers’ macronutrient intake was adequate intake of monoun-saturated fatty acids and cholesterol. Intake of these macronutrients was also adequate in other Polish pre-schoolers [37, 39, 42, 46–48], as well as in preschool children from other countries [40, 49–53]. Adequate in-take of monounsaturated fatty acids in Polish children results from the popularity of rapeseed oil which in Poland is produced in large amounts [54]. In Belgium, Finland and Great Britain rapeseed oil production is quite high and the highest of all other oils [54], whereas Spain and Greece are known for the widespread use of olive oil [55]. It is also not surprising that cholesterol in-take falls under the upper limit recommended by the World Health Organization (WHO) in the prevention of diet-related diseases [31] since energy intake at this stage of life is relatively low in comparison to energy intake of adults and the limit is the same irrespective of age. How-ever, those children whose cholesterol intake was close to this limit [37, 46, 50] are at risk of excessive choles-terol intake in the future because the increase of energy intake, which must accompany the increase of body height and body mass, may result in the increased intake of cholesterol. This may be observed in Spanish children [50]: 2–5-year-olds consumed slightly less cholesterol than the upper limit, while 6–9-year-olds exceeded the WHO recommendations. Of course, one may claim that the amount of cholesterol in the diet is not important because recent recommendations of the European Food Safety Authority [56] and the Dietary Guidelines Advis-ory Committee of the United States Department of Agri-culture [57] have not included any limitations of cholesterol intake. However, in our opinion this claim is not adequate for two reasons. First of all, the fact of not including the limits on cholesterol intake in the dietary guidelines worked out by both European and American experts [56, 57], does not mean that cholesterol may be consumed in large amounts, as was interpreted by mass media. The experts did not state that high cholesterol intake is good for cardiovascular health. They only stated that the evidence is not adequate enough for setting a
Table 4The percentages of the studied children from Piła in the reference ranges for vitamin intake according to gender
Nutrient Girls (n= 61)
Boys (n= 61)
All children (n= 122)
P
Percent Percent Percent
Vitamin A (retinol equivalent)
Below EAR 1.6 0.0 0.8 NS
Retinol
Above UL 1.6 1.6 1.6 NS
Vitamin D
Below EAR 100.0 96.7 98.4 NS
Above UL 0.0 0.0 0.0 #
Vitamin E
Below AI 57.4 37.7 47.5 0.030
Above UL 0.0 0.0 0.0 #
Vitamin B1
Below EAR 3.3 0.0 1.6 NS
Vitamin B2
Below EAR 0.0 0.0 0.0 #
Vitamin B6
Below EAR 0.0 0.0 0.0 #
Above UL 0.0 0.0 0.0 #
Folic acid
Below EAR 47.5 41.0 44.3 NS
Above UL 0.0 0.0 0.0 #
Vitamin B12
Below EAR 0.0 0.0 0.0 #
Niacin
Below EAR 6.6 4.9 5.7 NS
Above UL 6.6 8.2 7.4 NS
Vitamin C
Below EAR 9.8 14.8 12.3 NS
Above UL 0.0 0.0 0.0 #
quantitative limit. Besides high-cholesterol foods are usually rich source of saturated fatty acids and these fatty acids should be limited in the daily diet [58]. More-over, examples of healthy eating patterns in the Ameri-can guidelines in fact limit dietary cholesterol to a range of 100 to 300 mg/day [58]. The second reason is the high prevalence of cardiovascular diseases in the studied children’s families reported previously [33] which indi-cates the necessity to pay special attention to nutritional factors which are able to prevent the onset of the dis-eases in genetically predisposed children. Therefore, it was highly favourable that cholesterol content in the studied children’s diets did not exceed the WHO recom-mendations [31].
Protein intake both in the studied preschool children and in other Polish preschoolers was either adequate [37, 39, 46–48] or excessive [42], similar to children from other countries who consumed either adequate [40, 49, 51–53] or excessive [41, 50] amounts of this macronutrient. Such results are not surprising because nowadays inadequate protein intake resulting in malnu-trition at the community level is observed only in low-income countries.
Another features of the studied preschoolers’ diets which were common to the diets of both children from Poland and children from other countries were excessive intake of total fat [37, 39, 41, 47–53], excessive intake of saturated fatty acids [37, 39–42, 47, 49–53], inadequate intake of polyunsaturated fatty acids [37, 39, 40, 42, 47, 50–53] and excessive intake of sucrose, simple carbohy-drates or non-milk extrinsic sugars [37, 39, 40, 42, 48, 51, 53]. Such low intake of dietary fibre as in the studied preschoolers was observed only in one study on Polish children [42] and in three studies on children from other countries [50, 51, 53]. These characteristics of the chil-dren’s diets increase the risk of diet-related diseases,
especially atherosclerosis [59–62]. It is particularly un-favourable when taking into account that ischaemic heart disease and stroke are the two main causes of death in Europe [63] and that the prevalence of familial myocardial infarction in the studied population was rela-tively high [33]. Moreover, these observations, irrespect-ive of the country, indicate that intervention is necessary to prevent future health consequences, particularly tak-ing into account the trends in food intake. These trends show that the frequency of consuming meat products, sweets and sugar-sweetened carbonated beverages among children increases with age [64, 65], while the frequency of consuming fruit and vegetables decreases with age [64]. Also, energy-adjusted intake of sweets and sugar increases with children’s age, while energy-adjusted intake of vegetables and fruit decreases with age [51].
Another unfavourable feature of the studied pre-schoolers’diets was inadequate total water intake. Intake of this macronutrient has been rarely included in nutri-ent intake assessmnutri-ent in preschool children. It was ana-lysed only in two studies on Polish preschoolers [37, 42] and one study on children from Belgium [40]. All of these studies reported water intake to be inadequate. Due to the role of water in preventing chronic dis-eases [66], more research on water intake in pre-schoolers should be carried out. Preschool children should be encouraged to drink more water and pre-school staff should be educated about the need to promote water intake in children.
Assessment of micronutrient intake
Intake of most vitamins and minerals was adequate in the studied preschool children, that is intake of vitamin A, B1, B2, B6, B12, PP, C, phosphorus, magnesium, iron, zinc, copper, manganese and iodine. Intake of these
Table 5Mineral intake in the studied children from Piła according to gender
Nutrient Reference values
Girls (n= 61)
Boys (n= 61)
All children
(n= 122) P
Mean SD Mean SD Mean SD
Calcium (mg) 800a 529 214 625 219 577 221 0.003
Phosphorus (mg) 410a 749 169 829 178 789 177 0.012
Magnesium (mg) 110a 167 32 179 32 173 32 0.034
Sodium (mg) 1000b 2080 (2035c) 444 (57d) 2223 (2190c) 567 (73d) 2151 (2121c) 512 (46d) NS
Potassium (mg) 3100b 1895 (1922c) 409 (52d) 1974 (1947c) 374 (48d) 1934 (1941c) 393 (36d) NS
Iron (mg) 4a 7.1 6.5 6.9 2.2 7.0 4.8 NS
Zinc (mg) 4a 5.5 1.2 6.0 1.3 5.8 1.3 NS
Copper (mg) 0.3a 0.62 0.13 0.66 0.13 0.64 0.13 NS
Manganese (mg) 1.5b 2.39 (2.35c) 0.60 (0.08d) 2.40 (2.34c) 0.50 (0.06d) 2.40 (2.35c) 0.55 (0.05d) NS
Iodine (μg) 65a 77.2 21.2 83.6 28.2 80.4 25.0 NS
NAnot available,Psignificance,NSnot significant (P> 0.05) a
EAR,b AI,c
median,d
micronutrients was also reported to be adequate in Pol-ish preschoolers studied previously [32, 39, 43–48] as well as in preschool children from other countries [40, 49–51, 53]. However, there were some serious nutrition concerns which included inadequate intake of vitamin D, E, folic acid, calcium and potassium, along with ex-cessive intake of sodium.
The most serious nutritional concern in the studied preschoolers’ diets was inadequate intake of vitamin D observed in all of the studied girls and almost all of the studied boys. Such low intakes of vitamin D are typical of preschool children both in Poland [32, 39, 43, 46] and other countries [40, 50, 51, 53]. Unfortunately, this find-ing confirms the prognosis that osteoporosis incidence
in Europe will rise [67] and unless intervention pro-grammes will be introduced to prevent inadequate in-takes of vitamin D in children, osteoporosis morbidity will remain on the rise. Moreover, since vitamin D was reported as a caries-preventive agent [68], inadequate in-take of this vitamin, together with the abovementioned excessive sucrose intake, may increase the prevalence of dental caries among the studied preschoolers. Of course, apart from dietary sources, vitamin D is also synthesised in the skin during exposure to ultraviolet radiation [69]. Nevertheless, total annual sunshine in Poland is low and does not exceed 1800 h [70]. For comparison, in Spain and Greece total annual sunshine exceeds 2500 h [70]. Therefore, it is not possible that the serious dietary shortcomings in vitamin D observed in the studied chil-dren would be compensated by cutaneous synthesis.
Another serious nutrition concern in the studied pre-schoolers was high prevalence of inadequate calcium in-take along with high risk of inadequate potassium inin-take and excessive sodium intake similar to other Polish chil-dren studied previously [32, 39, 45, 47] and British pre-schoolers [49]. Two studies on Polish children [46, 48] reported adequate sodium intake but confirmed inad-equate intake of calcium and potassium, whereas studies on Belgian [40] and Spanish [50] children reported ad-equate calcium intake but confirmed inadad-equate potas-sium intake and excessive sodium intake. These findings require urgent intervention because inadequate intake of calcium and potassium together with excessive intake of sodium not only increases the risk of hypertension but also increases the risk of osteoporosis, which is addition-ally aggravated by the abovementioned inadequate intake of vitamin D [71].
Although mean intakes of vitamin E and folic acid were above AI and EAR, respectively, it is highly discon-certing that the prevalence of inadequate intake of these vitamins in the studied preschool children was quite high. Most of the previously published studies on Polish preschoolers also reported that mean intakes of vitamin E [32, 39, 47, 48] and folic acid [32, 39, 46] were higher than AI and EAR, respectively. The prevalence of inad-equate intake was analysed only in three Polish studies [32, 43, 44]: two studies confirmed the high prevalence of inadequate intake of vitamin E [32, 43] and one study confirmed the high prevalence of inadequate folic acid intake [44]. Among the few studies which reported vita-min E and folic acid intake in preschool children from other countries, the results were varied: some studies in-dicated inadequate intake of vitamin E [50, 51] and folic acid [50, 51], while other showed adequate intake of vitamin E [49, 53] and folic acid [53]. The insufficient in-take of vitamin E and folic acid observed in the studied preschoolers and in several other groups of children shows the need to target these nutrients in special
Table 6The percentages of the studied children from Piła in the reference ranges for mineral intake according to gender
Nutrient Girls (n= 61)
Boys (n= 61)
All children (n= 122)
P
Percent Percent Percent
Calcium
Below EAR 88.5 82.0 85.2 NS
Above UL 0.0 0.0 0.0 #
Phosphorus
Below EAR 1.6 0.0 0.8 NS
Above UL 0.0 0.0 0.0 #
Magnesium
Below EAR 4.9 0.0 2.5 NS
Sodium
Below AI 0.0 0.0 0.0 #
Above UL 90.2 95.1 92.6 NS
Potassium
Below AI 100.0 100.0 100.0 #
Iron
Below EAR 4.9 0.0 2.5 NS
Above UL 1.6 0.0 0.8 NS
Zinc
Below EAR 8.2 4.9 6.6 NS
Above UL 0.0 0.0 0.0 #
Copper
Below EAR 0.0 0.0 0.0 #
Above UL 0.0 0.0 0.0 #
Manganese
Below AI 4.9 4.9 4.9 NS
Above UL 11.5 13.1 12.3 NS
Iodine
Below EAR 27.9 27.9 27.9 NS
Above UL 0.0 0.0 0.0 #
Psignificance,NSnot significant (P> 0.05)
nutrition intervention programmes addressed to preschool children and their parents. It is important since inadequate intake of these vitamins poses a health hazard in the con-text of preventing diet-related diseases. Vitamin E was recognised to have anticancer potential [72] and was found to reduce two risk factors of cardiovascular diseases, that is hypertension and high waist circumference [73]. Vitamin E is also known to inhibit oxidative modification of LDL lipo-proteins and may inhibit atherogenesis through several other mechanisms at the molecular and cellular levels [74]. Folic acid was found to be inversely associated with risk of coronary heart disease [75]. Taking into account the crucial role of these vitamins in preventing diet-related diseases, more studies should include assessment of vitamin E and folic acid intake in preschool children in order to prevent any possible deficiencies in this young population.
It is also worth noting that although mean iodine in-take was higher than EAR, the prevalence of inadequate iodine intake may also be a matter of concern: almost 1/ 3 of the studied preschoolers had intakes of this mineral lower than EAR. Iodine intake in preschool children was assessed only in two other Polish studies [32, 45] and one study on British children [53]. All of these studies reported adequate iodine intakes. However, it should be noted that in fact it is difficult to assess iodine intake based on food records and food composition tables be-cause iodine content in foods may vary significantly, for example iodine content in milk depends on the amount of iodine consumed by the animal [26], iodine content in plants depends on the amount of iodine in the soil which may vary in different regions of the country, etc. Therefore, these results show the need to assess iodine status of the studied children. The confirmation are the results of the study in preschoolers from Nowy Scz and the vicinity [32] whose iodine intake assessed from food records was adequate, but not even a half of them was characterised by adequate iodine status as implied by urinary iodine concentration [76].
Another disconcerting feature of the studied pre-schoolers diets may be the high prevalence of excessive manganese intake. Similar [45] or even higher [32] preva-lence was observed also in other Polish preschoolers. The remaining few studies which reported intake of this min-eral in preschool children included only mean intake [39, 47, 49] and showed higher mean manganese intake in other Polish children [39, 47] but lower intake in British children [49]. The children whose manganese intake ex-ceeds UL should have blood manganese concentration measured to assess whether their intake of this mineral is in fact too high, because absorption of dietary manganese is relatively low, depends on the source of manganese be-ing higher from water and supplements than from foods, and is affected by several dietary factors [26], such as low-ering effect of phytate on manganese absorption [77].
Study strengths and limitations
Our study showed that gender was a significant factor of nutrient intake in preschool children and that the stud-ied preschoolers’ diets were characterised by excessive intakes of saturated fatty acids, sucrose and sodium along with inadequate intakes of polyunsaturated fatty acids, dietary fibre, total water, vitamin D, vitamin E, folic acid, calcium and potassium. All of these concerns were similar to the previously published results on pre-school children from various countries. Also, a matter of concern may be those children who exceeded UL for manganese and those who had inadequate iodine in-takes, which in the case of these two minerals requires blood manganese concentration assessment and urinary iodine concentration assessment, respectively.
When considering these findings, the strengths and limi-tations of our study should be taken into account. The strengths are (1) a seven-day period of keeping food re-cords, (2) using electronic scales to weigh all foods and bev-erages, (3) including water and dietary supplements, (4) keeping individual records also during preschool hours.
Our study has also some limitations. Despite the fact that the authors did their best to motivate parents and preschool staff to keep the food records as precisely as possible, it was not feasible to supervise each preschool teacher constantly and to assist parents to check if their records kept out of preschool were precise indeed. Al-though energy intake in the studied preschool children increased through the percentile categories for BMI as reported previously [23], which suggested low risk of underreporting, and although the food records included in the analysis seemed to be filled in carefully, underre-porting cannot be excluded even if the results are within the plausible range. However, this limitation refers to all studies on dietary assessment and the only thing the au-thors might do is to minimise the risk of imprecision.
Conclusions
Abbreviations
AI:Adequate Intake; DRVs: Dietary Reference Values; EAR: Estimated Average Requirement; RDA: Recommended Dietary Allowance; UL: Tolerable Upper Intake Level
Acknowledgements
The authors would like to thank the directors and the staff of the preschools in Piła for their help in collecting the data on children’s dietary intake at preschool.
Funding
This study was financed by the National Science Centre from the resources for financing research in the years 2010–2014 as a research project N N404 140,437 titled:‘Modifying dietary intake and physical activity in preschool children and its influence on nutrition status and physical fitness’. The cost of publishing this article in open access was covered by the Eugeniusz Piasecki University School of Physical Education in Poznan, Poland, from the funds received from the Polish Ministry of Science and Higher Education. The funding body had no role in the design of the study, data collection, analysis of the results, interpretation of the data or writing the manuscript.
Availability of data and materials
The data generated or analysed during this study are available from the corresponding author on reasonable request.
Authors’contributions
Both authors conceptualized and designed the study. SMP searched for the literature, extracted and analysed data, and drafted the initial manuscript. WCH analysed data and critically reviewed the initial manuscript. Both authors approved the final manuscript as submitted.
Ethics approval
The study was approved by the Bioethics Committee of the Poznan University of Medical Sciences (reference number 886/08). Only children whose parents provided written consent took part in the study.
Consent for publication Not applicable
Competing interests
The authors declare that they have no competing interests.
Publisher’s Note
Springer Nature remains neutral with regard to jurisdictional claims in published maps and institutional affiliations.
Received: 15 September 2016 Accepted: 8 December 2017
References
1. Merkiel S, Chalcarz W. Nutrition in preschool age: part 1. Importance, reference values, methods of research and their application. Review. New Med (Wars). 2007;11:68–73.
2. Kaikkonen JE, Mikkilä V, Magnussen CG, Juonala M, Viikari JS, Raitakari OT. Does childhood nutrition influence adult cardiovascular disease risk?– insights from the young Finns study. Ann Med. 2013;45:120–8. https://doi. org/10.3109/07853890.2012.671537.
3. Frei S, Frei B, Bobe G. Low vitamin D status and inadequate nutrient intakes of elementary school children in a highly educated Pacific northwest community. J Ext. 2014;52:#4RIB2.
4. Im JG, Kim SH, Lee GY, Joung H, Park MJ. Inadequate calcium intake is highly prevalent in Korean children and adolescents: the Korea National Health and nutrition examination survey (KNHANES) 2007-2010. Public Health Nutr. 2014;17:2489–95. https://doi.org/10.1017/S1368980013002826. 5. Kenney EL, Long MW, Cradock AL, Gortmaker SL. Prevalence of inadequate
hydration among US children and disparities by gender and race/ethnicity: National Health and nutrition examination survey, 2009-2012. Am J Public Health. 2015;105:113–8. https://doi.org/10.2105/AJPH.2015.302572. 6. Lee HA, Park H. Correlations between poor micronutrition in family
members and potential risk factors for poor diet in children and
adolescents using Korean National Health and nutrition examination survey data. Nutrients. 2015;7:6346–61. https://doi.org/10.3390/nu7085286. 7. Sánchez-Pimienta TG, López-Olmedo N, Rodríguez-Ramírez S, García-Guerra A,
Rivera JA, Carriquiry AL, Villalpando S. High prevalence of inadequate calcium and iron intakes by Mexican population groups as assessed by 24-hour recalls. J Nutr. 2016;146:1874S–80S. https://doi.org/10.3945/jn.115.227074.
8. Fiorentino M, Landais E, Bastard G, Carriquiry A, Wieringa FT, Berger J. Nutrient intake is insufficient among Senegalese Urban School children and adolescents: results from two 24 h recalls in state primary schools in Dakar. Nutrients. 2016;8:650. https://doi.org/10.3390/nu8100650.
9. Quann EE, Fulgoni VL III, Auestad N. Consuming the daily recommended amounts of dairy products would reduce the prevalence of inadequate micronutrient intakes in the United States: diet modeling study based on NHANES 2007–2010. Nutr J. 2015;14:90. https://doi.org/10.1186/s12937-015-0057-5.
10. Selmer RM, Kristiansen IS, Haglerod A, Graff-Iversen S, Larsen HK, Meyer HE, Bønaa KH, Thelle DS. Cost and health consequences of reducing the population intake of salt. J Epidemiol Community Health. 2000;54:697–702. 11. Rtveladze K, Marsh T, Barquera S, Sanchez Romero LM, Levy D, Melendez G,
Webber L, Kilpi F, McPherson K, Brown M. Obesity prevalence in Mexico: impact on health and economic burden. Public Health Nutr. 2014;17:233–9. https://doi.org/10.1017/S1368980013000086.
12. Ekwaru JP, Ohinmaa A, Loehr S, Setayeshgar S, Thanh NX, Veugelers PJ. The economic burden of inadequate consumption of vegetables and fruit in Canada. Public Health Nutr. 2017;20:515–23. https://doi.org/10.1017/ S1368980016002846.
13. Leblanc V, Bégin C, Hudon AM, Royer MM, Corneau L, Dodin S, Lemieux S. Gender differences in the long-term effects of a nutritional intervention program promoting the Mediterranean diet: changes in dietary intakes, eating behaviors, anthropometric and metabolic variables. Nutr J. 2014;13: 107. https://doi.org/10.1186/1475-2891-13-107.
14. Knopp RH, Paramsothy P, Retzlaff BM, Fish B, Walden C, Dowdy A, Tsunehara C, Aikawa K, Cheung MC. Gender differences in lipoprotein metabolism and dietary response: basis in hormonal differences and implications for cardiovascular disease. Curr Atheroscler Rep. 2005;7:472–9. 15. Lapointe A, Balk EM, Lichtenstein AH. Gender differences in plasma lipid
response to dietary fat. Nutr Rev. 2006;64(5 Pt 1):234–49.
16. Bédard A, Riverin M, Dodin S, Corneau L, Lemieux S. Sex differences in the impact of the Mediterranean diet on cardiovascular risk profile. Br J Nutr. 2012;108:1428–34. https://doi.org/10.1017/S0007114511006969. 17. Lake AA, Adamson AJ, Craigie AM, Rugg-Gunn AJ, Mathers JC. Tracking of
dietary intake and factors associated with dietary change from early adolescence to adulthood: the ASH30 study. Obes Facts. 2009;2:157–65. https://doi.org/10.1159/000219819.
18. Oellingrath IM, Svendsen MV, Brantsæter AL. Tracking of eating patterns and overweight–a follow-up study of Norwegian schoolchildren from middle childhood to early adolescence. Nutr J. 2011;10:106. https://doi.org/10.1186/ 1475-2891-10-106.
19. Madruga SW, Araújo CL, Bertoldi AD, Neutzling MB. Tracking of dietary patterns from childhood to adolescence. Rev Saude Publica. 2012;46:376–86. 20. Mikkelsen MV, Husby S, Skov LR, Perez-Cueto FJ. A systematic review of
types of healthy eating interventions in preschools. Nutr J. 2014;13:56. https://doi.org/10.1186/1475-2891-13-56.
21. Merkiel S, Chalcarz W. Challenges of dietary intake assessment in preschool children–conclusions from a dietary intervention study on polish preschoolers. New Med (Wars). 2014;18:47–51.
22. Chalcarz W, Merkiel S. Modifying dietary intake and physical activity in preschool children and its influence on nutritional status and physical fitness–methodology of an intervention programme in polish preschoolers. New Med (Wars). 2016;20:3–7. https://doi.org/10.5604/ 14270994.1197169.
23. Merkiel S, Chalcarz W. The need for modifying energy intake in preschool children from Piła, Poland. Rocz Panstw Zakl Hig. 2016;67:179–88. 24. Jarosz M, editor. Normyżywienia dla populacji polskiej–nowelizacja, in
polish [dietary reference intakes for the polish population–amendment]. Warszawa: InstytutŻywności iŻywienia; 2012.
27. Scienfitic Committee on Food, Scientific Panel of Dietetic Products, Nutrition and Allergies. Tolerable upper intake levels for vitamins and minerals. Brussels: European food safety authority (EFSA); 2006. 28. Food and Nutrition Board of the Institute of Medicine. Dietary reference
intakes for calcium, phosphorus, magnesium, vitamin D and fluoride. Washington: The National Academies Press; 1997.
29. Food and Nutrition Board of the Institute of Medicine. Dietary reference intakes for thiamin, riboflavin, niacin, vitamin B6, folate, vitamin B12, panthotenic acid, biotin and choline. Washington: The National Academies Press; 1998.
30. Food and Nutrition Board of the Institute of Medicine. Dietary reference intakes for vitamin C, vitamin E, selenium and carotenoids. Washington: The National Academies Press; 2000.
31. World Health Organization. Diet, nutrition and the prevention of chronic diseases. Report of a joint WHO/FAO expert consultation. WHO technical report series no. 916. Geneva: World Health Organization; 2003. 32. Merkiel S, Chalcarz W. Dietary intake in 6-year-old children from southern
Poland: part 2 - vitamin and mineral intakes. BMC Pediatr. 2014;14:310. https://doi.org/10.1186/s12887-014-0310-7.
33. Merkiel S, Chalcarz W. Selected indices of health status in preschool children from Piła and their families as a risk factor of diet-related diseases. Rocz Panstw Zakl Hig. 2015;66:159–65.
34. Fisher JO, Johnson RK, Lindquist C, Birch LL, Goran MI. Influence of body composition on the accuracy of reported energy intake in children. Obes Res. 2000;8:597–603.
35. Alexy U, Sichert-Hellert W, Kersting M, Schultze-Pawlitschko V. Pattern of long-term fat intake and BMI during childhood and adolescence–results of the DONALD study. Int J Obes. 2004;28:1203–9.
36. Waling MU, Larsson CL. Energy intake of Swedish overweight and obese children is underestimated using a diet history interview. J Nutr. 2009;139:522–7. 37. Merkiel S. Dietary intake in 6-year-old children from southern Poland: part 1
- energy and macronutrient intakes. BMC Pediatr. 2014;14:197. https://doi. org/10.1186/1471-2431-14-197.
38. Merkiel S, Chalcarz W, Mielczarek D. Błędy w spożyciu energii z makroskładników czynnikiem sprzyjającym rozwojowi chorób dietozależnych w grupie dzieci przedszkolnych z Turku, in Polish [Inadequate energy intake from macronutrients favours the
development of diet-related diseases in preschool children from Turek]. In: Gromadzka-Ostrowska J, editor. Fizjologiczne uwarunkowania postępowania dietetycznego, in polish [physiological determinants of dietary approach]. Warszawa: Oficyna Wydawniczo-Poligraficzna ADAM; 2014. p. 226–43.
39. Rogalska-NiedźwiedźM, Charzewska J, Chabros E, Chwojnowska Z, Wajszczyk B, Zacharewicz E. Sposóbżywienia dzieci czteroletnich ze wsi na tle dzieci z miast, in polish [nutrition of 4-year old children from rural and urban environments]. Probl Hig Epidemiol. 2008;89:80–4.
40. Huybrechts I, De Henauw S. Energy and nutrient intakes by pre-school children in Flanders-Belgium. Br J Nutr. 2007;98:600–10. https://doi.org/10. 1017/S000711450773458X.
41. Manios Y. Design and descriptive results of the“growth, exercise and nutrition epidemiological study in preSchoolers”: the GENESIS study. BMC Public Health. 2006;6:32. https://doi.org/10.1186/1471-2458-6-32. 42. Merkiel S, Chalcarz W. Spożycie makroskładników przez dzieci w wieku
przedszkolnym z Turku czynnikiem sprzyjającym rozwojowi miażdżycy, in Polish [Macronutrient intake in preschool children from Turek as a risk factor of atherosclerosis]. Med Rodz. 2015;18:47–54.
43. Merkiel S, Chalcarz W. Analiza spożycia witamin rozpuszczalnych w tłuszczach przez dzieci w wieku przedszkolnym z Turku, in Polish [Analysis of fat-soluble vitamin intake in preschool children from Turek]. Med Rodz. 2015;18:55–60.
44. Merkiel S, Chalcarz W. Analiza spożycia witamin rozpuszczalnych w wodzie przez dzieci w wieku przedszkolnym z Turku, in Polish [Analysis of water-soluble vitamin intake in preschool children from Turek]. Med Rodz. 2015;18:110–5. 45. Merkiel S, Chalcarz W. Analiza spożycia składników mineralnych przez dzieci
w wieku przedszkolnym z Turku, in Polish [Analysis of mineral intake in preschool children from Turek]. Med Rodz. 2016;19:7–13.
46. Sochacka-Tatara E, Jacek R, Sowa A, MusiałA. Ocena sposobużywienia dzieci w wieku przedszkolnym, in Polish [Assessment of preschool children’s diet]. Probl Hig Epidemiol. 2008;89:389–94.
47. Szponar L, Sekuła W, Rychlik E, Ołtarzewski M, Figurska K. Badania indywidualnego spożyciażywności i stanu odżywienia w gospodarstwach
domowych, in polish [research on individual food intake and nutritional status in households]. Warszawa: InstytutŻywności iŻywienia; 2003. 48. Sadowska J, Radziszewska M, Krzymuska A. Evaluation of nutrition manner
and nutritional status of pre-school children. Acta Sci Pol Technol Aliment. 2010;9:105–15.
49. Great Britain Office for National Statistics Social Survey Division. National Diet and nutrition survey: young people aged 4 to 18 years. Volume 1: report of the diet and nutrition survey. London: Stationery Office; 2000. 50. Serra-Majem L, Ribas-Barba L, Pérez-Rodrigo C, Aranceta BJ. Nutrient
adequacy in Spanish children and adolescents. Br J Nutr. 2006;96: S49–57.
51. Kyttälä P, Erkkola M, Kronberg-Kippilä C, Tapanainen H, Veijola R, Simell O, Knip M, Virtanen SM. Food consumption and nutrient intake in Finnish 1-6-year-old children. Public Health Nutr. 2010;13(6A):947–56. https://doi.org/10.1017/ S136898001000114X.
52. Smpokos EA, Linardakis M, Papadaki A, Theodorou AS, Havenetidis K, Kafatos A. Differences in energy and nutrient-intake among Greek children between 1992/93 and 2006/07. J Hum Nutr Diet. 2014;27(Suppl 2):230–8. https://doi.org/10.1111/jhn.12122.
53. Bates B, Lennox A, Prentice A, Bates C, Page P, Nicholson S, Swan G. National Diet and nutrition survey. Results from years 1, 2, 3 and 4 (combined) of the rolling Programme (2008/2009–2011/2012). https:// www.gov.uk/government/statistics/national-diet-and-nutrition-survey- results-from-years-1-to-4-combined-of-the-rolling-programme-for-2008-and-2009-to-2011-and-2012. Accessed 20 July 2016 2014.
54. Food and Agriculture Organization of the United Nations. FAOSTAT. Cropps processed. http://www.fao.org/faostat/en/#data/QD. Accessed 26 June 2017. 55. Amorim Cruz JA. Dietary habits and nutritional status in adolescents over
Europe–southern Europe. Eur J Clin Nutr. 2000;54:S29–35. 56. EFSA Panel on Dietetic Products, Nutrition, and Allergies. Scientific
opinion on dietary reference values for fats, including saturated fatty acids, polyunsaturated fatty acids, monounsaturated fatty acids, trans fatty acids, and cholesterol. EFSA J. 2010;8:1461. https://doi.org/10.2903/ j.efsa.2010.1461.
57. Dietary Guidelines Advisory Committee. Scientific report of the 2015 dietary guidelines advisory committee. Washington: US Department of Agriculture, US Department of Health and Human Services; 2015.
58. DeSalvo KB, Olson R, Casavale KO. Dietary guidelines for Americans. JAMA. 2016;315:457–8. https://doi.org/10.1001/jama.2015.18396.
59. Law M. Dietary fat and adult diseases and the implications for childhood nutrition: an epidemiologic approach. Am J Clin Nutr. 2000; 72(suppl):1291S–6S.
60. Erkkilä A, de Mello VDF, Risérus U, Laaksonen DE. Dietary fatty acids and cardiovascular disease: an epidemiological approach. Prog Lipid Res. 2008; 47:172–87. https://doi.org/10.1016/j.plipres.2008.01.004.
61. Anderson JW, Baird P, Davis RH Jr, Ferreri S, Knudtson M, Koraym A, Waters V, Williams CL. Health benefits of dietary fiber. Nutr Rev. 2009;67:188–205. https://doi.org/10.1111/j.1753-4887.2009.00189.x.
62. Niinikoski H, Ruottinen S. Is carbohydrate intake in the first years of life related to future risk of NCDs? Nutr Metab Cardiovasc Dis. 2012;22:770–4. https://doi.org/10.1016/j.numecd.2012.05.002.
63. Institute for Health Metrics and Evaluation. Global Burden of Disease (GBD) Treemap. http://vizhub.healthdata.org/gbd-compare/. Accessed 26 July 2016. 64. Kudlová E, Schneidrová D. Dietary patterns and their changes in early
childhood. Cent Eur J Public Health. 2012;20:126–34.
65. Rao G, Kirley K, Weiss-Coleman R, Inman JJ, Bauer V, Zhou Y, Hledin V. Consumption patterns of sugar-sweetened carbonated beverages among children and adolescents. Curr Cardiovasc Risk Rep. 2015;9:17. https://doi. org/10.1007/s12170-015-0445-6.
66. Manz F, Wentz A. The importance of good hydration for the prevention of chronic diseases. Nutr Rev. 2005;63(6 Pt 2):S2–5.
67. Hernlund E, Svedbom A, Ivergård M, Compston J, Cooper C, Stenmark J, McCloskey EV, Jönsson B, Kanis JA. Osteoporosis in the European Union: medical management, epidemiology and economic burden. A report prepared in collaboration with the international osteoporosis foundation (IOF) and the European Federation of Pharmaceutical Industry Associations (EFPIA). Arch Osteoporos. 2013;8:136. https://doi. org/10.1007/s11657-013-0136-1.
69. Nemazannikova N, Antonas K, Dass CR. Vitamin D: metabolism, molecular mechanisms, and mutations to malignancies. Mol Carcinog. 2014;53:421–31. https://doi.org/10.1002/mc.21999.
70. Europe and annual sunshine hrs. http://www.city-data.com/forum/weather/ 1528337-europe-annual-sunshine-hrs-what-can.html. Accessed 25 July 2016. 71. Woo J, Kwok T, Leung J, Tang N. Dietary intake, blood pressure and
osteoporosis. J Hum Hypertens. 2009;23:451–5. https://doi.org/10.1038/jhh. 2008.156.
72. Miyazawa T, Shibata A, Sookwong P, Kawakami Y, Eitsuka T, Asai A, Oikawa S, Nakagawa K. Antiangiogenic and anticancer potential of unsaturated vitamin E (tocotrienol). J Nutr Biochem. 2009;20:79–86. https://doi.org/10. 1016/j.jnutbio.2008.09.003.
73. Mishra GD, Malik NS, Paul AA, Wadsworth MEJ, Bolton-Smith C. Childhood and adult dietary vitamin E intake and cardiovascular risk factors in mid-life in the 1946 British birth cohort. Eur J Clin Nutr. 2003;57:1418–25. https://doi. org/10.1038/sj.ejcn.1601706.
74. Meydani M. Vitamin E and atherosclerosis: beyond prevention of LDL oxidation. J Nutr. 2001;131:366S–8S.
75. Wang ZM, Zhou B, Nie ZL, Gao W, Wang YS, Zhao H, Zhu J, Yan JJ, Yang ZJ, Wang LS. Folate and risk of coronary heart disease: a meta-analysis of prospective studies. Nutr Metab Cardiovasc Dis. 2012;22:890–9. https://doi. org/10.1016/j.numecd.2011.04.011.
76. Merkiel S, Chalcarz W. The relationship between physical fitness, urine iodine status, and body-mass index in 6- to 7-year-old polish children. Int J Sport Nutr Exerc Metab. 2011;21:318–27.
77. Davidsson L, Almgren A, Juillerat MA, Hurrell RF. Manganese absorption in humans: the effect of phytic acid and ascorbic acid in soy formula. Am J Clin Nutr. 1995;62:984–7.
• We accept pre-submission inquiries
• Our selector tool helps you to find the most relevant journal • We provide round the clock customer support
• Convenient online submission • Thorough peer review
• Inclusion in PubMed and all major indexing services • Maximum visibility for your research
Submit your manuscript at www.biomedcentral.com/submit