Global Journal of Advanced Engineering Technologies and Sciences
PERFORMANCE ANALYSIS OF DSDV ROUTING PROTOCOL UNDER
CMM IN MOBILE AD HOC NETWORKS
Satveer Kour*
*Department of Computer Science & Engineering, GNDU RC, Sathiala, Amritsar, Punjab , India
Abstract
This paper presents preliminary work to address concern over DSDV protocol in mobile adhoc network. Firstly, we discussed the scalability design issues with related work in context of mobile adhoc network (MANET). Following, we design the simulation scenario. Finally, significance of scalability on the behavior of application, MAC, Transport and Physical layer performance is described.
Keywords:MANET; DSDV; CMM.
Introduction
In recent years, wireless multi-hop networks such as ad hoc networks, sensor networks and vehicular networks have been very important subject for research. A Mobile Ad Hoc Network (MANET) is a collection of wireless mobile terminals that is able to dynamically form a temporary network without any aid from fixed infrastructure or centralized administration. In recent years, MANET is continuing to attract the attention for their potential use in several fields. In order to ensure effective operation as the total number of nodes in the MANET becomes very large, the overhead of the employed routing algorithms should be low and independent of the total number of nodes in MANET. Mobility, node density and the absence of any fixed infrastructure make MANET very attractive for mobility and rescue operations and time-critical applications. Because of the nodes are free to move randomly, the topology of network may change rapidly and may be unpredictable, which makes the traditional protocol not suitable for MANET. The Mobility influences ongoing transmissions, since a mobile node that receives and forwards packets may move out of range. The movement pattern of MANET nodes is characterized by mobility models and each routing protocols exhibits specific characteristics of these models. In order to find the most adaptive and efficient routing protocol for dynamic MANET topologies, the behavior of routing protocols needs to be analyzed at varying node speeds, number of traffic nodes, network size, as well as node density. The desired challenges [1] in MANET includes: unreliability of wireless links between nodes, dynamic topologies, Lacking of secure boundaries, Threats from Compromised nodes inside the Network Lacking of centralized management facility, restricted power supply and scalability. Security issues [2] are also there like attacks, session hijacking, Eavesdropping, Jamming, Denial of Service etc.
The breakdown of the paper is as follows. Section 2 defines the scalability, their challenges and DSDV protocol within the context of mobile adhoc networks and Column Mobility Model. In section 3, we introduce the simulation scenario for MANET simulation framework for our experiment. The primary results of performance investigation based on scalability of mobile adhoc network are shown in section 4. Finally, in section 5, we conclude with a resultant about the scalability issue in mobile adhoc network.
Scalability Design Criterions And Related Work
DSDV PROACTIVE ROUTING PROTOCOL
Destination-Sequenced Distance-Vector Routing (DSDV) is a table-driven routing scheme for ad hoc mobile networks based on the Bellman–Ford algorithm. It was developed by C. Perkins and P.Bhagwat in 1994. The main contribution of the algorithm was to solve the routing loop problem. Each entry in the routing table contains a sequence number, the sequence numbers are generally even if a link is present; else, an odd number is used. The number is generated by the destination, and the emitter needs to send out the next update with this number. Routing information is distributed between nodes by sending full dumps infrequently and smaller incremental updates more frequently [5,6].
2.2 COLUMN MOBILITY MODEL (CMM)
The column mobility model represents a set of mobile nodes that move in a certain fixed direction. The research area in which column mobility model used is destroying mines by military robots. It is derived from RPGM with the main difference being that groups in CMM move in columns and not in random fashion. Let Pit=(Xit, Yit) be the position of
node i at time t and RPit= (Xit, Yit) be the reference point of node i at time t. At time slot t, the mobile node i is to
update its reference point RPit by adding an advance vector αit to its previous reference point RPit-1. So,
RPit= RPit-1 + αit ………Eq. (1)
where the advance vector αit is the predefined offset used to move the reference grid of node i at time t. After the
reference point is updated, the new position of mobile node i is to randomly deviate from the updated reference point by random vector wit. So,
Pit = RPit+ wit …..…….Eq. (2)
In Eq. 1, reference point has been calculated on the basis of advance vector, which is further used in calculation of finding next position of moving node shown in Eq. 2. If the mobile node goes beyond the boundary of a simulation field, it flipped to 180 degree. Thus the mobile node is able to move towards the center of simulation field in the new direction [7].
Simulation Scenario
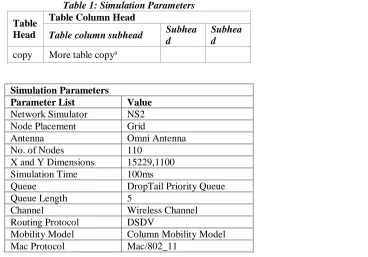
We have chosen NS2 over Windows platform for our simulation studies. NS2 is equally capable of simulating various wired and wireless scenarios from simple to complex conditions. In the simulation model, there are 110 nodes. The terrain condition is set as with X and Y dimensions 15229 and 1100 respectively. Simulation time is 100 ms. The type of wireless propagation model is Two Ray Ground. Table 1 shows the parameters of simulation scenario. Fig. 1 shows the working simulated scenario whereas throughput graph has shown in fig. 2 designed on NS2.
Table 1: Simulation Parameters
Table Head
Table Column Head
Table column subhead Subhea
d
Subhea d
copy More table copya
Simulation Parameters
Parameter List Value
Network Simulator NS2 Node Placement Grid
Antenna Omni Antenna No. of Nodes 110
X and Y Dimensions 15229,1100 Simulation Time 100ms
Queue DropTail Priority Queue Queue Length 5
Channel Wireless Channel Routing Protocol DSDV
Fig. 1: Designed Scenario
Fig. 2: Throughput Graph
Performance Analysis And Results
The comparison is drawn by measuring the following performance parameters:
a) Packet Delivery Ratio (PDR) is defined as the ratio of data packets delivered successfully to destination nodes and the total number of data packets generated for those destinations. PDR characterizes the packet loss rate, which limits the throughput of the network [8]. The higher the delivery ratio better is the performance of the routing protocol. PDR is determined as:
PDR= (Pr / Ps) x 100
Where Pr is the total packets received and Ps is the total packets sent. Fig. 3 shows the PDR value which is 94.9643%.
Fig. 3: Packet Delivery Ratio 0
50 100
DSDV
Packet Delivery Ratio
(%)
Packet Delivery Ratio (%)
b) Average End to End Delay (Davg) indicates that the time taken for a packet to travel from the source node
application layer of the destination node. It also includes the route discovery wait time that may be experienced by a node when a route is initially not available. The average end to end delay is computed as:
Davg =Ʃ (tr - ts) / Pr
where ts is the packet send time and tr is the packet receive time for the same packet at destination. Fig. 4 shows the
average end to end delay value which is 10.1331 ms.
Fig. 4: Average End-to-End Delay
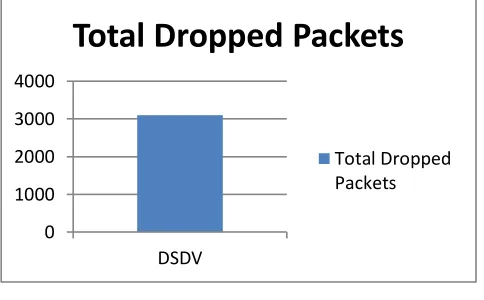
c) Average Packet Loss: This is the number of packets lost due to incorrect or unavailable routes and MAC layer collisions [9]. Fig. 5 shows the graphical representation of dropped packets value which is 3098.
Fig. 5: Average Packet Loss
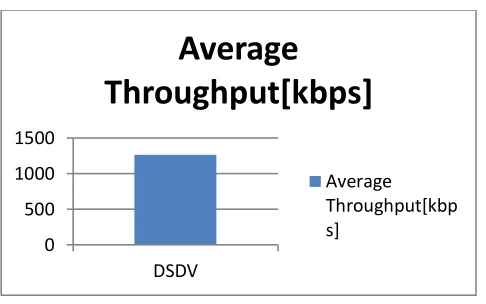
d) Throughput: It is the average rate of successful message delivery over a communication channel [10]. Fig. 6 shows average throughput in kilo bits per second unit which is 1268.37.
0 5 10 15
DSDV
Average End-to-End
Delay(ms)
Average End-to-End Delay(ms)
0 1000 2000 3000 4000
DSDV
Total Dropped Packets
Fig. 6: Average Throughput
On executing the designed scenario at starting point, output will be shown as: num_nodes is set 110
INITIALIZE THE LIST xListHead
channel.cc:sendUp - Calc highestAntennaZ_ and distCST_ highestAntennaZ_ = 1.5, distCST_ = 550.0
SORTING LISTS ...DONE!
Conclusion
In this paper, we concluded with the behavioral analysis of the DSDV protocol for scalability issue in mobile adhoc network. We analyzed the CMM model for QoS parameters like average jitter, average packet loss, throughput, end to end delay and packet delivery ratio. Graphical representation clearly shows the outcome of DSDV (in form of PDR, Throughput, Average end to end delay, Packet Dropped rate). All the outcome values are clearly written in section 4. Further enhancement can be done by increasing network load and using other protocols into the network scenario.
References
1. Z. Ishrat, Security issues, challenges & solution in MANET, IJCST Vol. 2, Issue 4, pp. 108-112, 2011. 2. P. Goyal, V. Parmar, R. Rishi, MANET: Vulnerabilities, Challenges, Attacks, Application, IJCEM, Vol. 11,
pp. 32-37, 2011.
3. L.C. Lee, H.S. Nwana, D.T. Ndumu, P. De Wilde, The stability, scalability and performance of multi-agent systems, BT Technol. J. 16(3) pp. 94-103, 1998.
4. A.B. Boondi, Characteristics of scalability and their impact on performance , Proceedings of the 2nd
International Workshop on Software and Performance, pp. 195-203, 2000. 5. https://en.wikipedia.org/wiki/Destination-Sequenced_Distance_Vector_routing.
6. B. S. Gouda, A. B. Mandai, K.L. Narayana, Simulation and comparative analysis of energy conservation performance metric for ERAODV, AODV and DSDV routing protocols in MANET, WICT, pp. 278-282, 2012.
7. M. L. Sichitiu, Mobility Models for Ad Hoc networks,www4.ncsu.edu/~mlsichit/Research/ Publications/mobilityChapter.pdf, pp. 1-17.
8. Q. Razouqi, A. Boushehri, M. Gaballah, L. Alsaleh, Extensive Simulation Performance Analysis for DSDV, DSR and AODV MANET Routing Protocols, WAINA, pp.: 335-342, 2013.
9. A. K. Maurya, D. Singh, A. Kumar and R. Maurya, Random Waypoint mobility model based performance estimation of On-Demand routing protocols in MANET for CBR applications, INDIACom, pp.: 835-839, 2014.
10. L. U. Khan, F. Khan, N. Khan, P. Bilal, Effect of network density on the performance of MANET routing protocols, ICCPCT, pp.: 1089-1092, 2013.
0 500 1000 1500
DSDV