MEASURING THE EFFICIENCY OF AIR NAVIGATION SERVICES
SYSTEM BY USING DEA METHOD
Mara Ćujić1, Milica Jovanović21, Gordana Savić3, Maja Levi Jakšić4
1 Serbia and Montenegro Air Traffic Services SMATSA LLC, Trg Nikole Pašića 10, 11000 Belgrade, Serbia 2, 3, 4 University of Belgrade, Faculty of Organizational Sciences, Jove Ilića 154, 11000 Belgrade, Serbia
Received 9 November 2014; accepted 24 December 2014
Abstract: This paper examines the possibilities for measuring performance of current Air Navigation Services Providers (ANSPs) in Europe. ANSPs are in the process of operational integration into functional air blocks (FABs) tracking direction towards Single European Sky goals, but there are a lot of obstacles and air traffic management is still organized in a fragmented way. This is a reason for comparing national ANSPs. A Data Envelopment Analysis (DEA) is applied as a tool for performance measurement. Effectiveness of 36 units of ANS system is measured and the limitations and benefits of this kind of performance model are presented.
Keywords:air navigation services, cost-efficiency, data envelopment analysis, performance measurement.
2 Corresponding author: [email protected]
1. Introduction
World-wide airspace is becoming gradually congested due to increased number of flying aircraft, complexity of air traffic flows and operational intricacy. Nowadays, airspace over Europe is not so competitive concerning performance results in comparison to its US peer and in a certain way, it is perceived as costly and inefficient. This is mostly the result of airspace fragmentation and service provision performed within national boundaries. As anticipated in the ATM Master Plan (SESAR, 2012) the airspace fragmentation and organization, diverging rules and operational procedures have negative impacts on airspace capacity disabling cost-efficiency. Moreover, increased traffic delays and ANS provision costs have a direct impact on cost-effectiveness and productivity, which are
measuring the efficiency of airspace units, by using selected indicators of this methodology as inputs and outputs.
Short description of the problem is given in the next section followed by data and efficiency measurement methodology description. The results and their analyses are given in the third section. Finally, conclusions and future research direction are given in the fourth section.
2. Problem Identification
The area of ANS provision is a very complex system depending on integration of human resources, advanced technology and severe rules where the safety and quality are leading drivers. Furthermore, cost-effectiveness improvement is additionally important and challenging task that should be reached while maintaining the same reliability in users’ expectations. This requires controlling and monitoring different factors in order to achieve appropriate performance results. Since these factors present a bunch of diverse parameters that might be observed as inputs and outputs in DEA analysis, this method is very appropriate for measuring efficiency of A NSPs. Besides, a very important feature of DEA method is that inputs and outputs of certain DMU are not necessary to be homogeneous, but it is essential that all DMUs used in analysis have the same inputs and outputs (Savic, 2012). This is an additional reason for making DEA methodology suitable for measuring efficiency of ANSP because almost all ANSPs in Europe are integrated in a unique reporting system. Information related to ANSPs’ performance is reported in standardized manner to the PRU on a yearly basis, which makes them available for benchmarking analyses. There are some
to the Performance Review Commission (PRC) methodology, and they are considered as essential for the evaluation of ANSP’s efficiency.
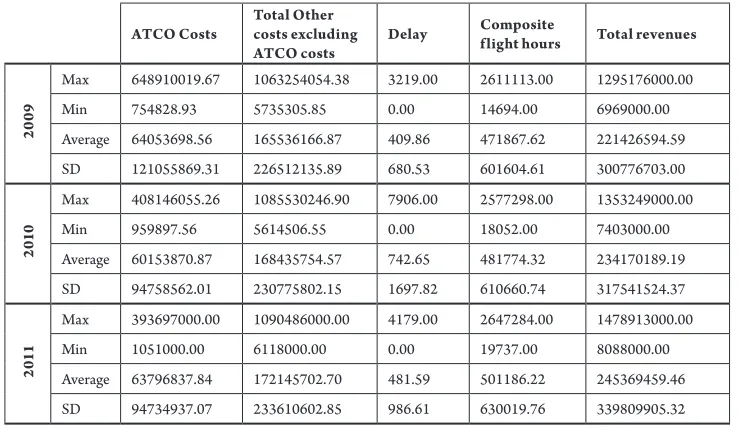
Although initially there were 9 parameters for measuring, because of the high correlations among the certain parameters, as well as non-comparable values which depends on the size of the air space (i.e. Number of operational units), for calculating the efficiency score following 5 parameters were used: Air Traffic Control Officers (ATCO) Costs, Total costs excluding ATCO costs, Delay, Composite flight hours, Total revenues. ATCO Costs and Total other costs excluding ATCO costs are two values derived taking into account Support cost ratio. This relation represents the ratio of total ATM/CNS provision costs to the costs for employing ATCOs. In other words, it indicates for each euro (or any other currency) spent on employing ATCOs, the additional euros spent on other costs (comprising other staff costs, non-staff operating costs, and capital-related costs). Composite flight hours represent a “gate-to-gate” measure, which combines en-route flight-hours controlled and IFR airport movements controlled. Composite gate-to-gate flight-hours were defined as en-route flight-hours plus IFR airport movements weighted by a factor that ref lected the relative (monetary) importance of terminal and en-route costs in the cost base (PRU, 2013). Total En-route revenues represent the sum of income from charges and all other categories related to revenues as it is: income from delegation, income from military, income from domestic government, other revenues, financial income, other income (excluding financial) as well as exceptional items. Concerning income from charges, according to the Eurocontrol Specification, this is the revenue billed during the year,
without any adjustment for under/over recovery. In other words, this represents an income from ANS activities. As it is already mentioned, all Eurocontrol states recover its en-route revenues through the Eurocontrol Route Charges System administered by the CRCO. In some states, terminal navigation charges are recovered as well. Usually the income from charges represents more than 90% of total en-route revenues. Delays – Air Traffic Flow Management (ATFM) delays can be interpreted as a measure of the quality of the service. By reducing the delay time, ANSPs ensure grater satisfaction of their customers (airspace users) and at the same time reduce its costs. In this analysis will be used the total number of minutes of ATFM delays. According to the (PRU, 2013) ATFM delays represented around 16% of the total economic gate-to-gate cost in 2011 while in 2010 the value was around 23%. Data selected to be used in DEA analysis presents a group of endogenous factor that are completely under control of ANSP. Descriptive statistics of the data during the observed period is given in the Table 1. The trend of cutting of high ATCO cost from the 2009 to 2011 from more than 640 billion to above 400 billion is obvious. Cutting costs were probably found as the main source for improving the efficiency since the composite flight hours and revenues have been slightly increased.
selected in order to determine the efficiency of the observed units (PRC&FAA, 2013). For the purpose of this paper DEA method with undesirable outputs is used to include a delay as undesirable output, which should
be decreased in order to increase efficiency. This method divides output items into good (desirable) and bad (undesirable) while both types of outputs have no inter-relationship (Kumar-Mantri, 2008).
Table 1
Descriptive Statistics of Inputs and Outputs
ATCO Costs Total Other costs excluding ATCO costs Delay
Composite
flight hours Total revenues
20
09
Max 648910019.67 1063254054.38 3219.00 2611113.00 1295176000.00
Min 754828.93 5735305.85 0.00 14694.00 6969000.00
Average 64053698.56 165536166.87 409.86 471867.62 221426594.59
SD 121055869.31 226512135.89 680.53 601604.61 300776703.00
20
10
Max 408146055.26 1085530246.90 7906.00 2577298.00 1353249000.00
Min 959897.56 5614506.55 0.00 18052.00 7403000.00
Average 60153870.87 168435754.57 742.65 481774.32 234170189.19
SD 94758562.01 230775802.15 1697.82 610660.74 317541524.37
20
11
Max 393697000.00 1090486000.00 4179.00 2647284.00 1478913000.00
Min 1051000.00 6118000.00 0.00 19737.00 8088000.00
Average 63796837.84 172145702.70 481.59 501186.22 245369459.46
SD 94734937.07 233610602.85 986.61 630019.76 339809905.32
DEA model with undesiarble outputs
DEA, as non-parametric technique for relative efficiency evaluation of decision making units (DMUs), has been introduced by Charnes et al. (1978) to incorporate multiple inputs and outputs into analyses. Models have been further modified to accommodate real world problems. One of them is DEA model with undesirable outputs. It is based on the Slack Based Measures (SBM) (Tone, 2001). Let us suppose that values of inputs xij, i = 1,..., m and outputs
yrj, r = 1,...,s1of DMUj, j = 1,...,n are available.
Basic rational SBM model for measuring relative efficiency of DMUk is given by Eqs. (1)-(5). 1 2 1 1 1 1 1 / (min) 1
1 / /
m
i ik
i
s s
g rk b rk
r r
s x m
s y s y
s ρ − = + + = = − = + +
∑
∑
∑
(1)s.t.
1
,
1,...,
n
ij j i ik
j
x
λ
s
−x
i
m
=
+
=
=
∑
(2) 1 1,
1,...,
n g grj j r rk
j
y
λ
s
y
r
s
=
−
=
=
(4)
(5)
where ρ represents non-radial relative efficiency of DMUk. Virtual weights assign to each DMUj, λj revels the importance of
DMUj, j = 1,...,n in forming pear unit for inefficient units. Slack values (Si–,S
r g, S
r b)
represent values of necessary directional decreasing of inputs and bad outputs and increasing of good outputs obtained by solving model (1)-(5). The unit DMUk will be efficient just of zero values of all slacks e.g. there are no need for input of output improvement. This model can be transform into an equal linear form by well-known Charnes-Cooper transformation for the purpose of easier solving. The results of applying LP DEA with undesirable outputs on the relative ANSPs measurement are given in the following section.
3. The Results of DEA Applications
Results of DEA application (Table 2) reveal gradual improvements in average efficiency score from 2009 (0.589) to 2011 (0.752), but also increase of the number of efficient units, which reached the highest level in 2011. In other words, the number of efficient units has been more than doubled from 5 in 2009 to 12 in 2011. Regardless of this, values between the minimum and average efficiency scores exhibited a steady range and flattened out at doubled amount in favour of average figures. This indicates large discrepancy in efficiency results among ANSPs and large numbers of those units that are still inefficient despite the increase of average score.
According to the results the most frequent reference unit is EANS, which was reference for 31 unit in 2009, and 20 in 2010, and 2011. These results are the same as in the PRC methodology which is also focused on cost efficiency. Achieved efficiency scores of the selected 36 units show that there are certain changes in these three years. Some units had similar results, but there were also large improvements and declines in efficiency scores. Also, the weights, which were given to the inputs and outputs, were significantly different from year to year. Moreover, in the most cases, the weight value was 0, which excluded certain parameters form the efficiency score composition. Observing the structure of the efficiency scores, it can be noted that Composite flight hours and Delay
are the most excluded with weighing with 0. However, there is still large number of units where all of the parameters are included in forming the score.
Concerning efficient units, EANS, LGS, MoldATSA and NATA Albania, there were efficient in every observed year, and (except Delays for LGS and MoldATSA), all of the parameters were included in the calculation of efficiency score, which implies that they achieved high values for each parameter. Considering inefficient units, Aena improved its efficiency the most (positive changes in scores are marked with green colour in Table 1), and from 35th position, moved to 26th unit
of efficiency score (market red in Table 1), M-NAV changed the most its position, and from efficient unit in 2010, become
inefficient on 19th place. The change in
this rank was caused by decrease of Total revenues and Composite flight hours.
Table 2
Efficiency Scores and Ranks of ANSP Units
ANSP Efficiency score2009 2010 2011 Rank2009 2010 2011
Aena 0.3210 0.4124 0.55647 35 35 26
ANS CR 0.5543 0.5721 0.63527 15 20 24
ARMATS 0.9894 1.0000 1.00000 6 1 1
Austro Control 0.4189 0.4589 0.46202 31 33 35
Avinor (Continental) 0.5257 0.5390 0.54656 18 25 28
Belgocontrol 0.3023 0.3357 0.38314 36 36 36
BULATSA 0.6174 0.7857 0.78872 11 13 16
Croatia Control 0.5427 0.5667 0.55093 16 23 27
DCAC Cyprus 0.6282 0.6304 0.69993 9 16 20
DFS 0.4263 0.4685 0.49052 30 32 33
DHMI 0.8600 1.0000 1.00000 7 1 1
DSNA 0.4398 0.4695 0.52964 29 30 29
EANS 1.0000 1.0000 1.00000 1 1 1
ENAV 0.4099 0.4785 0.47866 32 29 34
Finavia 0.4606 0.4885 0.52556 26 28 30
HCAA 0.4764 0.5579 0.60323 22 24 25
HungaroControl 0.5571 0.6428 1.00000 13 15 1
IAA 0.5250 0.6086 0.85955 19 18 14
LFV 0.5168 0.4920 1.00000 20 27 1
LGS 1.0000 1.0000 1.00000 1 1 1
LPS 0.4735 0.5111 0.67608 23 26 21
LVNL 0.3700 0.4199 0.52170 34 34 31
MATS 0.4492 0.5924 1.00000 28 19 1
M-NAV 0.7876 1.0000 0.70054 8 1 19
MoldATSA 1.0000 1.0000 1.00000 1 1 1
NATA Albania 1.0000 1.0000 1.00000 1 1 1
NATS (Continental) 0.5351 0.5696 1.00000 17 22 1
NAV Portugal (Continental) 0.4516 1.0000 1.00000 27 1 1
NAVIAIR 0.4783 0.5703 0.65712 21 21 22
Oro Navigacija 0.5762 0.7363 0.90817 12 14 13
PANSA 0.5543 0.6106 0.64908 14 17 23
ROMATSA 0.4631 1.0000 1.00000 25 1 1
Skyguide 0.4713 0.4686 0.51745 24 31 32
Slovenia Control 0.4089 1.0000 0.72479 33 1 18
SMATSA 0.6272 0.7991 0.76741 10 12 17
UkSATSE 1.0000 0.8280 0.82207 1 11 15
Max 1.000 1.000 1.000
Min 0.302 0.336 0.383
Average 0.589 0.684 0.752
SD 0.215 0.224 0.210
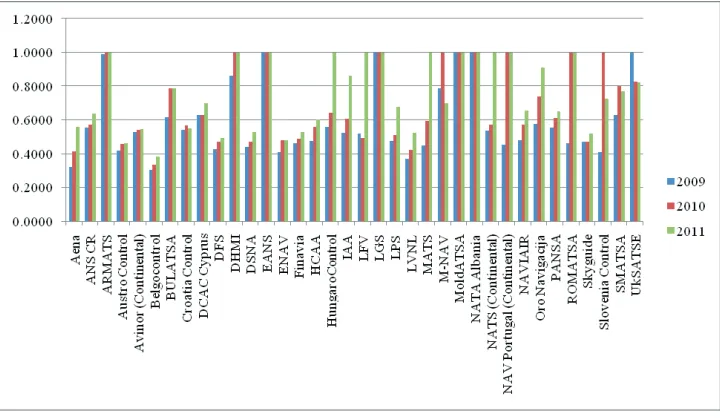
Even though relative efficiency from two different years is not directly comparable, the trend can be catch. The Fig. 1 reveals more clearly the trend of relative efficiency for each ANSP and discrepancy between efficiency measures in different years. The left bar shows the level of relative efficiency in 2009, the middle one shows the relative efficiency in 2010 and right one is equal to efficiency in 2011. Obviously, there are much
more units with efficiency less than 0.5 in 2009 (16) than in 2011 (4) due to general decreasing of costs. Some of the observing ANSPs, such as Hungaro Control, IAA, LFV, MATS and NATS made a big step in relative efficiency from 2010 to 2011. The source of this improvement mainly lays in increasing the revenues and decreasing the delays. They can be used as a role model for performance changing.
Fig. 1.
Relative Effciency of ANSPs
The ANSPs are grouped by efficiency scores and their numbers are given in the Table 3. These groups consist of different number of ANSPs over the observing period. Clearly, total number of units in the last two groups
(considered as close to efficient and fully efficient) is increasing from 7 to 15. Through analysis of the group members and their own performance would be useful for clustering of ANSPs even for making new functional blocks.
Table 3
Efficiency Groups
Efficiency 2009 2010 2011
<0.5 16 10 4
>=0.5 and <0.8 13 15 17
>=0.8 and <1 2 1 3
4. Conclusion
Organization of European airspace will definitely endure major changes in the near future. Taking into consideration formally imposed requirements and other drivers fastening the implementation of SES, ANSPs must undergo concrete steps in order to improve overall performance. This paper examines the additional tools for measuring the efficiency of ANSP units. In efficiency measuring, there must be carefully determine which parameters are used for its calculation, and in case of DEA application, the determination of inputs and outputs must be carefully performed, as well as the model which will be used for the calculation of efficiency scores. In this paper, authors used DEA model with undesirable outputs, since the problem is very specific because of the Delay parameter, which can be considered as the output which should be minimized. The results showed that the average efficiency in these three years increased. The number of efficient units was also increased, and some units improved their efficiency. This was mainly caused by the changes in cost management in these organizations, but also as a consequence of the decrease of the traffic volume. Thus, in order to determine real causes for efficiency improvement there must be performed detailed analysis. Also, the further research should be directed towards other DEA tools used for measuring efficiency over time period (Window DEA analysis and Malmquist Index) in order to get impression whether there are positive or negative changes in ANSPs’ performance, as well as the usage of additional input and output parameters not being used in this paper (i.e. number of stuff). Because of certain incompliance in the observed set of units, such as the size of air space, total costs and revenues, DEA method should
be performed with unit inputs and outputs rather than nominal. Analysis performed in this paper shows that, with certain corrections and improvements, DEA method is very suitable for solving the efficiency measurement of air space units and in the future certain efforts should be made in order to improve this tool for its usage in performance management in the aviation sector.
References
Button, K.; Neiva, R. 2013. Single European Sky and the Functional Airspace Blocks: Will they improve economic efficiency?, Journal of Air Transport Management. DOI: http://dx.doi.org/10.1016/j.jairtraman.2013.06.012, 33: 73-80.
Button, K.; Neiva, R. 2014. Economic Efficency of European Air Traffic Control Systems, Journal of Transport Economics and Policy, 47(1): 65-80.
Charnes, A.; Cooper, W.W.; Rhodes, E. 1978. Measuring the efficiency of Decision Makin Units, European Journal of Operational Research. DOI: http://dx.doi. org/10.1016/0377-2217(78)90138-8, 2(6): 429-444.
Eurocontrol. 2014. Performance Review Unit. Available from Internet: <http://www.eurocontrol.int/articles/ performance-review-unit>.
Kumar-Mantri, J. 2008. Research Methodology on Data Envelopment Analysis (DEA). Boca Raton, Florida, USA.
PRC&FAA. 2013. Comparison of Air Traffic Management-R elated Operational Per for mance: US/Europe .
Eurocontrol&FAA.
PRU. 2011. ATM Cost-Effectiveness (ACE) 2009 Benchmarking Report with 2010-2014 outlook. Eurocontrol.
PRU. 2013. ATM Cost-Effectiveness (ACE) 2011 Benchmarking Report with 2012-2016 outlook. Eurocontrol.
Savić, G. 2012. A Comparative Analysis of the efficiency in the Financial Sector. Faculty of Organizational Sciences (FOS), University of Belgrade.
SESAR. 2012. European ATM Master Plan-The roadmap for sustainable Air Traffic Management. Eurocontrol.