EFFECT OF PEDESTRIANS UN-SIGNALIZED MID-BLOCK
CROSSING ON VEHICULAR SPEED
B Raghuram Kadali1, Tadi Chiranjeevi2, Rankireddy Rajesh3 1, 2, 3 Bapatla Engineering College, Bapatla 522 101, India
Received 8 September 2014; accepted 18 February 2015
Abstract: Pedestrian is one of the important component in urban transportation system and also vulnerable at protected mid-block locations under mixed traffic conditions. At un-protected mid-block locations, some of the vehicles may yield to pedestrians who are already at crosswalk location. However, some of the pedestrians are using forced gaps to cross the road. Hence,while pedestrians use the mid-block crosswalk with forced gaps, which decreases the vehicular flow characteristics. The pedestrian sidewalks do not show a direct effect on the vehicular flow characteristics when the pedestrian have pleasant walking facilities. The present study has analyzed the effect of pedestrian crossing on the characteristics of vehicular flow at mid-block location under mixed traffic conditions. The results indicate that the pedestrian forced gap condition has significant effect on vehicular characteristics. The study results may be useful for decreasing the travel time for vehicular drivers by controlling usage of pedestrian forced gaps.
Keywords: pedestrian, sidewalk, mid-block, cross-flow, vehicular characteristics.
1 Corresponding author: brkadali@gmail.com
1. Introduction
The un-protected mid-block location is one of the important components in the urban transportation system for pedestrian activities under mixed traffic conditions especially in countries like India. The number of such un-protected mid-block pedestrian road crossing activities has been increasing in Indian context and growth of these activities may also result in pedestrian accidents. The increase in un-protected mid-block pedestrian road crossings has been significant effect on vehicular characteristics such as an increase in travel times and decrease in vehicle speed. At signalized mid-block and intersection, there is the complete right-of-way to pedestrians and vehicles as
types of crossings i.e. at-grade and grade-separated. If the pedestrians are completely segregated (grade-separated) with vehicular traffic, then there is no effect of pedestrian crossings on vehicular flow characteristics. The grade separated facilities are provided exclusively based on the vehicle as well as pedestrian traffic intensity. If, such grade separated crosswalks are too apart from each other, then pedestrians either change their road crossing choice according to their destination which will result in more travel time or pedestrian will use forced gaps to cross the roads. Also, due to poor construction of grade separated facilities and road side development, pedestrians usually cross the road at unprotected mid-block locations under mixed traffic conditions. However, in mixed traffic condition it is very rare to get adequate vehicular gaps to cross the road. Hence, pedestrians will exhibit non-complaint road crossing behaviour, causing more interference with vehicles. It leads to rigorous change in vehicular flow characteristics such as speed and flow. A number of research studies have been carried out on vehicular flow characteristics on freeways, bottlenecks, merged lanes etc., but studies on effect of pedestrian crossing on vehicular flow characteristics are very few. In this context, the objective of present study is to investigate the effect of pedestrian crossing on vehicular speed. More precisely, this research aims to study the vehicular flow characteristics with and without pedestrian crossings along the same roadway section with same geometry properties. The paper is structured as follows: Section 1 gives the brief introduction of the pedestrian mid-block crossing under mixed traffic conditions. Section 2 describes the literature
the results. Brief discussions of results are presented in Section 5 and conclusions are presented in Section 6.
2. Literature Review
is beyond three car-length upstream from the yield line. Silva et al. (2013) studied the effect of crosswalk location on roundabout performance, it was considered with vehicular f low and travel times by the simulation model. The results proved that there is a significant influence of the pedestrian crossing in terms of average travel time and for high vehicle traffic. Ashalatha et al. (2013) studied the effect of bus stops on capacity reduction of urban roads under mixed traffic conditions. From the results, they concluded that bus bays and curb side bus stops can reduce the capacity of urban roadways by 8.1% and 25.6% respectively. Chandra et al. (2014) studied the effect of pedestrian cross flow on capacity of urban arterials in mixed traffic condition. From the results, they concluded that pedestrian volume of 100 ped/hour crossing the road will reduce its capacity by 3.52 percent. Farouki and Nixon (1976) studied the effect of the carriageway width on speed of cars in the special case of free flow conditions in sub-urban roads. From the results, it was found that the mean free speed of cars in sub-urban area increases linearly with increase in the carriageway width over a certain range of width (5.2m to 11.3m). Yagar and Van Aerde (1983) found that vehicular traffic speed changes exponentially with change in lane width. Raymond and Knoblauch (2000) studied the effect of crosswalk markings on vehicle speed. From the results, it was found that drivers slightly reduce vehicle speed by yielding to the pedestrians. Hakkert et al. (2002) evaluated the effect of the pedestrian crosswalk warning system on vehicle speed by means of embedded flash lights in pavement. The results inferred that vehicle speed will reduce by 2 to 5 kmph due to the yielding to pedestrians. Some authors addressed the characteristics
of vehicles and pedestrians on different crossing conditions by studying the three conditions of the pedestrian crossing, including crossing freely, crossing at non-signalized crosswalk, and crossing at the signalized crosswalk. From the results, they concluded that selecting appropriate crossing mode for pedestrians can effectively decrease the vehicle delay, especially when the heavy pedestrian flow exists (Shumin and Yulong, 2007).
and vehicular flow characteristics (speed, vehicular flow etc.) at un-protected mid-block locations due to non-complaint road crossing behaviour of pedestrian. Improper modeling and designing of pedestrian facilities have adverse effects on vehicular flow characteristics and safety of pedestrian. Also the type of regulation (signalized or partial controlled) and road geometry play a key role in vehicular flow characteristics (Brumfield et al., 2013). Ottomanelli et al. (2012) has developed pedestrian vehicle interaction simulation based model and it is useful to evaluate the pedestrian safety as well as performance of the vehicular flow. In the urban transportation system at some locations (school zone and residential areas) the effect of vehicular traffic is reduced by implementing raised pedestrian crosswalks. Some research studies were carried on effect of raised pedestrian crosswalks on urban vehicular traffic speed (Mohammadipour et al., 2012). However, the improper mid-block crosswalk location was deliberates the pedestrian crossing behaviour. Moreover this crossing behaviour leaves a deleterious impact on traffic stream. Few research studies address the effect of pedestrian
crosswalk on capacity of urban arterials at unprotected mid-block locations under mixed traffic condition. However, very few studies have employed effect of pedestrian crossing on vehicle speed at unprotected mid-block locations under mixed traffic condition. In this background, the objective of the study is to find out the vehicular speed with considerations of vehicle flow characteristics at two different locations with and without pedestrian crossings.
3. Methodology
3.1. Site Selection
A zebra cross marked location was selected to allow for a minimum pedestrian cross flow at mid-block location to study the effect of pedestrian crossings on vehicular flow. The selected second location is approximately 300 m away from the previous location on the same roadway corridor with same geometry (mid-block location) and there was a full barrier to prevent the pedestrian crossings for the stable vehicular flow condition. The photographs of the two locations are shown in Fig. 1.
Location (1): Pedestrian zebra cross at mid-block Location (2): Non-pedestrian crossing mid-block
Fig. 1.
Study Locations and Traffic Composition (1) Vehicular Flow Interrupted by Pedestrian Crossing (2) Uninterrupted Vehicular Flow Condition
3.2. Data Collection
Videotaping survey was conducted at both locations during a normal weather working day condition in Guntur, Andhra Pradesh, India. The survey was conducted during two peak flow conditions morning (8:00-10:00 AM) and evening (4:00-6:00 PM). The video camera was located on top of a building. The total road section was divided into 20 m sections of white cello tape to find out the speed of the vehicle and also vehicular flow values. The video was played in Corel studio software in order to stop and view the time frame and data was extracted at an accuracy of 1 in 33 sec. From each time step (5 min), data were collected which includes pedestrian and traffic characteristics. In particular, to study the individual vehicular effect by pedestrian crossing, data was collected every 5 min and it is approximated to hourly traffic in order to get the each hour traffic flow characteristics. The collected data include a number of pedestrians, type of vehicle, vehicular flow, and vehicle speed.
3.3. Model Formulation
Explanations of traffic flow theory at a point are based upon the three quantities speed (v), flow (q) and density (k) usually considered in traffic flow modeling. Analysis of their definitions leads in the case of homogeneous traffic directly to the formula that has become known as the fundamental equation (Greenshields, 1935). The fundamental equation as follows:
q = k * v (1)
v = f (k) (2)
Traffic flow can be analyzed effectively based on these relationships ((Lighthill and Whitham, 1955).
When Eq. (2) is populated with an explicit form, any one of the three variables (speed
v, flow q, and density k) can be used to calculate values for the other two, subject to the ambiguity between free-flow and congested flow values of q.
Complex models of traffic flow have been developed that use Eq. (2) as an equilibrium relationship for steady-state flows, towards which traffic speed will relax over time and the same relationships are also used for the unsteady state of flow condition in order to check the vehicular flow.
4. Results
4.1. Observations of Field Study
The descriptive statistics of the collected speed of the each category of the mode was presented in the Table 1. From the field survey, it is observed that there is significant difference between speeds of the vehicles at selected locations (with and without pedestrian crossing). The hypothesis test was conducted, (the null hypothesis H0: there is no significant
difference between with and without pedestrian crossings on vehicular speeds and alternative hypothesis Ha: there is significant
difference) the null hypothesis rejected from the ANOVA test and corresponding p-value 0.000 and F-value is 27.244. The ANOVA test indicates that there is significant difference means of with and without pedestrian crossing on vehicular speeds.
Table 1
Vehicular Flow Characteristics Relationships with Pedestrian and without Pedestrian Crossing Conditions
Location Type of variable
Speed in Kmph
Minimum Maximum Mean Standard deviation
Location 1 (Mid-block with pedestrian crossings)
All vehicles 8.6 35.86 21.04 6.85
Car 11.4 28.96 21.4 8.84
Two wheeler 25.22 42.24 28.24 7.65
Auto Rickshaw (Three wheeler) 8.24 24.04 14.22 9.64
Heavy vehicles 8.86 21.44 17.04 5.14
Location 2 (Non- pedestrian crossing mid-block)
All vehicles 18.98 65.24 28.75 16.02
Car 21.24 54.86 32.44 10.46
Two wheeler 26.68 64.24 33.68 9.88
Auto Rickshaw (Three wheeler) 17.68 36.67 21.02 8.88
4.2. Vehicular Flow Characteristics with
and without Pedestrian Crossing
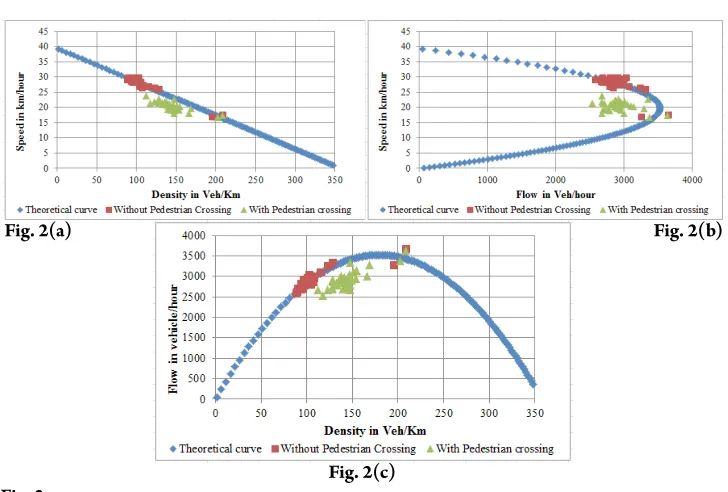
The data such as vehicular flow, speed and density were computed at pedestrian crossing and pedestrian crossing restricted location. In order to study the effect of pedestrian crossing on vehicular flow characteristics the total combined traffic was considered and relationship were plotted between speed and density, speed and flow, flow and density and are presented in Fig. 2. The scattered plot of data points recommended a straight-line relation between vehicle speed and density; quadratic relationship between vehicular speed and flow, and vehicular flow and density. In order to study the effect of
pedestrian crossing on individual vehicle; individual vehicular flow, speed and density (each type of vehicle separately treated) were also measured from the field data and relationships were also developed. From these individual vehicular characteristics, the driver’s yield behaviour at pedestrian crossings can be studied. If the particular vehicular flow characteristics change drastically, it implies that vehicular drivers give more space to the crossing pedestrian. The relationships were developed for combined data (see in Table 2 and Fig. 2) and also for individual mode; the calculated relationships from the analysis of data at two study locations, are presented in Table 2. The correlation coefficient R2 varies
from 0.11 to 0.94 at various conditions.
Fig. 2(a) Fig. 2(b)
Fig. 2(c) Fig. 2.
Table 2
Vehicular Flow Characteristics Relationships with Pedestrian and without Pedestrian Crossing Conditions
Location Traffic Type Crossing Condition Relation Model equation R2 value
1 All vehicles With pedestrian
Speed-density v= 29.91−0.065 * k 0.647
Flow-speed q= v (29.91−v) /0.065 0.212
Flow-density q= k (29.91−0.065 * k) 0.676
1 Car With pedestrian
Speed-density v= 21.83−0.209 * k 0.404
Flow-speed q= v (21.83−v) /0.209 0.38
Flow-density q= k (21.83−0.209 * k) 0.618
1 Two wheeler With pedestrian
Speed-density v= 40.10−0.205 * k 0.645
Flow-speed q= v (40.10−v) /0.205 0.201
Flow-density q= k (40.10−0.205 * k) 0.256
1
Auto Rickshaw (Three wheeler)
With pedestrian
Speed-density v= 27.47−0.178 * k 0.415
Flow-speed q= v (27.47−v) /0.178 0.12
Flow-density q= k (27.47−0.178 * k) 0.776
2 All vehicles Without pedestrian
Speed-density v= 39.91−0.101 * k 0.938
Flow-speed q= v (39.91−v) /0.101 0.565
Flow-density q= k (39.91−0.101 * k) 0.711
2 Car Without pedestrian
Speed-density v= 29.89−0.264 * k 0.233
Flow-speed q= v (29.89−v) /0.264 0.121
Flow-density q= k (29.89−0.264 * k) 0.256
2 Two wheeler Without pedestrian
Speed-density v= 42.43−0.188 * k 0.556
Flow-speed q= v (42.43−v) /0.188 0.112
Flow-density q= k (42.43−0.188 * k) 0.256
2
Auto Rickshaw (Three wheeler)
Without pedestrian
Speed-density v= 34.92−0.293 * k 0.769
Flow-speed q= v (34.92−v) /0.293 0.110
Flow-density q= k (34.92−0.293 * k) 0.252
5. Discussion
The mathematical relationships were developed between speed, density and flow in the present study. The theoretical vehicular speed was found as 30 kmph at pedestrian crossing locations and 40 kmph at restricted pedestrian crossing location (See in Table 2, if the density (k) equal to zero for all the vehicles case). From the field survey, it is also observed that there is a reduction in speed (7.7 kmph) at pedestrian crossing
auto further reduction in roadway width results in an increase in interaction between vehicles and pedestrian. It leads to further reduction in vehicular speed as well as other characteristics (flow etc.). The theoretical capacities were observed as 3676 vehicles/ hour and 2486 vehicles/hour without pedestrian crossing and with pedestrian crossings respectively. The fundamental diagrams of vehicular characteristics (all vehicles) with and without pedestrian crossings are shown in the Fig. 2. It shows that there is a clear drop of the average vehicle speed, increasing density and reduced in vehicular flow with pedestrian crossing.
5.1. Variation in Vehicle Flow
Characteristics with Type of Vehicle
Considering Effect of Pedestrian
Crossings
The effects of pedestrian crossing on indiv idual vehicles were studied by considering the variation of individual vehicle flow characteristics. From the field survey, it is observed that vehicles such as car, two wheeler and auto rickshaw (three wheeler) were more compared to heavy vehicles (bus and trucks) at the selected site. So, the individual variation was carried for only car, two wheeler and auto rickshaw. From this study, the individual
Fig. 3.
Traffic Flow Fundamental Diagrams with and without Pedestrian Crossing for Car: (a) Speed and Density Relationship, (b) Speed and Flow Relationship, (c) Flow and Density Relationship
Fig. 4.
The variation of auto rickshaw characteristics with and without pedestrian crossings is shown in Fig. 5. The average speed of auto rickshaw was observed as 34.92 kmph when the pedestrian crossing restricted and 27.47 kmph with pedestrian crossing (theoretical speed which indicates that k = 0 for auto rickshaw (three wheeler) from the Table 2). There is a significant change in auto rickshaw speed with effect of pedestrian crossing. From these results, it inference that car and auto rickshaw has significantly changed their vehicular speed while yielding to pedestrians who are already in crosswalk location under mixed traffic conditions. In case of two wheelers, there is possibility of change in their vehicular paths to yield to pedestrians when
they are in crosswalk location. However, the overall flow characteristics of car and auto rickshaw were changed drastically when compared to the two wheelers. Some research studies were carried to study the effect of pedestrian crossings on vehicular flow by converting all the vehicles into single passenger car unit (PCU) value (Chandra et al., 2014). But, in this study, the analysis was carried with individual vehicles in order to quantify the effect of pedestrian crossing on each individual vehicle. Furthermore, there is an increase in pedestrian cross flow leading to further reductions in vehicle speeds, because the pedestrian platoon has higher chance to cross the road when compared to individual pedestrians.
Fig. 5.
Early research studies show that the effect of reduction carriageway width by bus stops on urban capacity (Ashalatha et al., 2013). In this study, it is found that there is significant effect of parked vehicle or improper bus stop locations on vehicular flow characteristics. Perhaps, the improper bus stop locations leads to pedestrian cross the road at any point of mid-block locations and further the non-complaint behavior of pedestrian increase with increase in irregularity of stopping vehicles for passenger boarding and alighting (this is not only for the public transportation like bus, it is also true with Para-transportation system such as auto rickshaw in countries like India). Further, these vehicles (auto rickshaw) more flexibility in stops at any point of location also leads to cross the pedestrian at different point of mid-block with or without crosswalks. The present study highlights the change in vehicular speeds with respect to pedestrian crossings and it found that there is significantly reduction in vehicle speed.
6. Conclusions
The vehicular flow characteristics were studied at un-signalized mid-block pedestrian crossing and pedestrian restricted crossing in Guntur, India. The vehicular speeds were implicitly affected with pedestrian crossing when compared to without pedestrian crossing location under mixed traffic conditions. The theoretical capacity is significantly reduced with pedestrian crossings for car. However, increase in capacity is observed with pedestrian crossings in case of two-wheeler. The underlying fact is the variation of the speed of the car and two-wheeler. In case of
References
Ashalatha, R.; Salini, S.; Prakash, N. 2013. Capacity Reduction of Urban Roads Due to Bus Stops. In
Proceedings of the 92nd Transportation Research Board Annual meeting, Washington D.C., 1-10.
Bak, R.; Kiec, M. 2012. Influence of Various Types of Mid-Block Pedestrian Crossings on Urban Street Capacity. In Proceedings of the 91st Transportation Research Board Annual meeting, Washington D.C., 1-12.
Brumfield, R.M.; Pulugurtha, S.S.; Maradapudi, J.M.R.; Miatudila, A.S. 2013. Effect of Road User Distractions on Pedestrian Safety at Mid-block Crosswalks on a College Campus. In Proceedings of the 92nd Transportation Research Board Annual meeting, Washington D.C., 1-12.
Chandra, S.; Rao, G.S.; Dhamaniya, A.Z. 2014. Effect of Pedestrian Cross-Flow on Capacity of Urban Arterials,
Indian Highways, 51-58.
Dulaski, D.M.; Liu, Y. 2013. Stepping off the Curb to Increase Drivers’ Yielding Behavior at Mid-block Crosswalks. In Proceedings of the 92nd Transportation Research Board Annual meeting, Washington D.C., 1-13.
Duran, C.; Cheu, R.L. 2012. Effect of Crosswalk Location and PedestrianVolume on Entry Capacity of Roundabouts. In Proceedings of the 91st Transportation Research Board Annual meeting, Washington D.C., 1-20.
Farouki, O.T; Nixon, W.J. 1976. The Effect of Width of Sub-Urban Roads on the Mean Free Speeds of Cars,
Traffic Engineering Control, 17(12): 518-519.
Greenshields, B.D. 1935. A study of traffic capacity,
Highway Research Board Proceedings, 14: 448-477.
Hakkert, A.S; Gitelman, V.; Ben-Shabat, E. 2002. An evaluation of crosswalk warning systems: effects on pedestrian and vehicle behaviour, Transportation Research Part F: Traffic Psychology and Behaviour. DOI: http://dx.doi. org/10.1016/S1369-8478(02)00033-5, 5(4): 275-292.
Khatoon, M.; Tiwari, G.; Chatterjee, N. 2013. Modelling of pedestrian unsafe road crossing behavior: A comparison at a signalized and a non-signalized crosswalk. In Proceedings of the 92nd Transportation Research Board Annual meeting, Washington D.C., 1-12.
Lighthill, M.J.; Whitham, G.B. 1955. On kinematic waves: II. A theory of traffic flow on long crowded roads, Proceedings of the Royal Society. DOI: http://dx.doi. org/10.1098/rspa.1955.0089, 229(1178): 317-345.
Mohammadipour, A.H.; Archilla, A.R.; Papacostas, C.S.; Alavi, S.H. 2012. Raised Pedestrian Crosswalk (RPC) Influence on Speed Reduction. In Proceedings of the 91st Transportation Research Board Annual meeting,
Washington D.C., 1-20.
Ottomanelli, M.; Iannucci, G.; Sassanelli, D. 2012. A Simplified Pedestrians-Vehicles Interaction Model at Road Crossings Based on Discrete Events System. In
Proceedings of the 91st Transportation Research Board Annual meeting, Washington D.C., 1-12.
Persson, H. 1988. Communication between Pedestrian and Car Drivers. Unpublished report, Lund University, Lund, Sweden.
Raymond, P.D.; Knoblauch, R.L. 2000. The effect of crosswalk marking on vehicle speeds. In Proceedings of the 79th Transportation Research Board Annual meeting,
Washington D.C., Paper No. 00-1602.
Schroeder, B.; Rouphail, N.M.; Salamati, K.; Bugg, Z. 2012. Effect of Pedestrian Impedance on Vehicular Capacity at Multilane Roundabouts with Consideration of Crossing Treatments, Transportation Research Record. DOI: http://dx.doi.org/10.3141/2312-02, 2312: 14-24.
Shumin, F.; Yulong, P. 2007. Analysis of Vehicle Delay on Road Sections on the Condition of Pedestrian crossing,
Silva, A.B.; Cunha, J.; Relvão, T.; Silva, J.P. 2013. Evaluation of the effect of the pedestrian crossings on roundabout performance using microsimulation. In Proceedings of the 92nd Transportation Research Board Annual meeting, Washington D.C., 1-14.