Emperor International Journal of Finance and Management Research [EIJFMR] Page 124
HEDONIC PRICING APPROACH ON
POLLUTION AND LAND VALUES IN
SELECTED AREAS OF KARUR DISTRICT
IN TAMILNADU
T.MUTHUVIJAYAN
Ph.D., Research Scholar, Department of Economics,
Annamalai University, Annamalai Nagar.608002
Dr.R.ANNADURAI
Assistant Professor, Department of Economics,
Annamalai University, Annamalai Nagar-608002
Abstract
This paper mainly concentrates on the livelihood
affordable conditions of living in the polluted areas
and the people attribution against of pollution. To
support the study researcher has also studied and
analyzed the hedonic pricing method to assess the ten
years government guideline value and present market
value of the select type of land. The market value of
per square feet rate is normally higher than the
government guideline value of select type of land in
villages in Karur district and it is highly is decreased.
Many villages nearby the factory zones are priced
higher value and many remote villages are priced too
low. Hence, there is no pollution impact on the price
of the land value. Therefore, researcher has studied
the impact of pollution and price of the land. The
demand level of the market price and supply of
government guideline value are taken to the hedonic
pricing method (HPM) and it is based on assumption.
Keyword: Environmental quality, Hedonic pricing approach, Livelihood, Surrogate markets.
I. INTRODUCTION
The World Commission on Environment and Development (WCED) recognized 20 years ago that the environment, economic and social issues are interlinked. It recommended that the three be integrated into development decision making. In
defining sustainable development, the Commission acknowledged the need for both intra- and intergenerational equity - development that meets not only today‟s human needs but also those of more people in the future. Two million tons of wastes per day are discharged to receiving waters human waste industrial wastes and chemicals agricultural wastes an approximate estimate of global wastewater production is about 1,500 km3 per day. A large populace still does not have access to safe water.
Environmental Issues in India
Emperor International Journal of Finance and Management Research [EIJFMR] Page 125 The major sources of pollution in India include
the rapid burning of fuel wood and biomass such as dried waste from livestock as the primary source of energy, lack of organized garbage and waste removal services, lack of sewage treatment operations, lack of flood control and monsoon water drainage system, diversion of consumer waste into rivers, cremation practices near major rivers, government mandated protection of highly polluting old public transport, and continued operation by Indian government of government owned, high emission plants built between 1950 and 1980.
II. REVIEW OF LITERATURE
The following literatures are used to find the research problems, gaps, and objectives of the present study. It could exhibits the environmental pollution such as air, water, land respectively. Venkatachalam. L (2000), study on “Economic Valuation of Water Used in the Household Sector: a Contingent Valuation Approach in a Developing Country Context”, which was conducted in a suburban town of Coimbatore city which is a major industrial centre in South India. The study addressed three issues viz. (a) scope effect (b) information effect and (c) strategic bias. In the case of scope effect, the study cocludede two levels of quantity of water to two independent sample households and the expected households who received higher quantity to be willing to pay more than those households who received the lower quantity of water. In case of information effect, two different scenarios that differed only in the level of information about the quality of the Pillur water were administered to the sample households. Regarding the strategic bias, the households were already familiar with the proposed advance payment and monthly tariff. Therefore, the study concluded the households to behave strategically by way of understanding their actual WTP value.
Ratna Reddy V and Bhagirath Bchera (2005) their study on “Impact of water pollution on rural communities: An economic analysis”. The study observed to assess the economic costs of water pollution, (industrial) in the rural communities in terms of losses to agricultural production, human health, and livestock. The costs estimates are based on the household level from two study villages – one a pollution–affected and another control (not affected by pollution) both located in one of the industrial belts in Andhra Pradesh, South India. The costs estimates revealed that the impact of industrial pollution on rural communities is quite substantial in monetary system. The study argued that the compensation principal might work if the estimates of damage are realistic.
Emperor International Journal of Finance and Management Research [EIJFMR] Page 126
Importance of the Study
Now-a-days the environmental pollution is one of the significant problems in the global area. It affects the total economic loss as well as creates social disaster. The natural gain may depletion due to environmental pollution. The demand for natural resources and increasing every day but the supply is fixed. Thus it creates imbalances between demand and supply of natural resources. The main reason for this situation is lead by pollution. Thus, we should address the economic aspects of environmental pollution.
Theoretical Background
In the present study, theory of externalities could be incorporated to assess the positive externalities as well as on the negative externalities. While assessing the negative impact of environmental pollution on livelihood it is important to assess the damages caused by pollutants on households.
Research Gap
From the above research article, news, reports, unpublished theses and reviews of previous studies researcher has revealed the review of literatures coin the statement of the problem of the present study in the aspect of impact of environmental pollution. The research gap is identified as realization of livelihood towards pollution; impact of pollution towards health hazard; cost of pollution faced by the households; economic impact wealth and assets; and adaptation strategies of the local community. The study has been fulfill through apply Hedonic pricing approach on pollution and land values in selected areas of Karur district in Tamilnadu, India.
Statement of the Problem
From the above discussion researcher has understood the impact of environmental pollution affected by the local community and Land values in selected areas of Karur district Tamilnadu, India is too high by means of population growth and
environmental quality, water pollution, air pollution, solid waste pollution, noise pollution, and land or soil pollution. Therefore, pollution is an unavoidable hazard to the living thing is understood. The human beings are supposed to be tackling all the affordable environmental issues by their virtue of knowhow. In this regard researcher has collected many research article, news, reports, unpublished theses and reviews of previous studies to reveal the statement of the problem prevailed in the aspect of impact of environmental pollution.
III. OBJECTIVE OF THE STUDY
The specific objectives of the study are as follows: 1. To examine the level of pollution and land
values in selected areas of Karur district in Tamilnadu.
2. To examine the economic impact of pollution on human health, Livelihoods, households wealth and assets in the study area.
3. To study the households coping mechanism and adaptation strategies against negative externalities.
Hypotheses
H0 : There is no pollution impact on the price of the land value.
H1 : There is pollution impact on the price of the land value.
Methodolgy
The methodology is an important component of research. In order to fulfill the objectives of the study, an appropriate methodology for conducting the study is inevitable. The methodology part consists of research design, data collection procedures, and statistical techniques used to analyses the data.
Secondary Data
Emperor International Journal of Finance and Management Research [EIJFMR] Page 127 website, and data from the published and unpublished
reports and records, etc.
Nature of the Study
The present study was based on non-experimental research method, which is descriptive in nature and comprises Hedonic Pricing Approach on Pollution and
Land Values in selected areas of Karur district in Tamilnadu is the present study area.
Period of the Study
The duration of the study period is ten years from 2007 to 2016. Researcher has made an assumption that the price of a land value is determined by the government and the market price of the land value is associated many reasons, i.e. properties possessing larger qualities command a higher price and those with bad qualities command lower price. This function is known as the Hedonic Price Function. This involves collecting information on the actual sale prices of individual properties and detailed characteristics of the land. It can describe a land value is usually described by the quality or characteristics of its location, structure, and environment. Despite, the researcher is used only the attributes regarding realization of respondent towards Water Pollution (a) Land Pollution (b), Air Pollution(c), cost of pollution faced by the households (d), impact of pollution towards health hazard (e), Responsiveness to protect the environment (f), and economic impact wealth and assets (g).
The analysis proceeds through two stages. In the first stage, regression techniques are employed to estimate the hedonic price function of the property. This function relates the selling prices of a large number of properties in the same realty market with the characteristics of the lands, including the availability of good quality ground water i.e. assume that the price of land is a function of its attributes P = f(a1. a2. a3. …ar; b1, b2. b3…br;c1, c2. c3…cr;d1, d2. d3… dr; e1, e2, e3 .. er;f1, f2, f3 .. fr; g1, g2, g3 ..
gr; ) where a1, a2, a3 are the realization of respondent towards water pollution variables of the land value; respectively. The functional form can be linear or non-linear. Using regression analysis it is possible to estimate the relationship between the level of any one land characteristic and the price of the property. Differentiating the hedonic price function with respect to any one of the characteristics yields the implicit price function for that characteristic. It is termed implicit price because it is revealed to understand indirectly through the market value. In the second stage, these implicit prices are regressed against the actual price given by the government guideline value. As is well know the relationship between prices of the land value is the demand curve. These demand curves trace how much the individuals are willing to pay for a land value.
Framework of Analysis
In the present study is used percentage and averages are applied based on requirement of the situation. Trend analysis used to find land values of selected revenue villages in Karur district. Hedonic Price Method used to find out the impact of environmental pollution on households wealth and assets, land values in different parts of the Karur district in Tamilnadu.
Applications of Hedonic Price Method
Emperor International Journal of Finance and Management Research [EIJFMR] Page 128 in numerous settings to estimate the value of different
attributes. Based on the literature review, the application of the method can be categorized under three heads: 1) wage-amenity studies 2) housing
prices; 3) valuation of health risks using differences in wages. The present study is followed with the housing prices method.
Regression analysis
Table No.1
Model Summary for impact of environmental pollution
Model R R Square Adjusted R Square Std. Error of the Estimate
1 .832a .692 .686 .33303
a. Predictors: (Constant), Variables of impact of environmental pollution Source: Primary Data
The adjusted R square of impact of environmental pollution variables are having 68.6 per cent constantly existed.
Table No.2
ANOVA for impact of environmental pollution
Model Sum of Squares df Mean Square F Sig.
1 Regression 99.072 8 12.384 111.656 .000b 2 Residual 44.032 397 .111
3 Total 143.103 405
a. Dependent Variable: Impact of environmental pollution
b. Predictors: (Constant), Variables of impact of environmental pollution Source: Primary Data
All the variables of impact of environmental pollution have significantly varied.
Table No.3
Coefficients for impact of environmental pollution
Model Unstandardized
Coefficients
Standardized Coefficients
t Sig.
B Std. Error Beta
1 (Constant) -1.458 .155 -9.386 .000
2 Water Pollution .145 .024 .174 6.130 .000
3 Land Pollution .143 .027 .149 5.295 .000
4 Air Pollution .189 .029 .183 6.492 .000
5 Cost .309 .025 .358 12.598 .000
6 Health hazard .248 .028 .250 8.950 .000
7 Responsiveness Environment .068 .028 .068 2.415 .016
8 Economic mpact wealth,Assets .162 .027 .166 5.916 .000
a. Dependent Variable: Impact of environmental pollution Source: Primary Data The outputs of the regression analysis is
show that „Cost against of pollutions‟ have a significant impact on environmental pollution. (β = .309; t value = 12.598) next to health hazard is very dangerous to the human being against of pollutions (β = .248; t value = 8.950). Hence, the government should concentrate on health and cost aspects protection to the people that are basic needs of every
human life. P=
(.145+.143+.189+.309+.248+.068+.162) P=1.264
Trend analysis of land values of selected revenue villages in Karur district
Emperor International Journal of Finance and Management Research [EIJFMR] Page 129 The logarithm values of ten years are taken for the
regression analysis to find out the beta value, t value and probability value at 0.01 percent significant level. The type land are segregated by the government is named as residential class I, II, III, IV, V, special type I, II, commercial class I, and II. The study is covered many revenue villages of the six taluks. Researcher consider above ten per cent growth rate is better growth for the present study.
Among the residential class I Kadambarkovil, Thoranakkalpatti, Vaiganallur North and Maruthur South pit-II are got better growth as per the study period. Residential class II is concerned Kadhapparai, Andankovil (Karur west), Lakshmi narayansomuthiram, Manmangalam and Kadambarkovil are got better growth. Residential class III is got better growth to Andankovil (Karur west), Manmangalam, Kadhapparai, Kulithalai, Inamkarur, Lakshmi narayansomuthiram, Karur ward II, Sanappiratti, and Kadambarkovil. Residential class IV is got better growth to Karur ward-II, Manathattai, and Kadhapparai. Residential class V is got better growth to Sanappiratti and Karur ward -2.Among the special type I Aravakurichi and Maruthur North pit-II are got better growth as per the study period. Special type II is concerned Kadhapparai only got better growth. Aravakurichi is only got better growth in Commercial class I and no better growth in commercial class II during the study period.
From the above analysis researcher infers that the growth of the land values are got 0.01 per cent significant level. The t values are ranges from 3.7 to 6.7. It denotes that the land values are got better appreciation in the realty market even the areas are highly polluted.
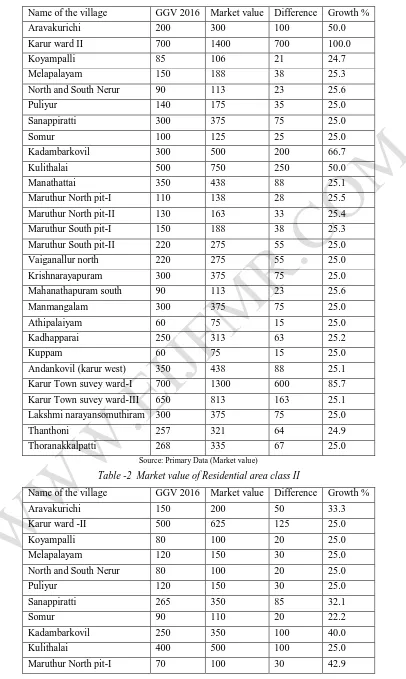
Market rate of the Karur district land values as on 2016 represented by the respondents
Researcher has considered the better growth of the market rate is 50 per cent. Among the residential class I Karur ward II, Kadambarkovil, Kulithalai, Karur Town suvey ward-I are got better growth. In the residential class II Mahanathapuram south, Karur Town suvey ward-I, Karur Town suvey ward-III, Vaiganallur north are got better growth. In the residential class III Mahanathapuram south, Karur Town suvey ward-I, Thoranakkalpatti are got better growth. Kulithalai is only got better growth in residential class IV. In the residential class V Maruthur North pit-II and Krishnarayapuram are got better growth. In the special type I Aravakurichi and Manmangalam are got better growth. In the special type II Kulithalai and Kadhapparai are got better growth. In the commercial class I Karur ward -2, Sanappiratti, Kadambarkovil, Kulithalai, Manathattai, Vaiganllur north, and Karur Town suvey ward-I are got better growth. But in the commercial class II Karur ward -2 only got better growth. Therefore, the residential classes, special types and commercial classes Karur town and ward 2 is highly increased the market value due to the importance of town facilities. The other areas growth is considered as the sub-town and its importance like school, industrial estates and non-polluted areas.
Researcher has given the following tables for the references, the graphical representation of the values are given for the easy to understand the market values
Emperor International Journal of Finance and Management Research [EIJFMR] Page 130
Table-1 Market value of Residential area class I
Name of the village GGV 2016 Market value Difference Growth %
Aravakurichi 200 300 100 50.0
Karur ward II 700 1400 700 100.0
Koyampalli 85 106 21 24.7
Melapalayam 150 188 38 25.3
North and South Nerur 90 113 23 25.6
Puliyur 140 175 35 25.0
Sanappiratti 300 375 75 25.0
Somur 100 125 25 25.0
Kadambarkovil 300 500 200 66.7
Kulithalai 500 750 250 50.0
Manathattai 350 438 88 25.1
Maruthur North pit-I 110 138 28 25.5
Maruthur North pit-II 130 163 33 25.4
Maruthur South pit-I 150 188 38 25.3
Maruthur South pit-II 220 275 55 25.0
Vaiganallur north 220 275 55 25.0
Krishnarayapuram 300 375 75 25.0
Mahanathapuram south 90 113 23 25.6
Manmangalam 300 375 75 25.0
Athipalaiyam 60 75 15 25.0
Kadhapparai 250 313 63 25.2
Kuppam 60 75 15 25.0
Andankovil (karur west) 350 438 88 25.1
Karur Town suvey ward-I 700 1300 600 85.7
Karur Town suvey ward-III 650 813 163 25.1
Lakshmi narayansomuthiram 300 375 75 25.0
Thanthoni 257 321 64 24.9
Thoranakkalpatti 268 335 67 25.0
Source: Primary Data (Market value)
Table -2 Market value of Residential area class II
Name of the village GGV 2016 Market value Difference Growth %
Aravakurichi 150 200 50 33.3
Karur ward -II 500 625 125 25.0
Koyampalli 80 100 20 25.0
Melapalayam 120 150 30 25.0
North and South Nerur 80 100 20 25.0
Puliyur 120 150 30 25.0
Sanappiratti 265 350 85 32.1
Somur 90 110 20 22.2
Kadambarkovil 250 350 100 40.0
Kulithalai 400 500 100 25.0
Emperor International Journal of Finance and Management Research [EIJFMR] Page 131
Maruthur South pit-I 120 150 30 25.0
Maruthur South pit-II 70 100 30 42.9
Krishnarayapuram 250 350 100 40.0
Mahanathapuram south 66 100 34 51.5
Manmangalam 250 350 100 40.0
Athipalaiyam 50 75 25 50.0
Kadhapparai 200 250 50 25.0
Andankovil (karur west) 250 350 100 40.0
Inamkarur 204 255 51 25.0
Karur Town suvey ward-I 900 2100 1200 133.3
Karur Town suvey ward-III 500 750 250 50.0
Lakshmi narayansomuthiram 250 350 100 40.0
Thanthoni 102 150 48 47.1
Thoranakkalpatti 56 80 24 42.9
Vaiganallur north 400 600 200 50.0
Source: Primary Data(Market value)
Table-3 Market value of Residential area class III
Name of the village GGV 2016 Market value Difference Growth %
Aravakurichi 100 130 30 30.0
Karur, achamapuramjt-i 90 120 30 33.3
Karur ward II 300 390 90 30.0
Balampalpuram 360 500 140 38.9
North and South Nerur 70 90 20 28.6
Puliyur 100 130 30 30.0
Sanappiratti 225 300 75 33.3
Kadambarkovil 200 260 60 30.0
Kulithalai 300 390 90 30.0
Maruthur North pit-II 80 110 30 37.5
Maruthur South pit-I 100 130 30 30.0
Maruthur South pit-II 60 80 20 33.3
Krishnarayapuram 235 350 115 48.9
Mahanathapuram south 50 75 25 50.0
Manmangalam 200 260 60 30.0
Kadhapparai 160 210 50 31.3
Andankovil (karur west) 200 260 60 30.0
Inamkarur 100 130 30 30.0
Karur Town suvey ward-I 850 2000 1150 135.3
Karur Town suvey ward-III 439 600 161 36.7
Lakshmi narayansomuthiram 232 320 88 37.9
Thanthoni 77 100 23.1 30.0
Thoranakkalpatti 40 75 35 87.5
Emperor International Journal of Finance and Management Research [EIJFMR] Page 132
Table No.4 Market value of Residential area class IV
Name of the village GGV 2016 Market value Difference Growth %
Aravakurichi 55 75 20 36.4
Karur ward-II 290 350 60 20.7
Kulithalai 750 1450 700 93.3
Manathattai 250 300 50 20.0
Maruthur South pit-1 110 150 40 36.4
Vaiganllur north 500 600 100 20.0
Kadhapparai 180 250 70 38.9
Source: Primary Data(Market value) Table No.5 Market value of Residential area class V
Name of the village GGV 2016 Market value Difference Growth %
Karur ward -2 270 350 80 29.6
Puliyur 90 110 20 22.2
Sanappiratti 160 200 40 25.0
Maruthur North pit-II 50 75 25 50.0
Maruthur South pit-I 55 75 20 36.4
Krishnarayapuram 50 75 25 50.0
Source: Primary Data(Market value)
Table No.6 Market value of Special Type I
Name of the village GGV 2016 Market value Difference Growth %
Aravakurichi 225 350 125 55.6
Maruthur North pit-II 150 200 50 33.3
Manmangalam 400 650 250 62.5
Athipalaiyam 80 100 20 25.0
Kadhapparai 350 500 150 42.9
Source: Primary Data(Market value)
Table No.9 Market value of Commercial Type II
Name of the village GGV 2016 Market value Difference Growth %
Karur ward -2 1100 1800 700 63.6
Sanappiratti 350 420 70 20.0
Kadambarkovil 325 390 65 20.0
Kulithalai 600 720 120 20.0
Manathattai 375 450 75 20.0
Vaiganllur north 450 540 90 20.0
Source: Primary Data (Market value)
Emperor International Journal of Finance and Management Research [EIJFMR] Page 133
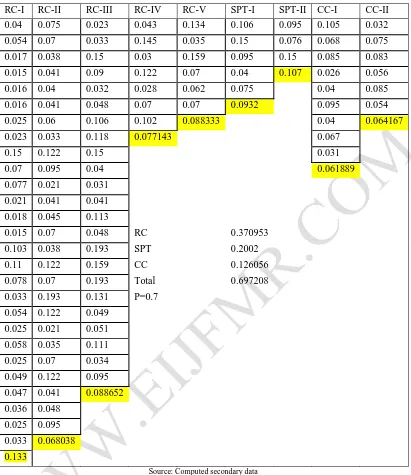
Table No 10 Regression unstandardized beta value of individual respective villages
RC-I RC-II RC-III RC-IV RC-V SPT-I SPT-II CC-I CC-II
0.04 0.075 0.023 0.043 0.134 0.106 0.095 0.105 0.032
0.054 0.07 0.033 0.145 0.035 0.15 0.076 0.068 0.075
0.017 0.038 0.15 0.03 0.159 0.095 0.15 0.085 0.083
0.015 0.041 0.09 0.122 0.07 0.04 0.107 0.026 0.056
0.016 0.04 0.032 0.028 0.062 0.075 0.04 0.085
0.016 0.041 0.048 0.07 0.07 0.0932 0.095 0.054
0.025 0.06 0.106 0.102 0.088333 0.04 0.064167
0.023 0.033 0.118 0.077143 0.067
0.15 0.122 0.15 0.031
0.07 0.095 0.04 0.061889
0.077 0.021 0.031 0.021 0.041 0.041 0.018 0.045 0.113
0.015 0.07 0.048 RC 0.370953
0.103 0.038 0.193 SPT 0.2002
0.11 0.122 0.159 CC 0.126056
0.078 0.07 0.193 Total 0.697208
0.033 0.193 0.131 P=0.7 0.054 0.122 0.049
0.025 0.021 0.051 0.058 0.035 0.111 0.025 0.07 0.034 0.049 0.122 0.095 0.047 0.041 0.088652 0.036 0.048
0.025 0.095 0.033 0.068038 0.133
Source: Computed secondary data
IV. CONCLUSION
From the above discussion researcher has concluded that as per the trend analysis of the GGV is represented the growth to Kadambarkovil, Kadhapparai and Andankovil. But in the case of market rate Karur town and ward 2 are gat better growth. Therefore, market rate is highly increased due to the district headquarters and other facilities. No other areas are got better growth when compared to the Karur town and ward 2. Hence, the impact of pollution is not considered in the
Emperor International Journal of Finance and Management Research [EIJFMR] Page 134 consider the causes of pollutions and that can be
reduces by creating awareness.
V. REFERENCE
1) Ridker, R.G., 1967, “Economic Costs of Air Pollution: Studies and Measurement”. Praeger, NewYork.
2) Ridker, Ronald G., and John A Henning (1967) “The Determinants of Residential Property Values with Special Reference to Air Pollution”. The Review of Economics and Statistics 49:2, 246-57.
3) Haripriya, Gundimeda and Vinish Kathuria, (2004), Can Markets value Water scarcity and Quality: an analysis using Hedonic approach, Project report submitted to the South Asian Network for economic institutions, August 2004.