LOGISTICS CHARACTERISTICS OF GOODS AND
CONTAINERIZATION LEVEL
Marinko Maslarić1, Svetlana Nikoličić2, Sanja Bojić3, Borna Debelić4, Siniša Vilke5
1,2,3 University of Novi Sad, Faculty of Technical Sciences, Serbia 4,5 University of Rijeka, Faculty of Maritime Studies, Croatia
Received 15 March 2019; accepted 15 April 2019
Abstract: The phenomenon of containerization is a well-researched theme. However, these
researches are mainly in the context of new technical and technological issues and challenges, necessary for the realization of such a transport technology, as well as the dynamics of containerization and contemporary business models. The investigation of cargo being carried by containers appears to be underrepresented, which can be a result of thinking that container represents the transport unit (box) that replaces a large number of smaller packages so it is primarily intended for general cargo. Containers could be used for the transport of a large number of different types of goods, and types of packages, whether the level of containerization of particular goods depends on several factors. This paper aims at analyzing these factors in containerized level. It also looks at developing a special diagram showing the compatibility between the particular freight and container types. This paper will demonstrate how this diagram could be used in a simple way in finding which types of container are suitable for specific types of commodity.
Keywords: commodity, freight density, containerization, diagram.
1 Corresponding author: marinko@uns.ac.rs
1. Introduction
The containerization was the major change in 20th century transportation technology which has a decisive impact on the world economy. That is, there is a significant correlation between the enormous increase in the world trade and commodity flows, on the one hand, and the development of container transport on the other hand. Therefore it could be said that containerization was a catalyst for the development of the world trade and economy in general. Similar statements could be found in a vast literature on transportation economics, such as Bernhofen et al. (2016), which emphasized the containerization
sometimes a dozen direct handling of goods, the containers enabled a direct technological connection between the producers and customers, while reducing the total transportation costs (Bernhofen et al., 2016). On the other side, containerization required major technological changes in transportation and handling activities and facilities. These changes started in maritime transportation first (a new form of ships, ports, and handling equipment) and progressed to engulf inland parts of the transportation chains, like rail and road transportation. Container shipping developed rapidly due to the adoption of standard container sizes in the mid-1960s and the awareness of industry stakeholders about the advantages and cost savings (Rodrigue and Notteboom, 2014). All these technological and economic aspects of the phenomenon of containerization are well-researched in literature. However, the investigation of cargo being carried by containers appears to be underrepresented, as Rodrigue and Notteboom (2014) have already stated. This could be a result of a perception of the container as a transport unit (box) that replaces a large number of smaller packages, which makes him primarily intended for conventional general cargo. However, such perception of the container must be expanded to consider the container as a transport unit that could be used for a large number of different types of goods, and types of packages, whether the level of containerization of particular goods depends on their logistics and market characteristics. This paper aims at analyzing the level of containerization regard extraction of the new market opportunities. It also looks at developing a special diagram showing the compatibility between the particular freight and container
types. This paper will demonstrate how this diagram could be used in a simple way in finding which types of container are suitable for specific types of commodity.
2. Containerization
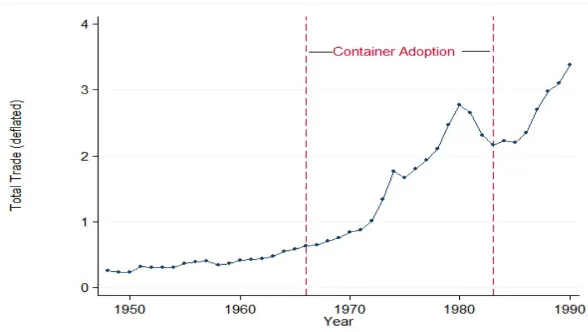
Fig. 1.
The Growth of World Trade: 1948-1990 Source: Bernhofen et al., 2016
2.1. Waves of Containerization
According to Guerrero and Rodrigue (2014), there are five waves of containerization (each of them lasts about 8-10 years), from container port traffic point of view, where each wave is represented by specific temporal growth pattern of containerization. The first wave of containerization was started in the late 1950s by shipping 58 Malcolm McLean’s 35-foot containers (actually aluminum truck bodies) and last till mid-1970s and re-opening of the Suez Canal. During this first phase, container’s dimension was standardized by International Organization for Standardization (ISO) in the forms of 10, 20, 30 and 40-foot length, with a width of 8 foot and a height of 8.5 foot. Two dominant types of containers are 20 and 40 footers (ft), where standard ISO 20ft shipping containers with dimensions 6.06m (length) x 2.44m (width) x 2.6m (height) has a capacity of 33.1m3, while ISO 40ft containers with 12.12m length have twice the capacity of 20ft containers. ISO 20ft container can each
load around 22 to 26 tons while an ISO 40ft container, because of structural integrity issues, has a loading capacity of about 27 do 30 tons. Hence, 40 footers have only 15% more load capacity even the shipping volume is doubled in comparison to 20 footers. Cost effects of the five year’s adoption of such standardized sizes of containers (from 1965 till 1971) are provided by Bernhofen et al. (2016). According to them productivity of dock labor had increased from 1.7 tons per hour (in pre-container era-1965) to 30 tons per hours (in 1971), while insurance costs have decreased from 0.24£ per ton to 0.04£ per ton, as well as capital locked up as inventory in transit from 2£ per ton to 1£ per ton.
ports). This phase was characterized by global diffusion of containerization achieved mainly by entering the containers into the break bulk trades. This containerization’s phase was with greater speed and size in comparison to the first wave, but still being costly to operate in some broad sense. The third wave concerns the largest number of ports and captures the massive diffusion of containerization (Guerrero and Rodrigue, 2014). During that period (the mid-1980s till mid-1990s), containerization had become a routine for not only manufacturers but also distributors and retailers. Technological advancements inf luenced the types of container carrying ships: container/ bulk carriers, container/ro-ro, and fully cellular containerships (Nurosidah, 2017). Containerization in this phase assumed improving ship’s productivity (less time-consuming container handling) and reducing of total transportation costs. According to Guerrero and Rodrigue (2014) this wave is statistically the most distinctive and assumes an acceleration of containerization, probably because of full internationalization in world trade which has stepped into the scene based on the entry of China and other countries from the Far East in the global sphere of production (Notteboom and Rodrigue, 2009).
In the fourth wave, from the mid-1990s till mid-2000s, the container became the standard mean for global freight distribution (Guerrero and Rodrigue, 2014) changing the economic geography (the massive entry of Chinese ports in global distribution networks), as well as changing delivery handling from labor-intensive to a capital and time-intensive operation (Nurosidah, 2017). The fifth wave concerns a massive phase of globalization and the usage of containerization to support the wide range
of commodity chains. The last phase of containerization results in a significant increase in the volume of goods transported in this form. The containerization growth trend is still constant, except the world economic crisis in 2008-2009, so that no one can define for sure the final stage of containerization diffusion or its maturity. As Notteboom and Rodrigue (2009) stated the future containerization will be largely determined by interactions within and between four inter-related layers: locational, infrastructural, transport and logistical, where the last one represents the most fundamental. The mix of logistics factors related to containerized goods will determine the future development of the global container transport system (Notteboom and Rodrigue, 2009). One of those factors is logistics characteristics of goods which will have an impact on decision regards identifying and setting of niche markets in future containerization.
2.2. Level of Containerization
goods mainly depends on their market characteristics (value-weight ratio) and logistics characteristics (based on size and frequency of shipments, density, packaging, and perishability). According to Yang et al. (2016), containerization is traditionally mainly applied for high-value manufactured commodities, such as electronic device, furniture, toys, apparel, sports equipment, works of art, etc. An example of a high-value commodity where 95% of their imports into Europe are containerized is coffee (Rodrigue and Notteboom, 2014). The top containerized commodities imported to the US in 2004 are from the groups: “machinery, boilers, reactors, parts”; “electric machinery, sound and television equipment, parts”; and “vehicle and parts”, with total value of imported goods of 38; 31.7; and 12.1 billion of USD respectively (www.evisionfreight. com). As Karamperidis (2013) has stated, some rough calculation of the average value of contents of the global seaborne container equals 42,000 USD per TEU (Twenty-foot Equivalent Unit). Taking into account the fact that container could be shipped, for example from the Far East to Europe for 1,000 USD it means that the average freight rate equates to 2.38 percent of the value of the container contents. On the other side, the majority of low-volume products like grain, iron ore, coal, and other raw materials are basically transported via bulk shipment. However, many of those segments are in the process of being containerized. In accordance with the previously stated facts, it could be said that containerization is commodity-dependent, which results in a wide variety of existing and potential containerization levels, as it’s already noted by Rodrigue (2017). The same author further stated that even within the same groups of a commodity (defined by Standard
International Trade Classification-SITC which is a classification of the commodities being subject to international trade by United Nations Statistics Division), levels of containerization differ (Figure 2).
in commodity prices and growing demand in new markets; fluctuations and rises in bulk shipping rates; relatively stable and even declining container shipping costs.
In regards to studying given by Rodrigue and Notteboom (2014), commodities such
as grain, chemicals, wood products, as well as temperature-sensitive products, such as food, represent a niche for containerization. In chapter three, some challenges in further containerization of stated commodities based on their logistics characteristics will be discussed in more detail.
Fig. 2.
Commodity Group and Containerization Level Source: adapted from (Rodrigue, 2017)
2.3. Level of Containerization: a Case
of Serbia
Based on the available data, provided by the Customs Administration of the Republic of Serbia, Table 1 shows which category of goods
Table 1
Serbian Containerized Imports: 2015-2017 Commodity
category of import
2015 2016 2017
Number of containers
% of total containerized
imports
Number of containers
% of total containerized
imports
Number of containers
% of total containerized
imports
Category 0+1 933 2,29 795 1,74 815 1,58
Category 2 3004 7,39 3082 6,75 4154 8,05
Category 4 645 1,59 543 1,18 571 1,12
Category 5 4695 11,56 5300 11,58 9115 17,67
Category 6 23464 57,76 26436 57,77 25350 49,15
Category 7 3795 9,34 4870 10,64 6925 13,43
Category 8 4091 10,07 4733 10,34 5160 10,00
Total 40627 100 45759 100 51576 100
Source: Customs Administration of the Republic of Serbia
First, they don’t make difference between type of containers (20 and 40 footers), they just collect data in form of “containers”. Therefore, it is not possible to indicate the import of containerized goods in TEU, it could be just assumed. Second, their classification of goods is somewhat different from the classification defined by SITC, which is used in reviewed papers, so appropriate assumptions regards to this issue is also made, in order to apply SITC classification in this analysis (for example category 0 and category 1 are merged into one group). Taking into account the stated assumptions, it could be said that the top three containerized commodity groups imported to the Serbia in 2015 were: group 6 “manufactured goods”; group 5 “chemicals”; and group 8 “miscellaneous manufactures”, with the percentage of total containerized imports of 57,7%; 11,5%; and 10% respectively. The similar situation was in 2016 where commodities from the groups 6 and 5 were again top two, with almost identical share of total containerized imports like in 2015, but with the difference in third-placed groups: commodities from the group
7 “machinery and transport equipment” with share of 10,6% of total containerized imports in 2016. The situation in 2017 was identical to 2016 regards list of top three containerized commodity groups, with the slightly difference in terms of percentage of total containerized imports (shown in Table 1).
It should be underlined the fact that the import of commodities from the category 3 “fuel and lubricants” were not containerized at all, as well as the fact that the commodity “textiles” from the group 6 was with the highest level of containerized import (about 50% of total containerized import), which is completely in line with the statements from Rodrigue (2017), as it is already shown in Figure 2.
3. The Logistic Characteristics of Goods
as a Challenge
means that containers must be available in sufficient quantities and be of a suitable load unit. What kind of containers is suitable as a load unit for different commodities, such as grain, for example, could be defined according to the diagram presented in Figure 3. The issue of containers suitability is connected to the weight of container loads (loading capacity or payload) as another major issue. The container weight is directly connected to the nature of goods which is carried by. Weight of 10 to 14 tons per loaded 20-foot container is the most common situation (Rodrigue and Notteboom, 2014). The freight nature is mainly represented by density (expressed in tons per cubic meter). At the very beginning of containerization, the 20 footers were the most used. However, due to situation that container loads are much lighter for the commodities with a higher level of containerization (such as retail commodities from the groups food, beverage, and tobacco, etc.), the shipping industry has adapted to this and switched to larger container sizes (40 footers) because of their better suitability for goods with smaller density. The following diagram at Figure 3 put in the ratio container loading capacity and specific container density (expressed by the ratio of container loading capacity and volume), and it allows determination of the possible useful capacity of containers when caring goods with different density. Each container depending on its loading capacity and specific density corresponds to a certain broken line consisting of the line which passes through the beginning of the coordination system and the horizontal part corresponds to the nominal loading capacity of the container. The commodities which have a density higher than specific container density will enable their full weight utilization.
Figure 3 shows diagrams for four cargo types of containers‡: 20 ft (payload: 21630kg, volume capacity: 33.2m3, specific density: 0.65t/m3); 20 ft (payload: 2600kg, volume capacity: 33.2m3, specific density: 0.78t/ m3); 40 ft (payload: 26480kg, volume capacity: 67.74m3, specific density: 0.39t/ m3); and 40 ft high cube (payload: 26500kg, volume capacity: 76.3m3, specific density: 0.34t/m3), in order to determine their suitability for different commodity groups defined by their estimated average density. As it is shown at Figure 3, the density of each commodity group is estimated on the basis representative goods for each group. For the commodity category 0, the representative good is assumed to be grains with an average density of 0.74 t/m3 (Rodrigue, 2012). The average freight density for other commodity groups are assumed as follows: category 1 (tobacco stems) - 0.24 t/m3; category 2 (lumber) - 0.72 t/m3; category 3 (coal) - 1.13 t/m3; category 4 (vegetable oil) - 0.97 t/m3; category 5 (fertilizers) - 0.96 t/m3; category 6 (textile-blue jeans) - 0.27 t/m3; category 7 (electronic components) - 0.33 t/m3; and category 8 (books) - 0.61 t/m3.
than 55%). Therefore, for the commodities which represent a future market potential for containerization expansion, such as grain, coal, lumber, fertilizers, the use of 20-foot containers are more structurally suited. Even the economies of scale are
pushing towards the largest container possible, as it implies lower total distribution costs (including both maritime and inland carriers), the containerization of such ponderous commodities will ensure that 20-foot containers still remain on the market.
Fig. 3.
Diagram of Loading Capacity and Specific Density Ratio for Different Type of Containers Applied for Different Commodity
Source: adapted from (Topenčarević, 1987)
4. Conclusion
Containerization plays a very important role in freight transport with a constant tendency of growth in the context of world trade. The
Containerization has forced even the most unavailable countries to import goods from foreign countries that can produce them at a much lower cost. It’s very difficult to imagine the future of international commodity exchange without container cargo. Containerization, as one of the biggest technology revolution which hit the shipping industry in the last century, will be replaced by some unknown technology in the future, but which technology we still need to discover. Bearing in the mind the simplicity of the containerization system and standards that apply it internationally, it will probably never be fully replaced by new shipping and delivery system, but rather improved in the context of application information technology solutions. The new phase of containerization expansion in the context of both attracting of new commodity and raising the containerization level of existing ones, assuming the extraction of niche market opportunities, which will be followed by a number of challenges. The fundamental factor in the emerging containerization will be the nature of the commodities represented through their logistics and market characteristics.
Acknowledgements
The realization of this paper has been supported by the Serbian Ministry of Education, Science and Technological Development program through projects TR 36030 and TR 36007, as well as through project DTP1-050-3.1: “Regional and Transport Development in the Danube-Black Sea Region towards the Transnational M u lt i p or t G a t e w a y R e g ion (DB S Gateway Region)” supported by Danube Transnational Programme.
References
Bernhofen, D.M.; El-Sahli, Z.; Kneller, R. 2016. Estimating the effects of the container revolution on international trade, Journal of International Economics
98(1): 36-50.
Bhattbhatt, H.B.; Verma, A. 2012. National conference on container infrastructure in India 2012-Background Paper. Delloite and IBK Media, February 2012. Available from internet: <http://www.deloitte.com/in>.
Clott, C.B.; Hartman, B.; Ogard, E.; Gatto, A. 2015. Container repositioning and agricultural commodities: shipping soybeans by container from US hinterland to overseas markets, Research in Transportation and Business
Management 14: 56-65.
Envision Freight. 2011. The transportation of imported containerized goods. Transportation Research Board (TRB) of the National Academies. Available from internet: <http://www.envisionfreight.com>.
Guerrero, D.; Rodrigue, J.P. 2014. The waves of containerization: shifts in global maritime transportation, Journal of Transport Geography 34: 151-164.
Levinson, M. 2006. Container shipping and the economy: stimulating trade and transformations worldwide, Transportation Research Board of the National
Academies (online) 246: 10-12.
Liu, X.; Bai, Y.; Chen, J. 2017. An intermodal transportation geospatial network modeling for containerized soybean shipping, Journal of Ocean
Engineering and Science 2: 143-153.
Karamperidis, S. 2013. Development of an index for maritime
container transport costs, connectivity and risks for the UK.
Notteboom, T.; Rodrigue, J.P. 2009. The future of containerization: perspectives from maritime and inland freight distribution, GeoJournal 74: 7-22.
Nurosidah, S. 2017. The shift of containerization influence: 50-year logistics innovation in international business, The Business and Management Review 8 (4): 93-98.
Rodrigue, J.P. 2012. The containerization of commodities: integrating inland ports with gateways and corridors in Western
Canada. The Van Horne Institute, Hofstra University,
New York, USA.
Rodrigue, J.P.; Notteboom, T. 2014. Looking inside the box: evidence from the containerization of commodities and the cold chain, Maritime Policy & Management 42(3): 207-227.
Rodrigue, J.P. 2017. The geography of transport systems
(fourth edition). Routledge, New York, USA. 440 p.
Topenčarević, Lj. 1987. Organizacija i tehnologija
drumskog transporta [In English:Road transport organization
and technology]. IRO Gradjevinska knjiga, Belgrade,
Yugoslavia. 423 p.
UNCTAD. 2018. Review of Maritime Transport 2018. United Nations publication. Sales No. E.18.II.D.5, New York and Geneva.
Yang, D.; Weng, J.; Hu, J. 2016. Coal containerization: will it be an alternative mode of transport between north and south China in the future? Maritime Business