Iran J Public Health, Vol. 45, No.9, Sep 2016, pp.1199-1207
Original Article
Changes in Back Compressive Force When Measuring
Maxi-mum Acceptable Weight of Lift in Iranian Male Students
Ali SALEHI SAHL ABADI
1, *Gebraeil NASL SARAJI
1, Adel MAZLOUMI
1, Hojjat
ZE-RAATI
2, Mohammad Reza HADIAN
3, Amir Homayoun JAFARI
41. Dept. of Occupational Health, School of Public Health, Tehran University of Medical Sciences, Tehran, Iran 2. Dept. of Biostatistics, School of Public Health, Tehran University of Medical Sciences, Tehran, Iran
3. Dept. of Postgraduate Studies, Faculty of Rehabilitation, Tehran University of Medical Sciences, International Campus (TUMS-IC), Te-hran, Iran
4. Medical Physics and Biomedical Engineering Department, School of Medicine, Tehran University of Medical Sciences, Tehran, Iran
*Corresponding Author: Email: [email protected]
(Received 08 Feb 2016; accepted 14 Jun 2016)
Introduction
There are several harmful factors at work envi-ronment that causes fatigue, burnout, and early exhaustion of individuals, and lead to the waste of time and money. Some of the occupational factors are responsible for the incidence of mus-culoskeletal problems. Manual Material Handling (MMH) tasks are one of the common occupa-tional factors (1). In most industries, and even in non-occupational settings, manual handling and
lifting of weights happens very frequently; each of these tasks have their own specific require-ments, and such tasks are one of the important reasons for the incidence of low back pain (2). Low back pain and other musculoskeletal disord-ers caused by work, ranked the second after car-diovascular diseases, are among the most impor-tant and common diseases and cause of patients’ referral to the physicians in Iran (3). Moreover,
Abstract
Background: Low back pain caused by work, ranked the second after cardiovascular diseases, are among the most common reasons of patients’ referral to the physicians in Iran. This study aimed to determine the changes in back compressive force when measuring maximum acceptable weight of lift in Iranian male students.
Methods: This experimental study was conducted in 2015 on 15 young male students were recruited from Tehran University of Medical Science. Each participant performed 18 different lifting tasks involving three lifting frequencies, with three lifting heights, and two box sizes. Each set of experiments was conducted during the 20 min work period using free-style lifting technique. The back compressive force evaluated with hand-calculation back compressive force method. Finally, Pearson correlation test, analysis of variance (ANOVA) and t-test were used for data analysis.
Results: The mean of back compressive force (BCF) for the small and large boxes at a frequency of 1lift/min at heights of F - K height, were 1001.02 (±86.74), 1210.57 (±93.77) Ib, respectively. There was a significant difference between mean BCF in terms of frequencies of lifts (P=0.02). The result revealed significant difference between fre-quencies of 1 lift/min and 6.67 lift/min (P=0.01). There was a significant difference between mean BCF in terms of the sizes of the two boxes (P=0.001). There was a significant relationship between the BCF and maximum acceptable weight of lift in all test conditions (P=0.001).
Conclusion: BCF is affected by box size, lifting frequency and weight of load.
85% of the population would suffer from back pain at some points in their life time. On the oth-er hand, 25% of days off from the work are due to back pain (4).
In recent years, low back pain related to the job or career has become a major concern. In many studies conducted so far on different jobs and employees (such as posts staff, doctors, soldiers, construction workers and other groups) the pre-valence of low back pain has been reported from 15% to 84% (5). Low back pain can reduce the functional performance and lead to absenteeism around the world and it imposes a huge econom-ic burden on the individual, family, community, industry, and government. Until 10 years ago it was thought that the problem is limited to West-ern countries, however, since then the increased number of researches has found that low back pain is also a big problem in low and middle in-come countries as well (6). Low back pain can be caused by mechanical, ergonomic, personal, and social factors. Among the ergonomic and me-chanical factors, we can note the followings: lack of adequate rest between the work shifts, doing work with hurry and top speed, improper body postures, high frequency and repetitive move-ments, and lifting or moving heavy objects. In addition, obesity, gender, age and other factors can be also introduced as the causes of low back pain (7). Based on the mentioned facts, back inju-ries associated with MMH tasks have been a rigid problem for both the person and the national economy. There are several different main types of the MMH tasks, such as lifting, holding, carry-ing, pushcarry-ing, and pulling. Nearly 50% of back injuries occur when lifting objects, whereas only 9% occur when holding, throwing, or carrying objects. Therefore, as the most common MMH task associated with the prevalence of low back injuries is lifting tasks (8).
During lifting and bending forward, the trunk is placed in front of the lumbar spine and it leads to shear and compressive forces to be imposed on the disk. On the other hand, each person's toler-ance of the load on the spine depends on differ-ent factors such as body posture, gender, age, the weight of the imposed load, and the individual
differ-ent lifting techniques (16). NIOSH work practic-es guide for Manual Lifting indicated, biome-chanical BCF on the L5/S1 disc in most workers are not tolerable over 650 kg (1430 lb) and a 350 kg (770 Ib) BCF can be tolerated by most young, healthy workers. These criteria from cadaver spine failure and cross-sectional epidemiologic studies of job loads associated with back injuries were established (17).
This study was aimed to determining the changes in back compressive force when measuring max-imum acceptable weight of lift in Iranian male students.
Materials and Methods
Participants
This experimental study was conducted in 2015. Fifteen young male students (20-30 yr old) were recruited from the total population of students at Tehran University. The sample size was
consis-tent with those of previous studies (18-21). The mean (SD) demographic data of the subjects were as follows: age 22.2 (±2.1) yr, body weight 67.5 (±7.4) kg and height 177.7 (±5.3) cm. We were looking at after that examined to ensure they had no considerable cardiovascular and musculoskeletal problems and no previous histo-ry of significant regarding lower back pain. They participated in training sessions and familiarized using the experimental processes before collect-ing your experimental data. The reason for select-ing students as the subjects was the availability in terms of schedule flexibility and experimental duration. Prior to commencing the study, smok-ing habits, alcohol and carbonated liquids con-sumption, eating habits, physical activity, and normal sleep duration of students were consi-dered. All participants signed a consent form be-fore the test, and they were paid to them. The summary of data on the subjects' age, height, and weight are presented in Table 1.
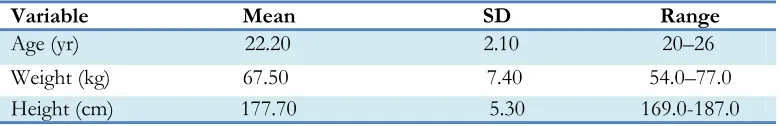
Table 1:Demographic description of the subjects (n=15)
Variable Mean SD Range
Age (yr) 22.20 2.10 20–26 Weight (kg) 67.50 7.40 54.0–77.0 Height (cm) 177.70 5.30 169.0-187.0
Equipment
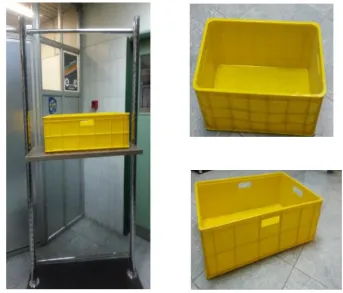
A height adjustable set up, shown in Fig. 1, simi-lar to the device used by Snook, was used to si-mulate the 18 different lifting conditions consi-dered in this study. The stopwatch was used to measure the time and instructing the subjects. Digital accurate scale was used for weighing body weight and determined maximum weight of lift-ing. Two plastic boxes with external handles (4.2 cm thick and 17.8 cm long) were used. Each box represents a special industrial tote box. The small box has the width, length, and depth of 33.4 cm, 56.2 cm, and 16.0 cm, respectively. The large box has the width, length, and depth of 76.1 cm, 56.5 cm, and 22.0 cm, respectively. The width of the box represents the horizontal distance between
hands and the central axis of the body. The length of the box represents the distance between two handles. Box dimensions and handles were the same as those used in the Snook and Ciriello MMH lifting tables (22). These boxes were rec-tangular (Fig. 1).
Experimental design
Fig. 1:Height-adjustable shelves and boxes for handling lifts
These Three variables are the important descrip-tors of manual lifting tasks. Three levels of lifting frequency (1 lift/min, 4.3 lift/min, 6.67 lift/min) were applied. Three different lifting heights (floor to knuckle (F-K), knuckle to shoulder (K-S), and shoulder to arm reach (S-A) were fixed. Two dif-ferent box sizes were used (small and large). The levels of these three variables (frequency of lift /height of lift /box size), thus, provided 18 com-binations of similar basic manual lifting tasks. The participants were randomly performed the
task of lifting for all 18 combinations tasks. Each subject determined the maximum acceptable weight of lift and randomly, started with either a very light or a heavy weight (According to 10% ile and 90% ile male as per the Snook Tables and were allowed to adjust it to arrive at the maxi-mum acceptable weight of lift (26). The adjust-ment took approximately 20 min. The room temperature was kept in the range of 22-24 °C
and the relative humidity was 45–55%.
Table 2:MMH task Parameters at Different Levels
No Symbol Factors Level Units
Level-1 Level-2 Level-3
1 A Freq. of lift 1 4.3 6.67 lifts/min
2 B Box size Small Large - cm3
3 C Height of lift Floor to
Study procedure
The psychophysical methodology (18, 22, 23) was used in this experiment. The maximum amount of weight or force could handle for 8 h without symptoms of fatigue or muscle weakness were determined by subjects. The students wore the normal clothes and flat-soled sport shoes. Prior to commencing the experiments, the participants rested for 10 min in prone lying position. The procedure of experiments and the purpose of the research were explained to the students. Before the start of each series of tests, subjects per-formed 5 min of light warm-up exercises. Follow-ing this, the box-handlFollow-ing tasks were done in the specific experimental conditions. Next, the par-ticipant performed one of the eighteen possible experimental conditions (three lifting frequencies, three lifting heights, and two box sizes). Each person participating in the test was asked to lift-ing the box uslift-ing a free-style posture. To the control the frequency of lifting a periodic sound that was broadcast by the mobile phone was used. Once the participants heard the sound, they lifted the box and then waited for the next sound. The Participants were allowed to added or sub-tracted inside the weight from the box between the lift trials. During the lifting, the subjects changed the weight of boxes by adding and sub-tracting the sand bags. Subjects were aware of the sand bags but never knew their weights. The weights of bags were randomly varied. During 20 min, the weight of the boxes was set in accor-dance with procedures. The Final weight at the
end of each course as it was intended as the max-imum acceptable weight (MAWL) for that partic-ular frequency. The condition of the experiments was run twice for each subject (one replication). For a given lifting task condition, if the partici-pant’s MAWL for the second adjustment was within 15% of the first adjustment, the average of the two adjustments was considered as the final MAWL for that lifting condition. Otherwise, the results were discarded and the relevant data were collected at the next time.
The back compressive force evaluated with HCBCF method.
Results
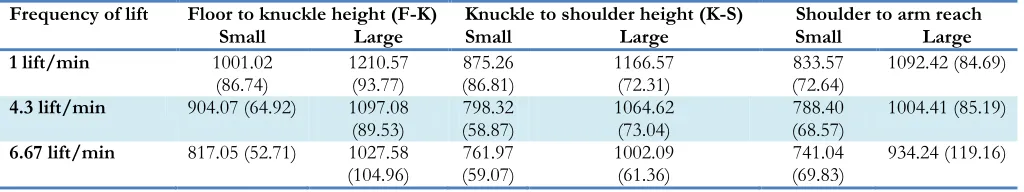
The mean and standard deviation of BCF for the small box at a frequency of one lift/min at differ-ent heights of F - K height, K - S height and S-A height, were 1001.02 (± 86.74), 875.26 (± 86.81), and 833.57 (± 72.64) Ib. The obtained values for the same box at frequencies of 4.3 and 6.67 lift/min at the mentioned heights are presented in Table 2. In addition, the mean and standard deviation of the BCF for the large box at a fre-quency of one lift/min at different heights of F - K height, K - S height and S-A height, were 1210.57 (± 93.77), 1166.57 (± 72.31), and 1092.42 (± 84.69) Ib . The obtained values for the same box at frequencies of 4.3 and 6.67 lift/min at the mentioned heights are presented in Table 3.
Table 3:Mean of back compressive force (Ib) for lifting various boxes at different heights and frequencies
Frequency of lift Floor to knuckle height (F-K) Knuckle to shoulder height (K-S) Shoulder to arm reach
Small Large Small Large Small Large
1 lift/min 1001.02
(86.74) 1210.57 (93.77) (86.81) 875.26 1166.57 (72.31) (72.64) 833.57 1092.42 (84.69)
4.3 lift/min 904.07 (64.92) 1097.08
(89.53) (58.87) 798.32 1064.62 (73.04) (68.57) 788.40 1004.41 (85.19)
6.67 lift/min 817.05 (52.71) 1027.58
(104.96) (59.07) 761.97 1002.09 (61.36) (69.83) 741.04 934.24 (119.16)
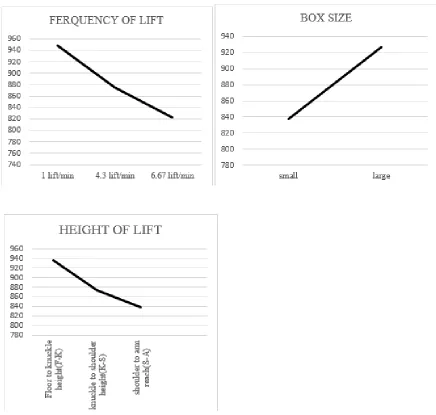
The results of the ANOVA showed that there was a significant difference between mean BCF in terms of frequencies of lifts (P=0.02). Turkey's
however, there was a statistically significant dif-ference between the frequencies of 1 lift/min and 6.67 lift/min (P=0.01). There was no significant difference between the frequencies of 4.3 lift/min and 6.67 lift/min (P>0.05). As the fre-quency increased from 1 lift/min to 4.3 lift/min, the mean BCF declined by nearly 8.00%, from approximately 948.65 Ib to 875.74 Ib. A further decline of 6.20% from 875.74 Ib to 822.16 Ib was observed when the lifting frequency in-creased to 6.67 lift/min.
The results of ANOVA showed that there was no significant difference between mean BCF in terms of lifting heights (P>0.05). The results of t-test showed that there was a significant difference between mean BCF in terms of the sizes of the two boxes (P=0.001). When the box size in-creased from the small size to the large one, the mean BCF increased by approximately 10% from 837.47 Ib to 926.98 Ib.
The main effect of various lifting parameters for back compressive force is shown in Fig. 2.
The results of Pearson correlation test showed that there was a significant relationship between the BCF and maximum acceptable weight of lift in all test conditions (P=0.001). Thus, with an increase in the maximum acceptable weight of lift, BCF also increased.
The mean BCF had no significant difference in terms of the combined variables of lifting fre-quency, lifting height, and the size of the box (P>0.05), except for the simultaneous effects of frequency of lifts and height of lifts (P=0.02).
Discussion
This study applied a HCBCF method to deter-mine BCF .The purpose of this study was to es-timate changes BCF when subjects determined maximum acceptable weight of lifts during a 20 min lifting of the loads. Lifting studies alterna-tively focus on L5/SI moments rather than L5/SI compressive forces. Chen, to estimate the peak BCF at level of the L5/S1 disc and reported that for the subjects with an average mass of 67 kg, a mean value of 3300±370 N was generated when lifting a 5-kg load, a mean value of 4490±520 N while lifting a 15-kg load, and a
mean value of 5050±500 N while lifting a 20-kg load.
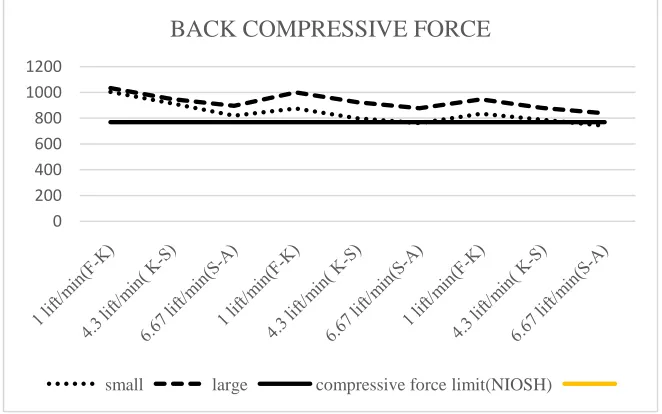
The mean of the BCF at L5/SI ranged from 3272 to 5877 N and average subject's mass of 67.5 kg, which is comparable as observed in Chen study (24). In this study, subjects significantly increased peak BCF at L5/S1 disc when they had to lift the heavy loads. This result supports previous studies (24, 25), where lifting the heavy loads led to sig-nificantly increase peak BCF at L5/S1 disc. Bu-dihardjo et al. in a study conducted to assess the effects of magnitude and knowledge of loads on the L5/S1 compressive force during lifting the loads, showed that during lifting of light load whereas subject no knowledge of weight the load, subjects overestimated the load, and significantly the peak BCF at L5/S1 increased. Knowledge of the mass did not significantly change the peak BCF while lifting a heavy load (25). In addition, the results of this study were compared with the safety limit of BCF proposed by the NIOSH or-ganization. The results showed that in all cases of lifting the big box the mean rate of BCF was higher than the safety limit. With reference to the small box, at a frequency of 6.67 lift/min at the heights of the K-S height and the S-A height mean rate BCF was lower than the safety limit while in other cases it was higher (Fig. 3).
Fig. 3:compare mean of the back compressive force for all experimental conditions (small and large boxes) and for the compressive force limit (NIOSH
0 200 400 600 800 1000 1200
BACK COMPRESSIVE FORCE
In a study, the force on the back (back compres-sive force) was more than the admissible rate. However, as the result of correction of the angle of load lift, the estimated biomechanical force was set back in the permissible range (26). Com-pressive and shear forces exerted on the disc L5/S1, respectively, in 17.5% and 10.8% of the studied workers were higher than permissible rate (27).
This study was only conduced on students aged 20 to 30 yr, as they were easily available, there-fore, it is recommended to conduct similar stu-dies on workers with a wider age range, so that to achieve more accurate standards for the BCF and to reduce the risks of handling weights.
Conclusion
There was a significant difference between mean BCF in terms of frequencies of lifts and size of the boxes, but the difference was not significant in terms of lifting height. With increasing the maximum acceptable weight of lift, BCF also in-creased significantly. Besides, in 100% of cases of lifting the large box, BCF was larger than the safety limit while it 77.87% of cases it was true for the small box. BCF is affected by box size, lifting frequency and weight of load.
Ethical considerations
Ethical issues (Including plagiarism, informed consent, misconduct, data fabrication and/or fal-sification, double publication and/or submission, redundancy, etc.) have been completely observed by the authors.
Acknowledgments
This paper was extracted from a doctoral thesis on Occupational Health conducted in Tehran University of Medical Sciences. Hereby, we would like to thank Tehran University of Medical Sciences for their scientific helps and financial supports. The authors declare that there is no conflict of interest.
References
1. Gnaidy AM, Waly SM, Khalil TM, Hidalgo J (1993). Spinal compression tolerance lim-its for the design of manual material han-dling operations in the workplace. Ergo-nomics, 36(4):415-34.
2. Industrial Accident Prevention Association (2008). A Health and Safety Guideline for Your Workplace for manual material handling, Toll-free: 1-800-406-IAPA (4272). Available from: www.iapa.ca 3. Ghaffari M, Alipour A, Farshad AA, Yensen
I, Vingard E(2006). Incidence and recur-rence of disabling low back pain and neck-shoulder pain. Spine, 31(21):2500-6. 4. Abdoli-Eramaki M, Stevenson JM, Reid SA,
Bryant TJ (2007). Mathematical and em-pirical proof of principle for an on-body personal lift augmentation device. J Bio-mech, 40(8): 1694-1700.
5. Li JY, Wang S, He LH, Wu SS, Yang L, Yu SF, et al (2012). Risk Factors of Low Back Pain among the Chinese Occupa-tional Population: A Case-control Study.
Biomed Environ Sci, 25(4):421-9.
6. Hoy D, Brooks P, Blyth F, Buchbinder R (2010). The epidemiology of low back pain. Best Pract Res Clin Rheumatol, 24(6):769-81.
7. Mehrparvar AH, Ranjbar S, Mostaghaci M, Salehi M (2011). Risk assessment of mus-culoskeletal disorders by QEC method in a food production factory. J Occup Med, 3(2):54-60.
8. Klein BP, Jensen RC, Sanderson LM (1984). Assessment of workers' compensation claims for back sprain/strains. J Occup Med, 26(6): 443-448.
10. Bush-Joseph C, Schipplein O, Andersson GB, Andriacchi TP (1988). Influence of dynamic factors on the lumbar spine moment in lifting. Ergonomics, 31 (2): 211-216.
11. Buseck M, Schipplein OD, Andersson GB, Andriacchi TP (1988). Influence of dy-namic factors and external loads on the moment at the lumbar spine in lifting.
Spine, 13 (8): 918-921.
12. Gracovetsky S (1990). Musculoskeletal Function of the Spine. In: Multiple Muscle Systems. Ed, winters J M, Woo S L. Springer-Verlag, New York, PP. 410-437.
13. Marras WS (2005). The future of research in understanding and controlling work-related low back disorders. Ergonomics, 48(5): 464-77.
14. Bloswick DS and Villnave T (2000). Ergo-nomics. In: Patty's Industrial Hygiene. Ed, Harris RL. New York, John Wiley and Sons, PP .2531-2638.
15. Elfeituri FE, Taboun SM (2002). An Evalua-tion of the NIOSH Lifting EquaEvalua-tion: A Psychophysical and Biomechanical Inves-tigation. Int J Occup Saf Ergon, 8(2): 243-258.
16. Leskinen TP (1985). Comparison of static and dynamic biomechanical models. Er-gonomics, 28 (1):285-291.
17. Gary S. Nelson, Henry Wickes, Jason T (1981). NIOSH Work Practices Guide
for Manual Lifting. N.
http://www.hazardcontrol.com/factshee ts/pdfs/NIOSH-1981.pdf.
18. Ciriello VM, Snook SH (1983). A study of size distance height, and frequency effects on manual handling tasks. Hum Factors, 25 (5): 473-83.
19. Ciriello VM, Snook SH, Hashemi L, Cot-nam J (1999). Distributions of manual materials handling task parameters. Int J Ind Ergon, 24(4): 379-88.
20. Karwowski W and Yates JW (1986). Relia-bility of the Psychophysical Approach to Manual Lifting of Licjuids by Females.
Ergonomics, 29(2): 237-248.
21. Snook SH, Vaillancourt DR, Ciriello VM, Webster BS (1995). Psychophysical stu-dies of repetitive wrist fexion and exten-sion. Ergonomics, 38(7): 1488-507.
22. Snook SH, Ciriello VM (1991). The design of manual tasks: revised tables of maxi-mum acceptable weights and forces. Er-gonomics, 34(9): 1197-213.
23. Ciriello VM, Snook SH, Hughes GJ (1993). Further studies of psychophysically de-termined maximum acceptable weights and forces. Hum Factors, 35 (1): 175-186. 24. Chen YL (2000). Changes in lifting dynamics
after localized arm fatigue. Int J Ind Ergon, 25: 611-619.
25. Iwan Budihardjo. Studies of compressive forces on L5/S1 during dynamic manual lifting [PhD thesis]. School of Industrial Engineering, Iowa State University, Unit-ed States; 2002.
26. Panjali Z, Mazloumi A, Ahsani H, Rezaee E (2014). Evaluation of the risks factors for manual material handling in a metal cast-ing industry in Iran. Iran Occupational Health, 11(1):13-22.