Establishment and application of molecular ID
in the main inbred lines of Chinese cabbage
X.X. Zhang1*, X.B. Tang1*, Y. Liu1 and Y.W. Zhang1,2
1College of Horticulture, Northeast Agricultural University, Harbin,
Heilongjiang, China
2Key Laboratory of Biology and Genetic Improvement of Horticultural Crops
(Northeast Region), Ministry of Agriculture, Harbin, Heilongjiang, China *These authors contributed equally to this study.
Corresponding author: Y.W. Zhang E-mail: [email protected] Genet. Mol. Res. 16 (1): gmr16019144 Received September 2, 2016
Accepted December 12, 2016 Published March 8, 2017
DOI http://dx.doi.org/10.4238/gmr16019144
Copyright © 2017 The Authors. This is an open-access article distributed under the terms of the Creative Commons Attribution ShareAlike (CC BY-SA) 4.0 License.
largely consistent with previous classification based on morphology data. Moreover, the molecular ID of an F1 hybrid can be deduced from its parents molecular IDs, and its purity can be determined by selecting one or two SSR loci from the 36 different loci.
Key words: Brassica rapa; Inbred line; SSR; Molecular ID; Fingerprint
INTRODUCTION
Chinese cabbage (Brassica rapa L. ssp pekinensis) is an important cruciferous vegetable. Numerous varieties of Chinese cabbage are available in the Chinese market. However, many of them are highly similar, and good varieties are not much. Therefore, an accurate identification of the varieties of this vegetable is important for establishing a reference for the breeding of new varieties as well as for protecting the germplasm resources and rights of the breeders. Three main identification methods are applicable today: morphologic, biochemical marker, and DNA molecular marker identification (Mei and Lu, 2005). Morphologic identification involves the use of agronomic characters as standards, and thus, is time consuming and costly. Moreover, its accuracy is easily influenced by numerous factors, such as the environment, seasons, and experiences of evaluators, thereby preventing this method from meeting the required speed in variety renovation. The biochemical marker identification method essentially exhibits the same characteristics and drawbacks. However, DNA molecular marker identification is a fast and accurate method, which has been widely applied in the establishment of fingerprint databases, identification of germplasm resources, assessment of genetic distances of inbred lines, and identification of purity. As a type of molecular markers, the simple sequence repeat (SSR) markers have been frequently used to establish the fingerprint databases and identify the purity of Zea mays L. (Zhou and Chen, 2005), Oryza sativa L. (Dai et al., 2011), Gossypium hirsutum (Xue et al., 2010), Brassica oleracea var. capitata (Chen et al., 2011), Musa spp. (Wang et al., 2009), Cucumis melo L. (Wang et al., 2010), Nicotiana tabacum L. (Xu et al., 2011), Brassica rapa var. chinensis (Shen et al., 2016), Cucumis sativus (Hu et al., 2011), and Citrus limon (Lei et al., 2009). This is because of their simple operation, high polymorphism, codominance, good repeatability and stability, and abundance with random distribution in genomes (Zhou, 2005).
To date, many SSR molecular markers have been developed and analyzed in Chinese cabbage, but they are not evenly distributed on the 10 chromosomes of Chinese cabbage (Yu et al., 2003; Yang et al., 2013; Zhang et al., 2013; Kawamura et al., 2015). The present study aims to use 36 SSR markers that are evenly distributed on the 10 chromosomes of Chinese cabbage to screen its 20 highly inbred lines, and establish an inbred line ID. Through the codominant factor of SSR markers, we could identify the purity of hybrids and validate the accuracy and reliability of our results in combination with morphologic identification. Thus, we provided an accurate and effective method to identify the purity and authenticity of hybrids.
MATERIAL AND METHODS
Plant materials
University were used to establish the molecular ID database. The F1 hybrid resulting from the cross between A204-1-1 and A8-1 was used to validate the accuracy and reliability of the molecular ID, whereas two hybrid combinations (A204-1-1 × A8-1 and A204-1-1 × A66-2-1) were used to identify the purity of hybrids. Seeds were obtained after mixed pollination.
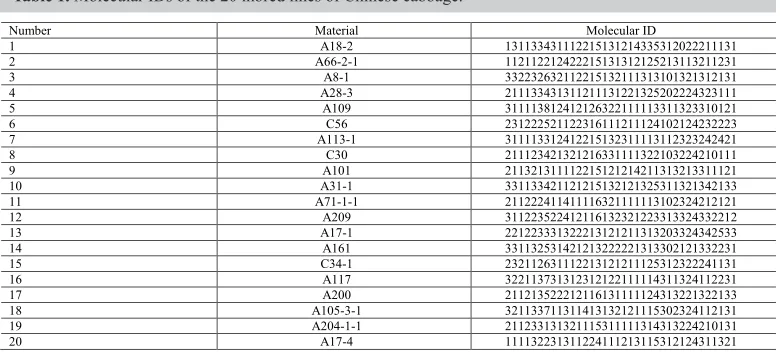
Table 1. Molecular IDs of the 20 inbred lines of Chinese cabbage.
Number Material Molecular ID
1 A18-2 131133431112215131214335312022211131 2 A66-2-1 112112212422215131312125213113211231 3 A8-1 332232632112215132111313101321312131 4 A28-3 211133431311211131221325202224323111 5 A109 311113812412126322111113311323310121 6 C56 231222521122316111211124102124232223 7 A113-1 311113312412215132311113112323242421 8 C30 211123421321216331111322103224210111 9 A101 211321311112215121214211313213311121 10 A31-1 331133421121215132121325311321342133 11 A71-1-1 211222411411116321111113102324212121 12 A209 311223522412116132321223313324332212 13 A17-1 221223331322213121211313203324342533 14 A161 331132531421213222221313302121332231 15 C34-1 232112631112213121211125312322241131 16 A117 322113731312312122111114311324112231 17 A200 211213522212116131111124313221322133 18 A105-3-1 321133711311413132121115302324112131 19 A204-1-1 211233131321115311111314313224210131 20 A17-4 111132231311224111213115312124311321
The seeds were planted in 8 x 8 cm pots, which contained nutrient-rich soil and were placed in an illuminated incubator. The young leaves, whose lengths were less than 1.5 cm, were harvested during the 3-4-leaf stage, recorded, and frozen in liquid nitrogen for DNA isolation.
Genomic DNA extraction
The genomic DNA was extracted from the stored young leaves using the NuClean PlantGen DNA Kit (Beijing ComWin Biotech Co., Ltd., Beijing, China), and then analyzed via 0.6% agarose gel electrophoresis.
SSR primer screening
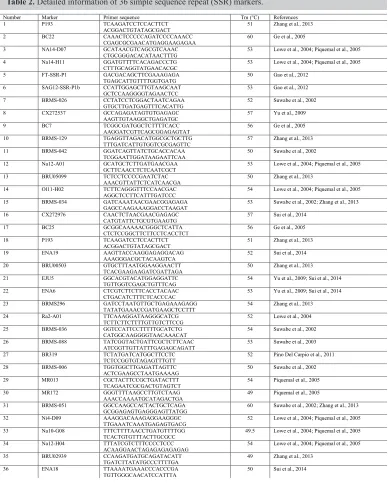
We selected 130 already published primers for screening the core primers. Thirty-six core primers were identified; these primers should have more than two polymorphic bands for establishing the molecular ID of inbred line (Table 2) (Suwabe et al., 2002, 2003; Lowe et al., 2004; Ge et al., 2005; Piquemal et al., 2005; Yu et al., 2009; Pino Del Carpio et al., 2011; Gao et al., 2012; Zhang et al., 2013; Sui et al., 2014). The primers were synthesized by Boshi Biological Technology Co., Ltd. in Harbin, China.
SSR amplification
2 µL primer pairs, and 2 µL template DNA (approximately 50 ng/µL). The amplification was performed as follows: initial denaturation at 94°C for 5 min, followed by 35 cycles of denaturation at 94°C for 30 s, annealing at proper temperature for 1 min, and extension at 72°C for 1 min, followed by a final extension at 72°C for 10 min.
Table 2. Detailed information of 36 simple sequence repeat (SSR) markers.
Number Marker Primer sequence Tm (°C) References
1 P193 TCAAGATCCTCCACTTCT
ACGGACTGTATAGCGACT 51 Zhang et al., 2013
2 BC22 CAAACTCCCCCAGATCCCCAAACC
CGAGCGCGAACATGAGGAAGAGAA 60 Ge et al., 2005
3 NA14-D07 GCATAACGTCAGCGTCAAAC
CTGCGGGACACATAACTTTG 53 Lowe et al., 2004; Piquemal et al., 2005
4 Na14-H11 GGATGTTTTCACAGACCCTG
CTTTGCAGGTATGAACACGC 53 Lowe et al., 2004; Piquemal et al., 2005
5 FT-SSR-P1 GACGACAGCTTCGAAAGAGA
TGAGCATTGTTTTGGTGATG 50 Gao et al., 2012
6 SAG12-SSR-P1b CCATTGGAGCTTGTAAGCAAT
GCTCCAAGGGGTAGAACTCC 53 Gao et al., 2012
7 BRMS-026 CCTATCCTCGGACTAATCAGAA
GTGCTTGATGAGTTTCACATTG 52 Suwabe et al., 2002
8 CX272537 GCCAGAGATAGTGTGAGAGC
AAGTTGTAAGGCTGAGATGC 57 Yu et al., 2009
9 BC7 TCGGCGATGGCTCTTTTCACC
AAGGATCGTTCAGCGGAGAGTAT 56 Ge et al., 2005
10 BRMS-129 TGAGGTTAGACATGGCGCTGCTTG
TTTGATCATTGTGGTCGCGAGTTC 57 Zhang et al., 2013
11 BRMS-042 GGATCAGTTATCTGCACCACAA
TCGGAATTGGATAAGAATTCAA 50 Suwabe et al., 2002
12 Na12-A01 GCATGCTCTTGATGAACGAA
GCTTCAACCTCTCAATCGCT 53 Lowe et al., 2004; Piquemal et al., 2005
13 BRU05099 TCTCCTCCCCGAATCTAC
AAACGTTATTCTCATCAACGA 50 Zhang et al., 2013
14 Ol11-H02 TCTTCAGGGTTTCCAACGAC
AGGCTCCTTCATTTGATCCC 54 Lowe et al., 2004; Piquemal et al., 2005
15 BRMS-034 GATCAAATAACGAACGGAGAGA
GAGCCAAGAAAGGACCTAAGAT 53 Suwabe et al., 2002; Zhang et al., 2013
16 CX272976 CAACTCTAACGAACGAGAGC
CATGTATTCTGCGTGAAGTG 57 Sui et al., 2014
17 BC25 GCGGCAAAAACGGGCTCATTA
CTCTCCGGCTTCTTCCTCACCTCT 56 Ge et al., 2005
18 P193 TCAAGATCCTCCACTTCT
ACGGACTGTATAGCGACT 51 Zhang et al., 2013
19 ENA19 AAGTTACCAAGGAGAGGACAG
AAAGGGACGCTACAAGTCA 52 Sui et al., 2014
20 BRU00503 GTGCTTTAATGGAAGGAACTT
TCACGAAGAAGATCGATTAGA 50 Zhang et al., 2013
21 EJU5 GGCACGTACATGGAGGATTC
TGTTGGTCGAGCTGTTTCAG 54 Yu et al., 2009; Sui et al., 2014
22 ENA6 CTCGTCTTCTTCACCTACAAC
CTGACATCTTTCTCACCCAC 53 Yu et al., 2009; Sui et al., 2014
23 BRMS296 GATCCTAATGTTGCTGAGAAAGAGG
TATATGAAACCGATGAAGCTCCTTT 54 Zhang et al., 2013
24 Ra2-A01 TTCAAAGGATAAGGGCATCG
TCTTCTTCTTTTGTTGTCTTCCG 52 Lowe et al., 2004
25 BRMS-036 GGTCCATTCCTTTTTGCATCTG
CATGGCAAGGGGTAACAAACAT 54 Suwabe et al., 2002
26 BRMS-088 TATCGGTACTGATTCGCTCTTCAAC
ATCGGTTGTTATTTGAGAGCAGATT 53 Suwabe et al., 2003
27 BR319 TCTATGATCATGGCTTCCTC
TCTCCGGTGTAGAGTTTGTT 52 Pino Del Carpio et al., 2011
28 BRMS-006 TGGTGGCTTGAGATTAGTTC
ACTCGAAGCCTAATGAAAAG 50 Suwabe et al., 2002
29 MR013 CGCTACTTCCGCTGATACTTT
TCAGAATCGCGACTGTAGTCT 54 Piquemal et al., 2005
30 MR172 GGGTTTTAAGCCTTGTCTAAG
AAACCAAAATGCATAGACTGA 49 Piquemal et al., 2005
31 BRMS-051 GGCCAAGCCACTACTGCTCAGA
GCGGAGAGTGAGGGAGTTATGG 60 Suwabe et al., 2002; Zhang et al., 2013
32 Ni4-D09 AAAGGACAAAGAGGAAGGGC
TTGAAATCAAATGAGAGTGACG 52 Lowe et al., 2004; Piquemal et al., 2005
33 Na10-G08 TTTCTTTTAACCTGATGTTTTGG
TCACTGTGTTTACTTGCGCC 49.5 Lowe et al., 2004; Piquemal et al., 2005
34 Na12-H04 TTTATCGTCTTTCCCCTCCC
ACAAGGAACTAGAGAGAGAGAG 54 Lowe et al., 2004; Piquemal et al., 2005
35 BRU02939 CCAAGATGATGCAGATACATT
TGATCTTATATGCCCTTTTGA 49 Zhang et al., 2013
36 ENA18 TTAAAATGAAACCCACCCGA
Electrophoresis analysis
PCR products were analyzed via 8% non-denaturing polyacrylamide gel electrophoresis at 35 V/cm for 3 h, using 1X TBE (Tris-Borate-EDTA) buffer. Subsequently, the polyacrylamide gels were silver stained for 15 min according to the method of Bassam et al. (1991). The banding pattern was also recorded.
Data analysis
Each polymorphic band was observed as an allele. When a band was present on a certain position of the polyacrylamide gel, it was marked as “1”; otherwise, it was marked as “0”. After marking all bands, the data were analyzed using the numerical taxonomy and multivariate analysis system (NTSYS-pc) version 2.10 software (Song et al., 2012). The sequential, agglomerative, hierarchic, and non-overlapping methods, as well as the unweighted pair-group method with arithmetic average (UPGMA) program, were used to perform cluster analysis. The genetic relationship of the inbred lines was subsequently obtained.
Digitization of polymorphic bands and establishment of molecular ID
The establishment of a molecular ID was based on the differences in polymorphic bands (Lu et al., 2014). Each band was digitized to a specific number. On the basis of the 36 differential polymorphic bands, a molecular ID comprising 36 numbers for each inbred line was established.
Deduction and identification of the molecular ID of F1 hybrid
The molecular ID of the hybrid combination A204-1-1 x A8-1 was deduced according to the polymorphism of 36 SSR sites present in the inbred lines A204-1-1 and A8-1. Theoretically, the molecular ID of their F1 hybrid is composed of 72 numbers. Subsequently, the DNA of the F1 generation was extracted to perform an electrophoresis using 36 primers. The bands were recorded and compared with the theoretical bands.
Purity identification of F1 hybrid
One hundred hybrid seeds of the hybrid combinations A204-1-1 x A8-1 and A204-1-1 x A66-2-1 were selected randomly, and planted in nutrient-rich soil. DNA was extracted from the seedlings at a 3-4-leaf stage. A pair of specific primers was selected for PCR amplification, and then analyzed through electrophoresis. The bands were recorded and compared with the theoretical bands.
RESULTS
Screening and analysis of SSR primers
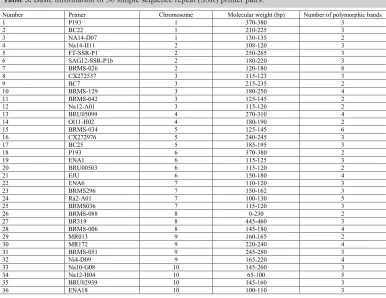
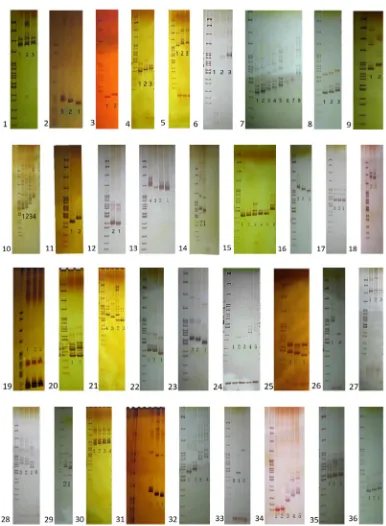
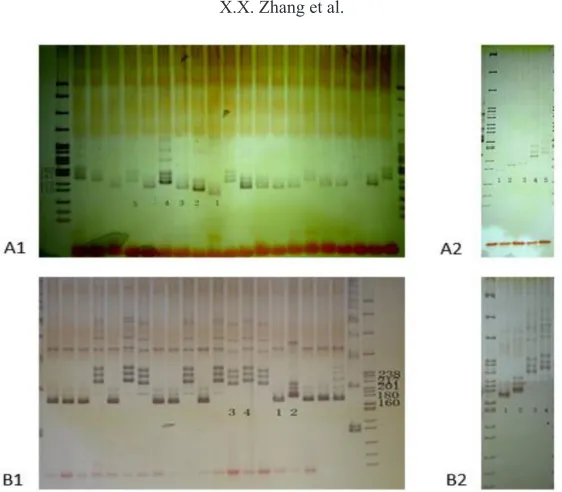
After repeated verification, 36 polymorphic bands were selected; these bands were stable and clearly polymorphic. They were evenly distributed on the 10 Chinese cabbage chromosomes, each of which contained three to five SSR sites (Figure 1). Each primer can produce two to eight polymorphic bands (Table 3 and Figure 2). For example, the primers BRMS-129 and Ni4-D09 produce four polymorphic bands (Figure 2a and b). These four polymorphic fragments were sorted according to the amplified fragment length in the ascending (from small to large) order, and subsequently marked as 1, 2, 3, and 4 (Figure 3) for establishing the molecular ID.
Table 3. Basic information of 36 simple sequence repeat (SSR) primer pairs.
Number Primer Chromosome Molecular weight (bp) Number of polymorphic bands
1 P193 1 370-380 3
2 BC22 1 210-225 3
3 NA14-D07 1 130-135 2
4 Na14-H11 2 108-120 3
5 FT-SSR-P1 2 250-265 3
6 SAG12-SSR-P1b 2 180-220 3
7 BRMS-026 2 120-180 8
8 CX272537 3 115-123 3
9 BC7 3 215-235 2
10 BRMS-129 3 180-250 4
11 BRMS-042 3 125-145 2
12 Na12-A01 3 115-120 2
13 BRU05099 4 270-310 4
14 Ol11-H02 4 180-190 2
15 BRMS-034 5 125-145 6
16 CX272976 5 240-245 3
17 BC25 5 185-195 3
18 P193 6 370-380 2
19 ENA1 6 115-125 3
20 BRU00503 6 115-120 2
21 EJU 6 150-180 4
22 ENA6 7 110-120 3
23 BRMS296 7 150-162 3
24 Ra2-A01 7 100-130 5
25 BRMS036 7 115-120 3
26 BRMS-088 8 0-230 2
27 BR319 8 445-460 3
28 BRMS-006 8 145-180 4
29 MR013 9 160-165 2
30 MR172 9 220-240 4
31 BRMS-051 9 245-280 3
32 Ni4-D09 9 165-220 4
33 Na10-G08 10 145-260 3
34 Na12-H04 10 65-100 5
35 BRU02939 10 145-160 3
36 ENA18 10 100-110 3
Digitization of polymorphic bands and establishment of molecular ID
Figure 1. Distribution of 36 simple sequence repeat (SSR) sites on the 10 chromosomes in Chinese cabbage. The primers are mentioned on the left side of chromosomes, and their corresponding positions on the right side of the chromosomes.
Genetic distance and relationship analysis of inbred lines
The data of all bands were encoded in the statistical analysis software NTSYS 2.10 to perform cluster analysis using the UPGMA method. Subsequently, 20 cluster figures corresponding to 20 inbred lines were obtained. These 20 inbred lines can be divided into six categories on the basis of their genetic similarity coefficient of 0.47. For example, the Chinese cabbage varieties A117, A113-1, A105-3, and A109 are all straight-head types; therefore, they belong to the same category in the cluster figure (Figure 4).
Figure 3. Polymorphism of some primers in 20 inbred lines of Chinese cabbage. A1. Amplified bands of Ra2-A01 in 20 inbred lines. A2. Lanes 1-5 = 5 polymorphic bands corresponding to A1. B1. Amplified bands of Ni4-D09 in 20 inbred lines. B2.Lanes 1-4 = 4 polymorphic bands corresponding to B1.
Deduction and verification of the molecular ID of F1 hybrid
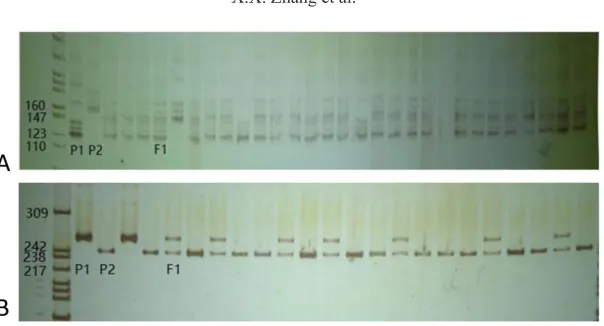
The molecular ID established in this study can be used for protecting the variety rights of inbred lines and hybrids. We can obtain a molecular ID composed of 72 numbers, which is a combination of the parents’ 36 numbers. In this experiment, the hybrid combination A204-1-1 x A8-1 was selected to deduce and verify the molecular ID of its F1 hybrid. In Table 1, the molecular IDs of the parents A204-1-1 and A8-1 are shown as 211233131321115311111 314313224210131 and 332232632112215132111313101321312131, respectively. The SSR markers are codominant; hence, we can deduce the molecular ID of the hybrid combination A204-1-1 × A8-1 as 23 13 12 22 33 32 16 33 12 31 21 12 12 11 55 31 13 12 11 11 11 33 11 43 31 10 31 23 22 41 23 11 02 11 33 11. The electrophoresis results were consistent with our prediction, thus proving that our deduction was correct (Figure 5).
Figure 5. PCR-product bands obtained for the F1 hybrids of A204-1-1 (P1) x A8-1(P2) using 36 core primer pairs. A. 1-9 primers. B. 10-18 primers. C. 19-27 primers. D. 28-36 primers. P1 and P2 refer to parents 1 and 2, respectively.
Purity identification of F1 hybrid
The CX272976 primer was selected to identify the hybrid combination A204-1-1 x A66-2-A204-1-1. The parents, A204-A204-1-1-A204-1-1 and A66-2-A204-1-1, produced the bands of 240 and 245 bp, respectively. Among 100 hybrid bands, 40 were complementary bands, 60 were identical to parent A66-2-1, and none was identical to parent A204-1 (Figure 6B). Hence, the purity of the hybrid was 40.0%, which was consistent with the value obtained in the field investigation (41.3%). Therefore, using molecular IDs for identifying the purity of hybrid species is a reliable method.
DISCUSSION
The use of molecular markers has grown in recent years. Although single nucleotide polymorphism (SNP) markers are widely used, the SSR markers are still recognized as one of the ideal molecular markers because of their low cost, abundant polymorphism, and stable and good reproducibility. In our study, the SSR markers were used to establish a molecular ID database for 20 important inbred lines of Chinese cabbage. Unlike other studies, the present work used the inbred lines and digitized the obvious polymorphic bands. The molecular identification of inbred lines exhibits considerable application value in protecting the variety rights of inbred lines and F1 hybrids. A database based on the molecular IDs of the main inbred lines in Chinese cabbage can be established. This database can be expanded subsequently, and the data and query information can be retrieved at any time. Although the materials used in our study were relatively few in number, 20 inbred lines can yield a large number of hybrid combinations. Hence, the identification method presents a great application value in the future.
Core primers are the key to establishing a fingerprint database (Li et al., 2005). The primers we selected were distributed evenly and accurately on the chromosomes. A total of 36 core primers were selected, and the 20 inbred lines of Chinese cabbage were divided into six categories. The four straight-head type of inbred lines were classified into one group. These results indicated that the importance of the selection of polymorphic primers, which are evenly distributed on the chromosomes.
our prediction, indicating that the SSR markers are codominant and stable. The molecular ID of a hybrid can be deduced from the molecular ID of two inbred lines. A database could be established on the basis of the molecular ID of a hybrid in Chinese cabbage. The data and query information about the F1 hybrids or other varieties can be retrieved from this database. Furthermore, the molecular ID can be used to protect the variety rights of inbred lines and hybrid combinations.
In purity identification, we selected the core primers to identify the two F1 hybrids of the inbred lines of Chinese cabbage, and compared them with the results of field investigation; the results showed a good agreement. Thus, purity identification using one to two SSR sites from the 36 SSR sites was found to be accurate and feasible when we obtained the parents’ molecular IDs. Hence, establishing the molecular ID of hybrids and inbred lines is considerably valuable and presents broad application prospects.
Conflicts of interest
The authors declare no conflict of interest.
ACKNOWLEDGMENTS
Research supported by the Foundation for Key Technologies R&D Program (#2014BAD01B0802) of the Ministry of Science and Technology of the People’s Republic of China.
REFERENCES
Bassam BJ, Caetano-Anollés G and Gresshoff PM (1991). Fast and sensitive silver staining of DNA in polyacrylamide gels. Anal. Biochem. 196: 80-83. http://dx.doi.org/10.1016/0003-2697(91)90120-I
Chen C, Zhang XT, Cheng F, Zhuang M, et al. (2011). Establishment of SSR fingerprinting on autumn cabbage hybrids and their parents. Acta Hortic. Sin. 38: 159-164.
Dai J, Hong DL and Wu YS (2011). SSR fingerprints and genetic similarity analysis of 33 parents for hybrid rice, Xibei Zhiwu Xuebao. Xibei Zhiwu Xuebao 31: 1543-1550.
Gao Y, Luo SX, Wang YH, Gu AX, et al. (2012). Association analysis of bolting and flowering time with SSR and InDel markers in Chinese cabbage. Acta Hortic. Sin. 39: 1081-1089.
Ge J, Xie H, Chui CS, Hong JM, et al. (2005). Analysis of expressed sequence tags (ESTs) derived SSR markers in Chinese cabbage (Brassica campestris L. ssp. pekinensis). J. Agric. Biotechnol. 13: 423-428.
Hu J, Wang L and Li J (2011). Comparison of genomic SSR and EST-SSR markers for estimating genetic diversity in cucumber. Biol. Plant. 55: 577-580. http://dx.doi.org/10.1007/s10535-011-0129-0
Kawamura K, Kawanabe T, Shimizu M, Okazaki K, et al. (2015). Genetic characterization of inbred lines of Chinese cabbage by DNA markers; towards the application of DNA markers to breeding of F1 hybrid cultivars. Data Brief 6: 229-237. http://dx.doi.org/10.1016/j.dib.2015.11.058
Lei TG, He YR, Wu X, Yao LX, et al. (2009). Construction of DNA fingerprinting database of citrus cultivars (lines).
Zhongguo Nong Ye Ke Xue 42: 2852-2861.
Li XH, Li XH, Gao WW, Tian QZ, et al. (2005). Establishment of DNA fingerprinting database of maize hybrids and its application in parentage identification. Acta Agron. Sin. 31: 386-391.
Lowe AJ, Moule C, Trick M and Edwards KJ (2004). Efficient large-scale development of microsatellites for marker and mapping applications in Brassica crop species. Theor. Appl. Genet. 108: 1103-1112. http://dx.doi.org/10.1007/ s00122-003-1522-7
Lu XZ, Ni JL, Li L, Wang XF, et al. (2014). Construction of rice variety identity using SSR fingerprint and commodity information. Acta Agron. Sin. 40: 823-829. http://dx.doi.org/10.3724/SP.J.1006.2014.00823
Pino Del Carpio D, Basnet RK, De Vos RCH, Maliepaard C, et al. (2011). The patterns of population differentiation in a
Brassica rapa core collection. Theor. Appl. Genet. 122: 1105-1118. http://dx.doi.org/10.1007/s00122-010-1516-1
Piquemal J, Cinquin E, Couton F, Rondeau C, et al. (2005). Construction of an oilseed rape (Brassica napus L.) genetic map with SSR markers. Theor. Appl. Genet. 111: 1514-1523. http://dx.doi.org/10.1007/s00122-005-0080-6
Shen XL, Zhang YM, Xue JY, Li MM, et al. (2016). Analysis of genetic diversity of Brassica rapa var. chinensis using ISSR markers and development of SCAR marker specific for Fragrant Bok Choy, a product of geographic indication.
Genet. Mol. Res. 15. http://dx.doi.org/10.4238/gmr.15027557
Song HB, Cui XB, Ma HY, Zhu ZC, et al. (2012). Construction of DNA fingerprint database based on SSR marker for varieties (lines) of Cucumis melo L. Zhongguo Nong Ye Ke Xue 45: 2676-2689.
Sui GL, Yu SC, Yang JX, Wang WH, et al. (2014). Validation of a Core Set of Microsatellite Markers and Its Application for Varieties Identification in Chinese Cabbage. Acta Hortic. Sin. 41: 2021-2034.
Suwabe K, Iketani H, Nunome T, Kage T, et al. (2002). Isolation and characterization of microsatellites in Brassica rapa L.Theor. Appl. Genet. 104: 1092-1098. http://dx.doi.org/10.1007/s00122-002-0875-7
Suwabe K, Tsukazaki H, Iketani H, Hatakeyama K, et al. (2003). Identification of two loci for resistance to clubroot (Plasmodiophora brassicae Woronin) in Brassica rapa L. Theor. Appl. Genet. 107: 997-1002. http://dx.doi. org/10.1007/s00122-003-1309-x
Wang JY, Chen YY, Huang BZ, Yu F, et al. (2009). Establishment of fingerprinting for bananas (Musa nana) by SSR marker. Guoshu Xuebao 26: 733-738.
Wang MR, Xu Y, Zhan YL, Guo SG, et al. (2010). Construction of fingerprinting with SSR for varieties of Cucumis melo
ssp. melo.Zhongguo Nongxue Tongbao 26: 47-51.
Xu J, Liu YH, Ren M, Mu JM, et al. (2011). SSR fingerprint map analysis of tobacco germplasms. Chin. Tob. Sci. 32: 62-65.
Xue Y, Zhang XY, Sha H, Li XY, et al. (2010). Construction of fingerprinting map based on SSR and identification of cultivars for earliness cultivars in upland cotton in Xinjiang. Cotton Sci. 22: 360-366.
Yang XY, Tian SM, Zhang QX, Zhang SX, et al. (2013). Fingerprints of hybrids and their parents of the Qinyan series of Chinese cabbage and purity identification of hybrids. Mol. Plant Breed. 11: 107-112.
Yu SC, Wang YJ and Zheng XY (2003). Construction and analysis of a molecular genetic map of Chinese cabbage.
Zhongguo Nong Ye Ke Xue 36: 190-195.
Yu SC, Zhang FL, Yu RB, Zou YM, et al. (2009). Genetic mapping and localization of a major QTL for seedling resistance to downy mildew in Chinese cabbage (Brassica rapa ssp. pekinensis). Mol. Breed. 23: 573-590. http://dx.doi. org/10.1007/s11032-009-9257-z
Zhang W, Cui JC, Yu SC and Li L (2013). Construction of SSR fingerprint database of Chinese cabbage varieties (Brassica campestris L. ssp. Pekinensis). Mol. Plant Breed. 11: 843-857.
Zhou YQ (2005). The application of DNA molecular markers in plant research. Chem. Ind. Press 131-136.