Original Research Article
Community based cross sectional study to assess the drinking water
handling practices and its association with water borne diseases at
household level, in a tribal community
Sophia D. Fernandes
1, Priyanka Chakkarwar
2*
INTRODUCTION
Safe water is vital for survival and its lack can impact the health, food safety, and livelihoods. Our planet has ample fresh water to achieve a regular and clean water supply for all but bad economics and poor infrastructure can skew supply unfavourably.Water and sanitation are very important for the sustainable development.1
Every year millions of people including children die from diseases associated with inadequate water supply, poor sanitation and hygiene. Since 1990, Two and a half billion people have accessed to improved drinking water still 663 million people are without it. From 1990 to 2015, the proportion of the global population using an improved drinking water source increased from 76-91%. However, each day, nearly 1,000 children die due to
ABSTRACT
Background: 71% of India resides in its villages. The living conditions in rural areas are poor, which make India’s rural population more vulnerable to inaccessibility of safe drinking water and high risk of water borne diseases. Water safety in a community depends on a range of factors, from the quality of source water to storage and handling in the domestic setting. The present study was conducted to understand the knowledge and practices about hygiene of drinking water.
Methods: A community-based, cross-sectional observational study was conducted in Sakhawar a tribal village of Palghar district, Mumbai, Maharashtra, to study the water handling practices in households and its association with the prevalence of water borne diseases. One Pada was selected randomly for study. The duration of data collection was three months. All the houses in the Pada were included in the study.
Results: Of the 152 households included in the study, 47.4% did not use any method of water disinfection whereas 15% used boiling and 40% used chlorination as a method of water disinfection. Tap water was the commonest source of drinking water used by 52.6% of households. Only 7.9% subjects used ladle to draw stored water. The prevalence of water borne diseases was 81.57% and was significantly associated with distance of drinking water source from house, education status, family type, duration of water supply, knowledge of water disinfection methods and water disinfection practiced.
Conclusions: Health education, promotion and practice of hygienic water handling practices can significantly reduce water borne diseases morbidity.
Keywords: Water source, Water disinfection, Water handling practices, Water borne diseases
1
Department of Community Medicine, HBT Medical College and Dr. R. N. Cooper Municipal Hospital, Juhu, Vile Parle (West), Mumbai, Maharashtra, India
2
Primary Health Centre, Khanapur, Haveli, Pune, Maharashtra, India
Received: 07 February 2018
Revised: 10 March 2018
Accepted: 12 March 2018
*Correspondence:
Dr. Priyanka Chakkarwar,
E-mail: [email protected]
Copyright: © the author(s), publisher and licensee Medip Academy. This is an open-access article distributed under the terms of the Creative Commons Attribution Non-Commercial License, which permits unrestricted non-commercial use, distribution, and reproduction in any medium, provided the original work is properly cited.
preventable water and sanitation-related diarrheal diseases.2
From 1992 to 2012 the overall proportion of Indian households with access to improved water sources increased from 68% to 90.6%. Yet, the same report showed that merely having improved water sources does not necessarily represent the water is safe to drink. Person’s water handling practices plays role in access to quality of drinking water. However in developing countries like India, other factors like education, cultural beliefs and socio-economic status impact the water handling practices and the quality of drinking water.3 Sustainable development goal 6 aims to, achieve universal and equitable access to safe and affordable drinking water for all by 2030.4 To achieve this goal, water handling practices plays very important role along with availability and quality of water source.
The objectives of the study were to assess the hygiene and drinking water handling practices at household level and its association with the prevalence of water borne diseases in individual families in last six months against the background of water handling practices prevalent in the area.
METHODS
A community-based, cross-sectional observational study was conducted in Sakhwar a tribal village of Palghar district, Mumbai which is in the rural field practice area of a tertiary health institute. This village was geographically divided into three Padas. One Pada was selected randomly for study purpose. The study was conducted from September 2015 to November 2015. All the houses in the village were included in the study (Sample size N=159). Those houses with family members not willing to participate in the study, closed houses and houses with language barrier as a communication problem were excluded from the study (n=152, seven households was excluded from the study while data collection.)
All the houses in the village were visited once. Written informed consent was taken after explaining the purpose of the study. The family member present at that time was interviewed using a semi- structured and pre-validated questionnaire. During the visit their practices regarding procurement, storage and consumption of water were observed by the interviewer. This was done by observing the source and storage of water as well as asking them to perform certain task (e.g. Can you give me a glass of water?) During this act their water handling practice was observed by the interviewer.
Statistical software used
IBM SPSS Version 21.0 and Microsoft Office Excel 2007.
Statistical analysis
Continuous data has been expressed as mean (Standard deviation) and median (Interquartile range). The categorical data is summarized as frequencies and percentages. The normality of the continuous data was tested by Shapiro-Wilk test. The continuous variables were analyzed by unpaired t test. Categorical data was analyzed using Chi square test and Fisher’s exact test and expressed as frequencies. P<0.05 were accepted as indicative of statistical significance.
RESULTS
A total of 152 families were included in the study having a total of 682 family members. The literacy rate among subjects was 77.6% along with farming as most common occupation among them. The average number of members in each family was five with a mean family income of 3501.3 rupees. The average number of under-five children in each family was two; the socio-demographic profile of the participants is given in table (Table 1).
Table 1: Socio-demographic profile of the participant families.
Socio-demographic factors Frequency %
Education (n=152)
Literate 118 77.6
Illiterate 34 22.4
Occupation (n=152)
Farmer 68 44.7
Labourer 46 30.3
Service 14 9.2
Shopkeeper 14 9.2
Driver 10 6.6
Family type (n=152)
Joint 88 57.9
Nuclear 56 36.8
Three Generation 8 5.3
Members of participant families (n=682)
Adults and children above 5
years 450 66.0
mentioned in terms of minutes of walking required to reach the source. The mean distance of water source from the house was 13.0 minutes. 37.5% subjects had knowledge of waterborne diseases (Table 2).
As seen in Table 3, the knowledge about water borne diseases as well as techniques of water disinfection was significantly associated with literacy as also the practice of disinfecting drinking water and taking extra care during monsoon (Table 3).
The prevalence of water borne diseases was found to be 81.57% and significantly associated with distance of drinking water source from house, education status, family type, duration of water supply, knowledge of
water disinfection methods and water disinfection practiced (Table 4).
Figure 1: Drinking water supply to the households.
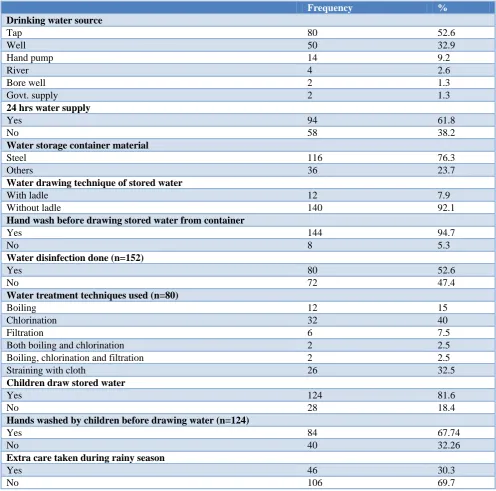
Table 2: Water source, storage and handling practices among the participant families.
Frequency %
Drinking water source
Tap 80 52.6
Well 50 32.9
Hand pump 14 9.2
River 4 2.6
Bore well 2 1.3
Govt. supply 2 1.3
24 hrs water supply
Yes 94 61.8
No 58 38.2
Water storage container material
Steel 116 76.3
Others 36 23.7
Water drawing technique of stored water
With ladle 12 7.9
Without ladle 140 92.1
Hand wash before drawing stored water from container
Yes 144 94.7
No 8 5.3
Water disinfection done (n=152)
Yes 80 52.6
No 72 47.4
Water treatment techniques used (n=80)
Boiling 12 15
Chlorination 32 40
Filtration 6 7.5
Both boiling and chlorination 2 2.5
Boiling, chlorination and filtration 2 2.5
Straining with cloth 26 32.5
Children draw stored water
Yes 124 81.6
No 28 18.4
Hands washed by children before drawing water (n=124)
Yes 84 67.74
No 40 32.26
Extra care taken during rainy season
Yes 46 30.3
No 106 69.7
80 50
14 4 2
2
Tap
Well
Hand pump
River
Borewell
Table 3: Education level of the participant families and practices related to water sanitation.
Practices Education P value
Illiterate Literate
Drawing out stored water With ladle 8 (6.8) 4 (11.8) 0.342
Without ladle 110 (93.2) 30 (88.2)
Hand wash before drawing out water
Yes 110 (93.2) 34 (100)
0.2
No 8 (6.8) 0 (0)
Knowledge of water disinfecting methods
Yes 16 (47.06) 77(65.25)
0.055* No 18 (52.94) 41 (34.74)
Water disinfection done Yes 56 (47.5) 24 (70.6) 0.017*
No 62 (52.5) 10 (29.4)
Knowledge of diseases caused due to water
Yes 37 (31.4) 20 (58.8)
0.004* No 81 (68.6) 14 (41.2)
Extra care during rainy season Yes 20 (16.9) 26 (76.5) <0.0005*
No 98 (83.1) 8 (23.5)
* Significant at 0.05 level of significance. @Fisher Exact test used. Chi-square test used for the remaining.
Table 4: Factors affecting incidence of water related illness among family members.
Factors
Water related illness among family members in
last 6 months P value
Yes No
Family income (mean (SD)) 3562 (1796.6) 3305.6 (2485.0) 0.568#
Number of family members (mean (SD)) 4.6 (1.7) 4.2 (2.6) 0.46#
Number of under- 5 children (mean (SD)) 1.5 (1.2) 1.8 (1.4) 0.159#
Hand washing
With soap 79 (81.4) 17 (18.6)
0.137
With water 32 (66.7) 16 (33.3)
No hand washing 5 (71.4) 3 (28.6)
Education
Illiterate 20 (58.8) 14 (41.2)
0.006*
Literate 96 (81.4) 22 (18.6)
Occupation
Driver 6 (60) 4 (40)
0.009*@
Farmer 58 (85.3) 10 (14.7)
Labourer 36 (78.3) 10 (21.7)
Service 10 (71.4) 4 (28.6)
Shopkeeper 6 (42.9) 8 (57.1)
Family type
Joint 76 (86.4) 12 (13.6)
<0.0005*
Nuclear 32 (57.1) 24 (42.9)
Three generation 8 (100) 0 (0)
Drinking water source
Tap 66 (82.5) 14 (17.5)
0.137@
Well 34 (68) 16 (32)
Hand pump 8 (57.1) 6 (42.9)
River 4 (100) 0 (0)
Bore well 2 (100) 0 (0)
Govt. supply 2 (100) 0 (0)
24 hrs water supply
Yes 64 (68.1) 30 (31.9)
0.002*
No 52 (89.7) 6 (10.3)
Water drawing technique of stored water
With ladle 10 (83.3) 2 (16.7) 0.732@
Without ladle 106 (75.7) 34 (24.3)
Factors
Water related illness among family members in
last 6 months P value
Yes No
Hand wash before drawing stored water from container
Yes 110 (76.4) 34 (23.6)
1.000@
No 6 (75) 2 (25)
Knowledge of water disinfection methods
Yes 81 (85.7) 12 (14.3)
0.002*
No 44 (64.7) 15 (35.3)
Water disinfection done
Yes 52 (65) 28 (35)
0.001*
No 64 (88.9) 8 (11.1)
Children draw stored water
Yes 100 (80.6) 24 (19.4)
0.008*
No 16 (57.1) 12 (42.9)
Knowledge of diseases caused due to water contamination
Yes 40 (70.2) 17 (29.8) 0.168
No 76 (80) 19 (20)
Extra care taken during rainy season
Yes 36 (78.3) 10 (21.7)
0.71
No 80 (75.5) 26 (24.5)
*Significant at 0.05 level of significance. @Fisher exact test used, #Unpaired t test used. Chi-square test used for the remaining.
DISCUSSION
Different studies conducted, in different parts of the country in the past on the subject of drinking water supply, its safety and water handling practices have shown varied results.
In the current study literacy rate was 77.6% and majority was farmer. Similarly in the study conducted by Bharti et al the most common occupation of head of household was farming (54.7%) followed by labor (30.8%), shop and service. However level of literacy was comparatively high with only 9.6% illiterate.5
Safe drinking water by using techniques of water purification helps to reduce waterborne diseases in a community. In the current study, only 15% of the families used boiling whereas 40% used chlorination as a method of disinfection of water. But 47.4% of the families did not use any method of water disinfection. High level of chlorination method in current study was due to their awareness and accessibility of chlorine solution from government supply. In India, approximately 72.7 per cent of the rural population does not use any method of water disinfection.6 Bhattacharya et al. also found 72% of household don’t follow any treatment and drink it as it is.7 As per the WHO/UNICEF Joint Commission Report (2012), 67% of Indian households do not treat their drinking water.8 In a survey conducted by Pachori it was found that 45.3% households used boiling method for purification of drinking water followed by 39.3% of them who treat drinking water by other methods and 15.3% households did not use any treatment for purification of water.9 In disparity to the current study he found that boiling was more commonly
used for purification of drinking water than straining through cloth.
According to National health profile 2017 (as per the census 2011), 43.5% of households in India are using tap water, 11.0% well water and 33.5% hand pump water for purpose of drinking. The corresponding figures in Maharashtra are 67.9%, 14.4% and 9.9% and in the current study are 52.6%, 32.9% and 9.2%.10
The practice of drawing water from its container has the risk of microbial contamination through potentially contaminated hands. In the study conducted by Bharti et al, around two third of informants (64.4%) did know about importance of ladle to draw water while ladle was actually being used in less than one third (30.5%) of households only.5 Similarly, Bhattacharya et al. found only 38% of household used handled jug to take out drinking water from vessel.7 However in the current study only 7.9% of the families used a ladle to draw water. Bharti et al found that 64.3% of informants were aware that boiling or filtering water can prevent water borne diseases but it was being practiced in only 10% of households.5 In this study 61.18% had knowledge of water disinfection methods but it was practiced in 52.63% of households.
of water supply, knowledge of water disinfection methods and water disinfection practiced.
CONCLUSION
Socio demographic profile of community has an impact on water handling practices and also on prevalence of water borne diseases. Statistical data in the current study have shown that literacy plays a major role in safe drinking water handling practices. Also safe water handling practices have significant association with prevalence of water borne diseases. Water safety in a community depends on a range of factors, from the quality of source water to storage and handling in the domestic setting along with socio-demographic profile of community.
Recommendations
There should be focussed efforts on improving awareness about the water disinfection techniques and its association with reduced diarrhoeal morbidity. Only improving the availability and quality of water source will not have the desired impact if the water handling practices remain faulty. Multiple techniques of water purification method should be made easily accessible at local level, so that the people can choose from any of them based on the feasibility, acceptability, cultural norms, etc. The prevalence of water borne diseases in the study area was high which explain the need for the motivation and promotion of safe drinking water handling practices. Distance from water source from households should be reduced.
ACKNOWLEDGEMENTS
I would like to thank the Professor and head of the Department of Community Medicine and my guide at Seth G. S. M. C. and KEM Hospital, Mumbai for their overall motivation and support.
Funding: No funding sources Conflict of interest: None declared
Ethical approval: The study was approved by the Institutional Ethics Committee
REFERENCES
1. Sustainable development goals, Goal 6, Department of Economic and Social affairs, United Nations.
Available at: https://sustainabledevelopment.un. org/sdg6. Accessed on 20 November 2017.
2. Sustainable development goals. Available at http://www.un.org/sustainabledevelopment/water-and-sanitation. Accessed on 20 November 2017. 3. Sustainable development goals, SDG 6. Available at
http://www.in.one.org/page/sustainable-development-goals/sdg-6/. Accessed on 20 November 2017.
4. Sustainable Development Goals (SDGs), Nodal and other Ministries. Draft Mapping, Development Monitoring and Evaluation Office, NITI Aayog, Pg. 9 of 30. Available at niti.gov.in/.../files/Mapping-SDGs%20V19-inistries%20Feedback%
20060416_0.pd. Accessed on 04 April 2016. 5. Bharti, Malik M, Kumar V, Verma R, Chawla S,
Sachdeva S. Knowledge, attitude and practice regarding water handling and water quality assessment in rural block of Haryana. Int J Basic Applied Med Sci. 2013;3(2):243-7.
6. National Family Health Survey (NFHS-3), Available at: http://www.measuredhs.com/pubs/ pdf/FRIND3/00FrontMatter00.pdf. Accessed on 20 November 2017.
7. Bhattacharya M, Joon V, Jaiswal V. Water handling and sanitation practices in rural community of Madhya Pradesh: a knowledge, attitude and practice study. Indian J Prevent Social Med. 2011;42(1):93-7.
8. Water, Environment and Sanitation, UNICEF India. Available at unicef.in/Story/1125/water-Water-Environment-and-Sanitation. Accessed on 20 November 2017.
9. Pachori R. Drinking water and sanitation: household survey for knowledge and practice in rural area, Magudanchavadi, Salem district, India. Int J Community Med Public Health. 2016;3:1820-8. 10. National Health Profile (NHP) of India 2017,
Socio-economic indicators, Chapter 2. Available at http://cdsco.nic.in/writereaddata/National-Health-Policy.pdf. Accessed on 11 January 2018.