Estimation of genetic parameters and prediction of
genotypic values in common beans using mixed models
#
Jessica Delfini1,2, Vania Moda Cirino2, Claudete de Fátima Ruas3, Paulo Mauricio Ruas3, José dos Santos Neto2, Leandro Simões Azeredo Gonçalves1*
1Agronomy Department, State University of Londrina (UEL), Rodovia Celso Garcia Cid, Km 380, Londrina, PR 86051-900, Brazil, 2Agronomic
Institute of Paraná (IAPAR), Rodovia Celso Garcia Cid, Km 375, Londrina, PR 86047-902, Brazil, 3Biology Department, State University of
Londrina (UEL), Rodovia Celso Garcia Cid, Km 380, Londrina, PR 86051-900, Brazil
#This article has been posted in Preprints with a doi 10.20944/preprints201803.0215.v1 (https://www.preprints.org/manuscript/201803.0215/v1)
(Creative Commons CC BY 4.0 license)
INTRODUCTION
Common bean (Phaseolus vulgaris L.) is cultivated all over the world; it is considered the most important legume for fresh consumption and a chief source of proteins (approximately 22%), vitamins and minerals (Ca, Cu, Fe, Mg, Mn, Zn) of human food, in particular in developing countries (Broughton et al., 2003). In the international scenario, Brazil stands out as the world’s third largest producer and one of the largest consumers of common bean (FAO, 2016). The crop is produced in different growing seasons (rainy, dry and fall-winter seasons), and is planted in most Brazilian states, providing constant supply of the product on the market. The country’s annual common bean production is grown on an area of approximately 3.2 million hectares,
with an output of around 3.4 million tons and a mean yield of 1,069 kg ha-1, in the growing seasons of 2016/17
(CONAB, 2017).
In Brazil, common bean yield was significantly optimized in the last decades, as a result of breeding for technological and nutritional quality of common bean (Ramalho et al., 2012). The yield increase is due to several factors, such as technologies of crop planting and management, cultural practices and soil management and conservation. However, the greatest yield gain resulted mainly from the planting of improved cultivars with high yield potential, yield stability resulting from resistance and/or tolerance to adverse biotic and abiotic factors, and suited for mechanical harvesting (Ramalho et al., 2012; Tsutsumi et al., 2015).
In the international scenario of agriculture, Brazil stands out as the main producer and consumer of common bean (Phaseolus vulgaris L.) The increase in the productive potential of the crop is mainly due to breeding programs. The objective of this study was to estimate genetic parameters, predict genotypic values with REML/BLUP (Restricted Maximum Likelihood/Best Linear Unbiased Prediction) and, based on these values, study the variability in common bean cultivars with carioca and black grain. Twenty three agromorphological
descriptors were evaluated, among them grain yield. Deviance analysis detected significant differences between the cultivars in both
groups. Selective accuracy (Ac) was considered high for most of the traits. Broad-sense heritability (hg2 ) ranged from 0.05 to 0.72, but
it was low for the trait yield (YLD). In the carioca grain group, the hg2 values for the traits related to plant morphology were higher than
in the black group. Nevertheless, the hg2 values in the black group were higher in relation to the pod and seed traits. The correlations for
YLD were moderate but different in the two commercial groups studied. In the black group, variables related to the seed morphology were correlated with grain yield, and in the carioca group, traits related to seed quantity. Based on the groupings, variability among the cultivars was observed. Three distinct clusters were formed for the carioca group and four for the black group. Based on the predicted genetic values, genetic variability and the most adapted and stable cultivars were detected among the cultivars in the studied environments. Keywords: Genetic diversity; Phaseolus vulgaris L.; REML/BLUP
A B S T R A C T
http://www.ejfa.me/*Corresponding author:
Leandro Simões Azeredo Gonçalves, Agronomy Department, State University of Londrina (UEL), Rodovia Celso Garcia Cid, Km 380, Londrina, PR 86051-900, Brazil. E-mail: [email protected]
Received: 25 April 2018; Accepted: 04 February 2019
The existence of genetic variability in the species P. vulgaris allows the recombination and selection of cultivars adapted to different environments and to meet the demand of consumers and industry for different purposes and uses (Kelly et al., 1998). The study of genetic variability in commercial cultivars or elite lines is extremely relevant for crop breeding, for underlying the exploitation of traits that are already adapted to specific climatic conditions (Franco et al., 2001). In spite of the variability available in the species, a narrowing of the genetic base of the cultivars developed in Brazilian breeding programs has been observed, since these use mostly Mesoamerican germplasm as parents, with little introduction of alleles derived from other gene pools (Delfini et al., 2017).
The use of mixed models to estimate genetic parameters and predict genotypic values, excluding environmental effects, is extremely important in the orientation of breeding programs, allowing the study of cultivar behavior without the influence of genotype - environment (GE) interaction (Chiorato et al., 2008). In view of the above, this study had the objective of estimating genetic parameters, predicting the genotypic values via REML/ BLUP (Restricted Maximum Likelihood/Best Linear Unbiased Prediction) and based on these values, to study the variability of common bean cultivars of the carioca and black grain market groups.
MATERIAL AND METHODS
Plant material
The data used in this study resulted from two independent trials (carioca and black commercial groups), with economically important, widely grown cultivars in Brazil. All of them were bred in programs of public or private institutions and registered by the National Register of Cultivars of the Ministry of Agriculture, Livestock and Supply, Brazil.
One trial assessed 20 carioca beans cultivars (IAPAR 81, IPR Eldorado, IPR Tangará, IPR Campos Gerais, IPR Curió, IPR Andorinha, IPR Maracanã, IPR Bem-te-vi, IPR Quero-quero, Pérola, BRS Estilo, BRS Notável, Carioca, IAC Alvorada, IAC Formoso, IAC Imperador, FT 65, TAA Bola Cheia, TAA Gol e TAA Dama) and the other 19 black bean cultivars (IAPAR 8 – Rio Negro, IAPAR 20, IAPAR 44, IAPAR 65, Rio Tibagi, IPR Uirapuru, IPR Chopim, IPR Graúna, IPR Gralha, IPR Tuiuiú, IPR Nhambu, BRS Valente, BRS Campeiro, BRS Supremo, BRS Esteio, IAC Una, IAC Diplomata, FT Soberano e FT 41).
Experimental design and phenotyping
The experiments of agromorphological characterization were installed in four environments in the state of Paraná
(BR); two in the rainy season of 2014/2015, in Ponta Grossa (25o09’11”S; 50o09’22”W; altitude: 869 m) and in
Guarapuava (25o23’51”S; 51o32’36”W; altitude: 1041 m),
and two in the dry season of 2015, in Ponta Grossa and Santa Tereza do Oeste (25o05’20”S; 53o35’25”W, altitude:
750 m). The experiments were arranged in a randomized complete block design with three replications and plots consisting of four 4-m rows spaced 0.5 m apart, at a density of 12 plants per linear meter, considering the two central rows for evaluation.
This study analyzed a total of 23 quantitative agromorphological traits, namely: primary leaf length (PLL); primary leaf width (PLW); primary leaf index (PPL/PLW) (PLI); central leaflet length (CLL); central leaflet width (CLW); central leaflet index (CLL/CLW) (CLI); main stem length (StL); insertion height of the 1st pod (IFP); number of nodes on the main stem (NN);
pod length (PL); number of seeds per pod (SP); number of locules per pod (LP); total number of pods per plant (NPP); total number of seeds per plant (NSP); main stem thickness (StTh); seed length (SL); seed width (SWth); seed thickness (STh); total seed weight per plant (TSW); weight of 1,000 seeds (W1000); coefficient J (COEF J); coefficient H (COEF H); and grain yield (YLD).
Data analysis
The agromorphological data were analyzed using the mixed model methodology (model 54), of software Selegen-REML/BLUP (Resende, 2016). The statistical model was
y Xr Zg Wi e= + + + , where y is the data vector; r the vector of replication effects (assumed as fixed) added to the general mean; g the vector of genotypic effects (assumed as random); i the vector of the effects of the genotype - environment interaction (GE) (random); and e the vector of (random) errors. X, Z and W represent the incidence matrices for the above effects. The assumed distributions and structures of means (E) and variances (Var) were:
E y g i e Xr Var g i e I = = 0 0 0 ; gg i e I I 2 2 2 0 0 0 0 0 0
The model was fitted using the mixed model equations:
' ' ' ' ' ' ' 1 ' ' ' ' 2 ˆ ˆ ` ˆ
X X X Z X W r X y
Z X Z Z I Z W g Z y
W X W Z W W I i W y
+ × = + ,
where λ σ σ 1 2 2 2 2 2 1 = e = − −
g
g
g
h i
h ; where hg g
g i e
2
2
2 2 2
=
+ +
corresponds to the individual heritability in the broad sense of the block; i i
g i e
2 2
2 2 2
=
+ +
to the coefficient of
determination of the GE interaction effects; g2is the
genotypic variance between common bean cultivars; i2
the variance of the GE interaction; e2the residual variance
between plots; r h
h i gloc i g i g g = + = + 2 2 2 2
2 2 corresponds to the
genotypic correlation of genotypes across environments.
The iterative estimators of the variance components, by restricted maximum likelihood (REML) and the EM
algorithm, were
( )
' ' ' ' ' ' '
2 ˆ ˆ ˆ
ˆe y y r X y g Z y i W y
N r x
= − − −
−
;
2 22
2 ˆ ˆ ˆ ˆ
ˆ ' e '
g
g g trC g
q
= + ;
' 2 33
2 ˆ
ˆ e
i
i i trC
s
= + ;
w h e r e : C 2 2a n d C3 3 w e r e f r o m
C C C C C C C C C C C C C C − − = = 1 11 21 31 12 22 32 13 23 33 1 11 21 31 122 22 32 13 23 33 C C C C C
, where C is the
matrix of the coefficients of mixed model equations; tr the matrix trace operator; r(x) is the rank of matrix X; N, q, s = total number of data, number of genotypes and number of GE combinations, respectively.
By this model, the empirical BLUP predictors (eBLUP or REML/BLUP) of the interaction-free genotypic values were obtained, given byˆ +g i , where ˆ is the mean of
all environments and gi the genotypic effect free of the
GE interaction. For each environment j, the genotypic values (Vg) are predicted by j + +gi
( )
ˆge ij, where j is the mean of environment j; gi the genotypic effect ofgenotype i in environment j; and
( )
ˆge ij is the effect of the GE interaction in relation to genotype i.The prediction of genotypic values by capitalizing the mean interaction (ˆgem) in the different environments is given by
i gi ˆ ,gem
+ + and is calculated by:
2 2 2 ˆ ˆ ˆ ˆ g i i g n g + + ,
in which ˆ is the overall mean of all environments; n the number of environments, and gi the genotypic effect of
genotype i.
The Harmonic Mean of Genetic Values (HMGV) to assess yield stability was computed by the equation:
HMGV n Vg i j n ij = =
∑
11 , where n is the number of
environments (n = 4) in which genotype i was evaluated, and Vgij the genotypic value of genotype i in environment
j, expressed as the proportion of the mean of this environment. The Relative Performance of Genetic Values (RPGV) for adaptability was calculated by the expression:
RPGV n Vg M i j n ij j
=1
(
∑
=1)
, where Mj is the mean commonbean yield in environment j. The combined selection, considering common bean yield, stability and adaptability simultaneously, is given by the statistics HMRPGV:
H M R P G V n
Vg
i
j n
i j
= /
(
∑
=1 ×1)
.The predicted genotypic values of the agromorphological traits were used for Pearson’s correlation analysis and Ward’s hierarchical cluster analysis based on the mean standardized Euclidean distance. For these analyses we used software R (R Core Team 2017) with the packages corrplot and ade4.
RESULTS
By analysis of deviance, a significant effect of genotypes (P <0.05) was detected by the chi-square test for all traits evaluated. A significant effect was also observed for the GE interaction for most traits, except StTh and COEF J in the carioca group and SL and SWth in the black group. The selective accuracy (Ac) ranged from 0.60 (NPP) to 0.98 (COEF J) and from 0.50 (PLI) to 0.98 (PL) in the carioca and black groups, respectively (Tables 1 and 2).
Heritability in the broad sense (hg2) varied from 0.07 (NPP)
to 0.72 (COEF J) in the carioca group and from 0.05 (PLI) to 0.72 (PL) in the black group. In both groups, hg2for YLD
was considered low (0.12). The hg2 values for the carioca
group were higher than for the black group for the traits related to plant morphology (PLL, PLW, PLI, CLL, CLW, CLL, StL, NN and StTh), while for the black group, hg2
was higher for pod and seed-related traits (PL, SP, LP, NPP, SL, STh, W1000 and COEF H).
The rgloc values, which indicate the genotypic correlation
confirmed the results for heritability in the black and carioca groups. In both, the traits with higher hg2 were
associated with a higherrgloc. The hg2 values for YLD were
equal for both groups, although rgloc was higher for the
black group.
In Pearson’s linear correlation analysis, the correlations were high between IFP x StL (0.73 and 0.78, respectively), NPP x NSP (0.80 and 0.87, respectively) and SP x LP (0.93 and 0.89, respectively) (Fig. 1). No variables with high correlations with YLD were detected. Moderate correlations were observed for SP, NSP and TSW (0.52, 0.57 and 0.61, respectively) in the carioca group, and for PLL (0.62), PLW (0.61), SL (0.58), SWth (0.47), STh (0.40), and W1000 (0.67) for the black group.
By Ward’s clustering method, the carioca cultivars were separated in three groups; the first with the cultivars IAC Imperador, IPR Curió, IPR Andorinha and Gol; the second and most numerous contained 11 cultivars (BRS Notável, IPR Quero-quero, IPR Eldorado, IPR Campos
Gerais, BRS Estilo, IAC Formoso, IPR Bem-te-vi, Carioca, Pérola, IAPAR 81 and IPR Maracanã); and the third group comprised the cultivars IAC Alvorada, FT-65, IPR Tangará, Bola Cheia and Dama (Fig. 2a).
In the black group, the cultivars were separated in four groups; group I was constituted by cultivars IAPAR 44, IAPAR 20 and Rio Negro; group II consisted of IPR Graúna, IAC Diplomata, IPR Gralha and FT 41; group III of IAPAR 65, IPR Nhambu, BRS Campeiro, IPR Uirapuru and BRS Esteio; and group IV consisted of the cultivars BRS Valente, IPR Chopim, IAC Una, FT Soberano, BRS Supremo, IPR Tuiuiú and Rio Tibagi (Fig. 2b).
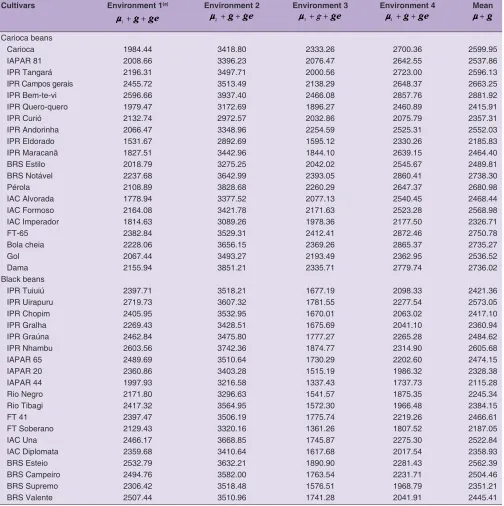
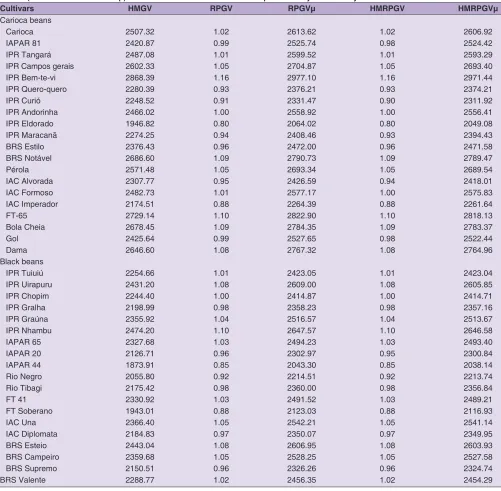
According to estimates of genotype values of YLD of common bean cultivars for the four environments and their means, and by the methods applied in the analysis of adaptability (HMGV), stability (RPVG) and both together (HMRPGV), five cultivars stood out above the others in the different environments, for all methods (Tables 3 and 4). For both groups, the mean environment and the HMRPGV
Table 1: Genetic parameters for 23 agromorphological traits in the characterization study of carioca bean cultivars in four environments in the state of Paraná in the rainy (2014/15) and dry growing seasons (2015/15)
Traits(b) Genetic parameters(a)
Vg Vint Ve Vph h
g2 Ac rgloc Mean
PLL 0.10 0.06 0.12 0.28 0.36 0.90 0.63 6.70
PLW 0.08 0.03 0.08 0.20 0.43 0.93 0.75 5.39
PLI 0.00 0.00 0.00 0.00 0.31 0.90 0.75 1.24
CLL 0.10 0.06 0.29 0.46 0.23 0.85 0.64 9.19
CLW 0.09 0.03 0.18 0.31 0.29 0.89 0.73 7.14
CLI 0.00 0.00 0.00 0.01 0.56 0.96 0.87 1.29
StL 239.48 33.93 77.75 351.16 0.68 0.97 0.88 79.46
IFP 1.12 1.32 4.69 7.14 0.16 0.78 0.46 15.45
NN 1.27 0.34 1.40 3.01 0.42 0.93 0.79 13.89
PL 0.27 0.03 0.12 0.41 0.65 0.97 0.91 11.27
SP 0.10 0.03 0.15 0.28 0.34 0.91 0.74 5.96
LP 0.10 0.02 0.08 0.20 0.51 0.95 0.84 6.62
NPP 1.27 4.57 12.66 18.50 0.07 0.60 0.22 20.15
NSP 103.48 99.19 267.18 469.86 0.22 0.83 0.51 90.18
StTh 0.22 0.00 0.23 0.45 0.48 0.96 0.98 6.17
SL 0.08 0.02 0.05 0.15 0.55 0.95 0.83 10.76
SWth 0.03 0.01 0.02 0.06 0.61 0.96 0.86 6.82
STh 0.03 0.02 0.02 0.07 0.39 0.90 0.61 5.11
TSW 6.94 9.58 19.26 35.77 0.19 0.80 0.42 23.50
W1000 294.18 141.33 223.20 658.71 0.45 0.92 0.68 261.69
COEF J 0.00 0.00 0.00 0.00 0.72 0.98 0.94 1.58
COEF H 0.00 0.00 0.00 0.00 0.30 0.86 0.53 0.75
YLD 50553.00 52571.65 312176.82 415301.47 0.12 0.75 0.49 2564.32
(a)Vg: genotypic variance; Vint: variance of genotype-environment interaction; Ve: residual variance; Vph: phenotypic variance;hg2: broad-sense heritability;
Ac: selective accuracy;rg l o c : genotype correlation between performance in various environments; and Mean: overall mean.(b) Primary leaf length (PLL); primary
leaf width (PLW); primary leaf index (PPL/PLW) (PLI); central leaflet length (CLL); central leaflet width (CLW); central leaflet index (CLL/CLW) (CLI); main stem
length (StL); insertion height of the 1st pod (IFP); number of nodes on the main stem (NN); pod length (PL); number of seeds per pod (SP); number of locules
per pod (LP); total number of pods per plant (NPP); total number of seeds per plant (NSP); main stem thickness (StTh); seed length (SL); seed width (SWth);
method were completely coincident, and the variations in the other environments were small.
The cultivars that stood out in the carioca group were IPR Bem-te-vi, FT-65, BRS Notável, Bola Cheia and Dama (yields from 2,783.37 to 2,971.44 kg ha-1). Among the
black-grain cultivars, those with the best performance were IPR Nhambu, IPR Uirapuru, BRS Esteio, IAC Una and BRS Campeiro (yields from 2,773.37 to 2,971.44 kg ha-1).
These grain yield values indicate the mean genotypic value, penalized by instability and capitalized by adaptability (HMRPGV). In both experiments, the yield of the best-performing cultivars exceeded the general mean (2,558.52 and 2,409.03 kg ha-1 for the carioca and black groups,
respectively).
DISCUSSION
Common bean is fundamental in the Brazilian agriculture, grown all year long by small, medium and large producers and in diverse farming systems and different climates (Faria
et al., 2014). Consequently, cultivars with wide adaptation, yield stability as well as a high yielding potential must be developed (Moda-Cirino et al., 2012), wherefore germplasm with high variability must be used in the crop breeding programs. For the commercial cultivars investigated in this study, genetic variability was detected by deviance analysis, allowing progress of the breeding programs.
According to Resende and Duarte (2007), selective accuracy (Ac) was considered high or very high for most traits, and moderate only for the variables NPP and PLI, respectively, in the carioca and black groups. This is a precision measure based on the correlation between the predicted and true genetic values, and shows the quality of data and procedures used to predict genetic values; the higher the Ac, the greater the reliability of a predicted genetic value (Pimentel et al., 2014).
Traits with hg2 between ≥0.49 and <0.81 are considered
high (Cargnelutti Filho et al., 2009), and most of them coincided for both groups (PL, LP, SL, SWth and COEF J),
Table 2: Genetic parameters for 23 agromorphological traits in the characterization study of black bean cultivars in four environments in the state of Paraná, in the rainy (2014/15) and dry growing seasons (2015/15)
Traits(b) Genetic parameters(a)
Vg Vint Ve Vph h
g2 Ac rgloc Mean
PLL 0.06 0.12 0.09 0.27 0.23 0.79 0.34 6.23
PLW 0.03 0.06 0.06 0.15 0.19 0.76 0.32 4.83
PLI 0.00 0.00 0.00 0.00 0.05 0.50 0.11 1.29
CLL 0.11 0.07 0.31 0.50 0.22 0.84 0.59 9.37
CLW 0.06 0.04 0.15 0.25 0.25 0.86 0.63 7.12
CLI 0.00 0.00 0.00 0.00 0.19 0.84 0.72 1.32
StL 31.90 23.27 79.07 134.24 0.24 0.85 0.58 84.48
IFP 1.72 1.92 4.43 8.07 0.21 0.82 0.47 16.19
NN 0.57 0.23 1.10 1.89 0.30 0.89 0.72 14.33
PL 0.49 0.05 0.14 0.68 0.72 0.98 0.91 10.36
SP 0.08 0.01 0.13 0.22 0.37 0.92 0.87 6.21
LP 0.09 0.01 0.07 0.17 0.53 0.96 0.90 6.76
NPP 3.09 3.40 14.92 21.42 0.14 0.77 0.48 21.65
NSP 60.12 104.89 371.55 536.55 0.11 0.72 0.36 103.62
StTh 0.09 0.06 0.24 0.38 0.23 0.85 0.61 6.54
SL 0.12 0.00 0.06 0.19 0.64 0.97 0.96 10.34
SWth 0.05 0.00 0.03 0.09 0.57 0.96 0.92 6.53
STh 0.03 0.00 0.03 0.06 0.41 0.93 0.88 4.79
TSW 4.15 5.10 19.10 28.35 0.15 0.77 0.45 23.44
W1000 298.53 95.83 211.31 605.67 0.49 0.94 0.76 225.07
COEF J 0.00 0.00 0.00 0.00 0.67 0.97 0.91 1.58
COEF H 0.00 0.00 0.00 0.00 0.48 0.93 0.75 0.73
YLD 28996.66 16806.49 199931.17 245734.32 0.12 0.76 0.63 2411.00
(a)Vg: genotypic variance; Vint: variance of genotype-environment interaction; Ve: residual variance; Vph: phenotypic variance;h
g
2: broad-sense heritability;
Ac: selective accuracy;rg l o c : genotype correlation between performance in various environments; and Mean: overall mean.(b) Primary leaf length (PLL); primary
leaf width (PLW); primary leaf index (PPL/PLW) (PLI); central leaflet length (CLL); central leaflet width (CLW); central leaflet index (CLL/CLW) (CLI); main stem
length (StL); insertion height of the 1st pod (IFP); number of nodes on the main stem (NN); pod length (PL); number of seeds per pod (SP); number of locules
per pod (LP); total number of pods per plant (NPP); total number of seeds per plant (NSP); main stem thickness (StTh); seed length (SL); seed width (SWth);
whereas heritability was high for CLI and StL only for the carioca group and for W1000 only for the black group. The traits with high hg2 values had little influence of the GE
interaction on the observed phenotypic values. In addition, the correlation between environments (rgloc) was higher,
i.e., these traits are more stable in different environments, mainly influenced by the genotype.
The hg2 and rgloc values of the yield-related traits (NPP,
NSP, TSW and YLD) were low (<0.25), and moderate only
for W1000 (Cargnelutti Filho et al., 2009). These values coincide with the values reported by other authors, for common bean as well as cowpea, snap bean, and cotton (Chiorato et al., 2008; Carvalho et al., 2015; Farias et al., 2016; Sousa et al., 2017), demonstrating that these traits are strongly influenced by GE interaction.
The hg2 values for YLD were equal for both groups,
although rgloc of the black group was higher than that of
the carioca group. These values can be explained by the
Table 3: Estimates of genotypic values of grain yield (kg ha-1) of carioca and black bean cultivars for four environments and for the
mean environment
Cultivars Environment 1(a)
1 ˆ
ˆ + +ˆ
µ g ge
Environment 2
2 ˆ ˆ
ˆ + +
µ g ge Environment 3µˆ3+ +gˆ geˆ
Environment 4
4 ˆ ˆ
ˆ + +
µ g ge Meanµˆ+gˆ Carioca beans
Carioca 1984.44 3418.80 2333.26 2700.36 2599.95
IAPAR 81 2008.66 3396.23 2076.47 2642.55 2537.86
IPR Tangará 2196.31 3497.71 2000.56 2723.00 2596.13
IPR Campos gerais 2455.72 3513.49 2138.29 2648.37 2663.25
IPR Bem-te-vi 2596.66 3937.40 2466.08 2857.76 2881.92
IPR Quero-quero 1979.47 3172.69 1896.27 2460.89 2415.91
IPR Curió 2132.74 2972.57 2032.86 2075.79 2357.31
IPR Andorinha 2066.47 3348.96 2254.59 2525.31 2552.03
IPR Eldorado 1531.67 2892.69 1595.12 2330.26 2185.83
IPR Maracanã 1827.51 3442.96 1844.10 2639.15 2464.40
BRS Estilo 2018.79 3275.25 2042.02 2545.67 2489.81
BRS Notável 2237.68 3642.99 2393.05 2860.41 2738.30
Pérola 2108.89 3828.68 2260.29 2647.37 2680.98
IAC Alvorada 1778.94 3377.52 2077.13 2540.45 2468.44
IAC Formoso 2164.08 3421.78 2171.63 2523.28 2568.98
IAC Imperador 1814.63 3089.26 1978.36 2177.50 2326.71
FT-65 2382.84 3529.31 2412.41 2872.46 2750.78
Bola cheia 2228.06 3656.15 2369.26 2865.37 2735.27
Gol 2067.44 3493.27 2193.49 2362.95 2536.52
Dama 2155.94 3851.21 2335.71 2779.74 2736.02
Black beans
IPR Tuiuiú 2397.71 3518.21 1677.19 2098.33 2421.36
IPR Uirapuru 2719.73 3607.32 1781.55 2277.54 2573.05
IPR Chopim 2405.95 3532.95 1670.01 2063.02 2417.10
IPR Gralha 2269.43 3428.51 1675.69 2041.10 2360.94
IPR Graúna 2462.84 3475.80 1777.27 2265.28 2484.62
IPR Nhambu 2603.56 3742.36 1874.77 2314.90 2605.68
IAPAR 65 2489.69 3510.64 1730.29 2202.60 2474.15
IAPAR 20 2360.86 3403.28 1515.19 1986.32 2328.38
IAPAR 44 1997.93 3216.58 1337.43 1737.73 2115.28
Rio Negro 2171.80 3296.63 1541.57 1875.35 2245.34
Rio Tibagi 2417.32 3564.95 1572.30 1966.48 2384.15
FT 41 2397.47 3506.19 1775.74 2219.26 2466.61
FT Soberano 2129.43 3320.16 1361.26 1807.52 2187.05
IAC Una 2466.17 3668.85 1745.87 2275.30 2522.84
IAC Diplomata 2359.68 3410.64 1617.68 2017.54 2358.93
BRS Esteio 2532.79 3632.21 1890.90 2281.43 2562.39
BRS Campeiro 2494.76 3582.00 1763.54 2231.71 2504.46
BRS Supremo 2306.42 3518.48 1576.51 1968.79 2351.21
BRS Valente 2507.44 3510.96 1741.28 2041.91 2445.41
(a) Environment 1: Ponta Grossa (rainy season-2014/15), Environment 2: Guarapuava (rainy season-2014/15), Environment 3: Ponta Grossa (dry season-2015)
fact that the variance in the GE interaction (Vint) was higher in the carioca than the black group (12.7% and 6.8% respectively), i.e. for YLD, the carioca cultivars are more influenced by the environment and therefore less stable than those of the black group.
For the carioca group, hg2was high (0.68) for the trait stem
length (StL), and little influenced by the environment (9.7%), different from the black group for this trait (hg2and
Vint of 0.24 and 17%, respectively). These values were probably due to the presence of genotypes with a determinate growth habit among the carioca cultivars.
Similar results found in the literature, Kornegay et al. (1992) showed that, in crosses with a at least one of the parents with determinate growth habit, heritability was higher than in crosses between parents with indeterminate growth habit.
The correlation between traits is extremely useful in breeding programs, especially when based on predicted genotypic values, unaffected by environmental effects. The correlations for YLD were different in the two commercial groups (Fig. 1). In the black group, the variables correlated with grain yield were related to seed morphology (SL,
Table 4: Stability of genetic values (HMGV), adaptability of genetic values (RPGV and RPGVμ), stability and adaptability of genetic values (HMRPGV and HMRPGVμ) of carioca and black bean cultivars predicted by BLUP analysis
Cultivars HMGV RPGV RPGVμ HMRPGV HMRPGVμ
Carioca beans
Carioca 2507.32 1.02 2613.62 1.02 2606.92
IAPAR 81 2420.87 0.99 2525.74 0.98 2524.42
IPR Tangará 2487.08 1.01 2599.52 1.01 2593.29
IPR Campos gerais 2602.33 1.05 2704.87 1.05 2693.40
IPR Bem-te-vi 2868.39 1.16 2977.10 1.16 2971.44
IPR Quero-quero 2280.39 0.93 2376.21 0.93 2374.21
IPR Curió 2248.52 0.91 2331.47 0.90 2311.92
IPR Andorinha 2466.02 1.00 2558.92 1.00 2556.41
IPR Eldorado 1946.82 0.80 2064.02 0.80 2049.08
IPR Maracanã 2274.25 0.94 2408.46 0.93 2394.43
BRS Estilo 2376.43 0.96 2472.00 0.96 2471.58
BRS Notável 2686.60 1.09 2790.73 1.09 2789.47
Pérola 2571.48 1.05 2693.34 1.05 2689.54
IAC Alvorada 2307.77 0.95 2426.59 0.94 2418.01
IAC Formoso 2482.73 1.01 2577.17 1.00 2575.83
IAC Imperador 2174.51 0.88 2264.39 0.88 2261.64
FT-65 2729.14 1.10 2822.90 1.10 2818.13
Bola Cheia 2678.45 1.09 2784.35 1.09 2783.37
Gol 2425.64 0.99 2527.65 0.98 2522.44
Dama 2646.60 1.08 2767.32 1.08 2764.96
Black beans
IPR Tuiuiú 2254.66 1.01 2423.05 1.01 2423.04
IPR Uirapuru 2431.20 1.08 2609.00 1.08 2605.85
IPR Chopim 2244.40 1.00 2414.87 1.00 2414.71
IPR Gralha 2198.99 0.98 2358.23 0.98 2357.16
IPR Graúna 2355.92 1.04 2516.57 1.04 2513.67
IPR Nhambu 2474.20 1.10 2647.57 1.10 2646.58
IAPAR 65 2327.68 1.03 2494.23 1.03 2493.40
IAPAR 20 2126.71 0.96 2302.97 0.95 2300.84
IAPAR 44 1873.91 0.85 2043.30 0.85 2038.14
Rio Negro 2055.80 0.92 2214.51 0.92 2213.74
Rio Tibagi 2175.42 0.98 2360.00 0.98 2356.84
FT 41 2330.92 1.03 2491.52 1.03 2489.21
FT Soberano 1943.01 0.88 2123.03 0.88 2116.93
IAC Una 2366.40 1.05 2542.21 1.05 2541.14
IAC Diplomata 2184.83 0.97 2350.07 0.97 2349.95
BRS Esteio 2443.04 1.08 2606.95 1.08 2603.93
BRS Campeiro 2359.68 1.05 2528.25 1.05 2527.58
BRS Supremo 2150.51 0.96 2326.26 0.96 2324.74
SWth, STh and W1000), and the seed quantity produced (SP, NPP, NSP and TSW) in the carioca group. However, all correlations with yield-related variables were moderate.
One of the main differences between the purpose of common bean breeding programs of the carioca and black groups in Brazil is related to grain traits. Breeding programs for carioca cultivars emphasize grain size, shape and color, selecting plants with large grains, oblong shape and a light beige skin with light brown stripes, according to the preference and acceptance of consumers and producers (Pereira et al. 2017). It is known that cultivars
with larger seeds produce less than those with smaller seeds (White and Gonzalez, 1990). Therefore, since for the black group there is no demand for large seeds, cultivars with smaller seeds and high yield potential were selected, as demonstrated by the correlations between grain size and yield.
In agreement with these results, Cabral et al. (2011) observed a significant phenotypic correlation between the variable yield and the number of pods per plant and number of seeds per plant, while the other variables studied were weakly correlated with grain yield. Likewise, Barili
Fig 1. Pearson’s genotypic correlation among 23 agronomic traits evaluated in 20 and 19 carioca (bottom) and black bean cultivars (top),
respectively. primary leaf length (PLL); primary leaf width (PLW); primary leaf index (PPL/PLW) (PLI); central leaflet length (CLL); central leaflet width (CLW); central leaflet index (CLL/CLW) (CLI); main stem length (StL); insertion height of the 1st pod (IFP); number of nodes on the main
stem (NN); pod length (PL); number of seeds per pod (SP); number of locules per pod (LP); total number of pods per plant (NPP); total number of seeds per plant (NSP); main stem thickness (StTh); seed length (SL); seed width (SWth); seed thickness (STh); total seed weight per plant
et al. (2011) observed that 1000-grain weight and number of pods per plant are correlated with grain yield.
In the clustering of the carioca cultivars, group I was characterized by cultivars with shorter stem length (StL), for being cultivars with a determinate growth habit, with lowest means for NSP and StTh as well. For group II, the means were lowest in relation to leaf size traits (PLL, PLW, CLL and CLW) while number of seeds per plant (NSP) was highest. For group III, stem length (StL) was longest, higher means for seed size (SL, SWth, STh) and consequently higher means for W1000 and YLD. Three of the cultivars identified as higher-yielding and more adapted and stable in the carioca group, were grouped in group III.
The main differentiating traits of the black bean cultivars clustered in group I were a longer mean stem length (StL) and higher insertion height of the first pod (IFP). The seed means (SL, SWth, STh) were the lowest, characterizing this group by smaller seeds than those of the others. This group had the lowest mean YLD, probably because it is formed by ancient cultivars. In group II, no markedly
different traits from the others groups were observed. In group III the means for W1000 and YLD were highest. With the exception of cultivar IAC Una, the cultivars with improved performance of yield, stability and adaptability were assigned to this group. In group IV, on the other hand, the mean IFP values were lower.
With regard to YLD, for the best–preforming cultivars, the predicted means for the environments and the HMRPGV values coincided 92 and 84%, respectively, for the black and carioca groups. In other words, there were small variations in relation to the assessed cultivars and alterations in the ranking among the environments. However, the highlighted cultivars were generally the most productive in the four environments, demonstrating that the efforts of breeding programs invested in adaptability and yield stability in different environments were effective.
Other authors reported similar results, reinforcing that this method leads to a refinement of cultivar selection, as well as having the advantage of providing results on the proper measurement scale of the trait (Carbonell et al., 2007). The GE interaction is one of the great challenges for breeders, particularly in the evaluation stages of genotypes for recommendation for producers, since the experiments are carried out at different locations and in different years and growing seasons (Peixouto et al., 2016).
Owing to breeding efforts, the carioca cultivars developed since 2005 reach higher production levels than the older ones (Barili et al., 2015). The cultivars used in this study were generally developed and registered in the last 10 years, except for the cultivars Pérola, Carioca and IAPAR 81 (registered in 1998), although, all produced satisfactory yields.
The black group accounts for only 17% of the Brazilian production (Faria et al., 2014), therefore, less breeding efforts are invested than for the carioca group. However, since 1988, significant progress was observed in the genetic gain of black bean cultivars, and cultivars that reach higher yield levels are still being developed (Barili et al., 2016).
CONCLUSIONS
Although breeding led to a bottleneck in the genetic base of the species, genetic variability among the cultivars was detected, for both market groups studied. Based on the genetic values predicted for the evaluated traits, free of GE interaction, genetic variability was observed among the cultivars, and the best adapted and most stable in the studied environments were identified.
Fig 2. Dendrogram of genetic dissimilarity between 20 and 19 carioca
(a) and black (b) bean cultivars grouped by Ward’s method, based on the standardized mean Euclidean distance matrix.
a
ACKNOWLEDGMENTS
This research was supported by the Parana State’s resource through the Instituto Agronômico do Paraná–IAPAR, and CAPES.
AUTHORS’ CONTRIBUTIONS
J.D.: Designed and conducted the experiment, wrote the manuscript draft; V.M.C: study design and supervised the research project; C.F.R. and P.M.R.: were involved in manuscript preparation; J.S.N.: Participate on carrying out the field experiments; L.S.A.G.: did the statistical analysis, contributed to writing of discussions and reviewed the paper.
REFERENCES
Barili, L. D., N. M. Do Vale, P. P. P. Morais, J. N. Da Cruz Baldissera, C. B. De Almeida, F. Da Rocha, G. Valentini, J. G. Bertoldo, J. L. M. Meirelles and A. F. Guidolin. 2011. Phenotypic correlation between yield components of common bean (Phaseolus vulgaris L.). Semin. Cienc. Agrar. 32: 1263-1274.
Barili, L. D., N. M. Vale, J. E. Carneiro, F. F. Silva and F. L. Silva. 2016. Five decades of black common bean genetic breeding in Brazil. Pesqui. Agropecu. Trop. 46: 259-266.
Barili, L. D., N. M. Vale, A. L. Prado, J. E. Carneiro, F. F. Silva and M. Nascimento. 2015. Genotype-environment interaction in common bean cultivars with carioca grain, recommended for cultivation in Brazil in the last 40 years. Crop Breed. Appl. Biotechnol. 15: 244-250.
Broughton, W. J., G. Hernandez, M. Blair, S. Beebe, P. Gepts and J. Vanderleyden. 2003. Beans (Phaseolus Spp.) model food legumes. Plant Soil. 252: 55-128.
Cabral, P. D. S., T. C. B. Soares, A. B. P. Lima, Y. J. B. Soares and J. A. Silva. 2011. Path analysis of grain yield of common bean (Phaseolus vulgaris L.) and its components. Ciência Rural. 42: 132-138.
Carbonell, S. A. M., A. F. Chiorato, M. D. V. Resende, L. A. Dias, A. L. A. Beraldo, and E. F. Perina. 2007. Stability of common bean cultivars and lines in different environments in the state of São Paulo. Bragantia. 66: 193-201.
Cargnelutti Filho, A., L. Storck and N. D. Ribeiro. 2009. Measures of experimental precision in common bean and soybean genotype trials. Pesqui. Agropecu. Bras. 44: 1225-1231.
Carvalho, L. P., J. F. C. Farias, C. D. L. Morello and P. E. Teodoro. 2016. Use of REML/BLUP methodology for selecting cotton genotypes with higher adaptability and productive stability. Bragantia. 2016: 1-8.
Chiorato, A. F., S. Augusto, M. Carbonell, L. Antônio, M. Deon and V. Resende. 2008. Prediction of genotypic values and estimation of genetic parameters in common bean. Braz. Arch. Biol. Technol. 51: 465-472.
CONAB. 2017. Monitoring of the Brazilian Grain Harvest, Season 2016/2017. 9th Survey. CONAB, Brazil.
Delfini, J., V. Moda-Cirino, C. F. Ruas J. N. dos Santos, P. M. Ruas, J. S. Buratto, E. R. Ruas and L. S. A. Gonçalves. 2017. Distinctness of Brazilian common bean cultivars with carioca and black grain by means of morphoagronomic and molecular descriptors. PLoS One. 12: e0188798.
FAO. 2016. FAOSTAT: FAO Statistical Databases. Food and Agriculture Organization, Rome.
Faria, L. C., P. G. S. Melo, H. S. Pereira, A. Wendland, S. F. Borges, I. A. F. Pereira, J. L. C. Diaz, M. Calgaro and L. C. Melo. 2014. Genetic progress during 22 years of black bean improvement. Euphytica. 199: 261-272.
Franco, M. C., S. T. A. Cassini, V. R. Oliveira and S. M. Tsai. 2001. Characterization of the genetic diversity of common beans by RAPD markers. Pesqui. Agropecu. Bras. 36: 381-385.
Kelly, J. D., J. M. Kolkman and K. Schneider. 1998 Breeding for yield in dry bean (Phaseolus vulgaris L.). Euphytica. 102: 343-356. Kornegay, J., J. W. White and O. O. Cruz. 1992. Growth habit and
gene pool effects on inheritance of yield in common bean. Euphytica. 62: 171-180.
Moda-Cirino, V., A. C. Gerage, C. R. Riede, G. H. Sera, M. Takahashi, N. S. Abbud, N. R. X. Nazareno, P. M. Araujo, P. M. Auler, R. S. Yamaoka, T. Sera and W. P. Almeida. 2012. Plant breeding at Instituto Agronômico do Paraná IAPAR. Crop Breed. Appl. Biotechnol. S2: 25-30.
Peixouto, L. S., J. A. R. Nunes and D. F. Furtado. 2016. Factor analysis applied to the G GE matrix via REML BLUP for multi-environment data. Crop Breed. Appl. Biotechnol. 16: 1-6. Pereira, H. S., R. C. Alvares, F. Silva, L. C. Faria and L. C. Melo. 2017.
Genetic, environmental and genotype x environment interaction effects on the common bean grain yield and commercial quality. Semin. Ciências Agrár. 38: 1241-1250.
Pimentel, A. J. B., J. F. R. Guimarães, M. A. de Souza, M. D. V. Resende, L. M. Moura, J. R. R. Carvalho and G. Ribeiro. 2014. Estimation of genetic parameters and prediction of additive genetic value for wheat by mixed models. Pesqui. Agropecu. Bras. 49: 882-890.
Ramalho, M. A. P., L. A. Dias and B. L. Carvalho. 2012. Contributions of plant breeding in Brazil progress and perspectives. Crop Breed. Appl. Biotechnol. S2: 111-120.
Resende, M. D. V. 2016. Software Selegen-REML BLUP : A useful tool for plant breeding. Crop Breed. Appl. Biotechnol. 16: 330-339.
Resende, M. D. V and J. B. Duarte. 2007. Precision and quality control in variety trials. Pesqui. Agropecu. Trop. 37: 182-194. Sousa, C. M., G. A. Gravina, A. P. Viana, R. F. Daher and C. L. Souza.
2017. Selection of snap bean F 2 progenies for production using the REML/BLUP methodology. Hortic. Bras. 35: 33-40.
Team, R. C. 2017. A Language and Environment for Statistical Computing. Vienna, Austria: R Foundation for Statistical Computing. Available from: https://www.r-project.org.
Torres, F. E., P. E. Teodoro, E. Sagrilo, G. Ceccon and A. M. Correa. 2015. Genotype x environment interaction in semiprostrade cowpea genotypes via mixed models. Bragantia. 75: 314-321. Tsutsumi, C. Y., L. G. Bulegon and J. T. Piano. 2015. Common bean
breeding: Advances, prospects and new studies, in national scope. Nativa Pesqui. Agrár. E. Ambientais. 3: 217-223. White, J. W and A. Gonzalez. 1990. Characterization of the negative