Original Research Article
How is silent ‘non-alcoholic fatty liver disease’ epidemic perceived in
India? A community based cross sectional study
Anurag Lavekar
1, Pradeep Tarikere Satyanarayana
2*, Anagha Lavekar
3INTRODUCTION
One of the diseases assuming fast importance because of being a possible precursor of cirrhosis of liver, hepatocellular carcinoma, liver failure, hypertension with insulin resistance or increasing the risk of type 2 diabetes is non-alcoholic fatty liver disease (NAFLD) which is a clinical syndrome characterized by predominant macrovesicular steatosis of the liver.1-3
NAFLD is an umbrella term for a range of liver conditions affecting people who drink little or no alcohol. NAFLD is a growing health issue around the world.4 Among Asian Indians, its well established that insulin resistance and the metabolic syndrome are widely prevalent which are the precursors for NAFLD but data supporting this is scarce.5-7 Among western countries the prevalence of NAFLD in general population is 20–30%.8 The highest rates are reported from South America and the Middle East, followed by Asia, the USA and
ABSTRACT
Background: One of the diseases assuming fast importance is non-alcoholic fatty liver disease (NAFLD) which is a clinical syndrome characterized by predominant macrovesicular steatosis of the liver which is an umbrella term for a range of liver conditions affecting people who drink little or no alcohol. Only mild to moderate elevation of serum transaminases which could be only laboratory abnormality found in NAFLD. So with this background, the study was started with the objectives of assessing the perceptions of general population regarding NAFLD and factors influencing perceptions of general population regarding NAFLD.
Methods: It was a community based cross sectional study carried out for a period of 12 months from January 2018 to December 2018 among in Nanded, Maharashtra. Around 422 households were involved after simple random sampling. To assess perceptions a pretested semi-structured questionnaire was used which had 27 questions. All data collected was entered in Microsoft excel and analysed using SPSS v22.
Results: Out of 422 participants, 147 (34.8%) were in the age group of 31-40 years, 333 (78.9%) were male participants, 179 (42.5%) were graduates, 284 (67.3%) belonged to joint family, 140 (33.2%) belonged to Modified BG Prasad classification 2018. 181 (42.9%) had satisfactory perception regarding NAFLD. Females, participants aged more than 40 years, nuclear family participants had better scores.
Conclusions: The present study showed majority of the participants had little awareness of NAFLD regardless of their age, gender, or educational status. Awareness of NAFLD must be promoted for prevention, early detection, and treatment especially counseling by primary care physicians preponderant influence in preventive strategy for NAFLD breaking the chain of disease progression.
Keywords: NAFLD, Perceptions, Knowledge
1Department of Gastroenterology, 3Department of Obstetrician and Gynecology, Triveni Hospital, Nanded,
Maharashtra, India
2Department of Community Medicine, S.D.U.A.H.E.R., S.D.U.M.C., Kolar, Karnataka, India
Received: 10 October 2019 Accepted: 15 November 2019
*Correspondence:
Dr. Pradeep Tarikere Satyanarayana, E-mail: [email protected]
Copyright: © the author(s), publisher and licensee Medip Academy. This is an open-access article distributed under the terms of the Creative Commons Attribution Non-Commercial License, which permits unrestricted non-commercial use, distribution, and reproduction in any medium, provided the original work is properly cited.
Europe.9 The NAFLD is defined as the presence of hepatic steatosis, with no evidence of hepatocellular injury in the form of ballooning of the hepatocytes or fibrosis determined by either imaging or histology, in the absence of secondary causes of hepatic fat accumulation.10 Over the past three decades, changing lifestyles, urbanization, variation in dietary habits have set proper stage for the obesity and NAFLD epidemic in Asia with India having a startling prevalence of 30%.11 Study done by Mohan et al among urban South Indians showed the prevalence of NAFLD as 32%.12 The diagnosis of NAFLD requires a combination of invasive and non-invasive tests showing mild to moderately elevated serum levels of aspartate amino transferase and alanine aminotransferase or both being the most common findings.13 At times it is only mild to moderate elevation of serum transaminases which could be only laboratory abnormality found in NAFLD but as the condition progresses to cirrhosis only then other abnormalities like increased alkaline phosphatase, g-glutamyl transferase, prolonged prothrombin time, hypoalbuminemia, and hyper-bilirubinemia may be found contributed by ultrasonography of the liver which may demonstrate increased echogenicity of liver parenchyma and cirrhosis. Study done by Lavekar et al using ultrasonography as a diagnostic tool showed a prevalence 28.1%.14
So with this background, the study was started with the objectives of assessing the perceptions of general population regarding NAFLD and factors influencing perceptions of general population regarding NAFLD.
METHODS
The present study was a community based cross sectional study carried out for a period of 12 months from January 2018 to December 2018 among in Nanded, Maharashtra.
Around 422 households were involved after simple random sampling. As there were no such studies carried out regarding the perceptions regarding NAFLD among general public, sample size was calculated assuming 50% do not know about NAFLD, and error of 5% which came around 400. Participants aging more than 18 years were included and those with history of NAFLD or any family members having NAFLD were excluded from the study. Regarding sociodemographic profile pretested semi-structured questionnaire was used. To assess perceptions a pretested semi-structured questionnaire was used which had 27 questions. Each question would get one mark on right answer and an arbitrary of 15 was used as cutoff. Participants scoring more than 15 were considered having satisfactory perceptions and those less than 15 not satisfactory. Data was collected by interview technique. All data collected was entered in Microsoft excel and analysed using SPSS v22 (IBM corp). The results were expressed in the terms of percentages and frequencies, the association was tested using chi-square test and statistically significant difference between various groups was tested using student t test and ANOVA. Statistically significant was defined when p value was less than 0.05.
RESULTS
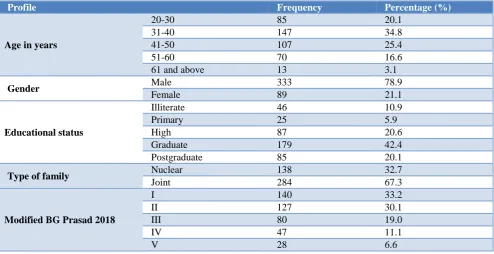
Table 1 shows that out of 422 participants, 147 (34.8%) were in the age group of 31-40 years followed by 107 (25.4%) who belonged to 41-50 years, Around 333 (78.9%) were male participants, 179 (42.5%) were graduates, 284 (67.3%) belonged to joint family. Out of 422 participants, 140 (33.2%) belonged to Modified BG Prasad classification 2018.15 Around 74 (17.5%) had history of hypertension, around 20 (4.7%) had history of dyslipidemia and around 199 (47.2%) had BMI more than 25 classified using WHO Asian classification.16
Table 1: Distribution of study participants according to socio-demographic profile.
Profile Frequency Percentage (%)
Age in years
20-30 85 20.1
31-40 147 34.8
41-50 107 25.4
51-60 70 16.6
61 and above 13 3.1
Gender Male 333 78.9
Female 89 21.1
Educational status
Illiterate 46 10.9
Primary 25 5.9
High 87 20.6
Graduate 179 42.4
Postgraduate 85 20.1
Type of family Nuclear 138 32.7
Joint 284 67.3
Modified BG Prasad 2018
I 140 33.2
II 127 30.1
III 80 19.0
IV 47 11.1
V 28 6.6
Profile Frequency Percentage (%)
History of hypertension Yes 74 17.5
No 348 82.5
History of dyslipidemia Yes 20 4.7
No 402 95.3
BMI
Less than 18.5 17 4.0
18.5-22.9 137 32.5
23-24.9 69 16.4
More than 25 199 47.2
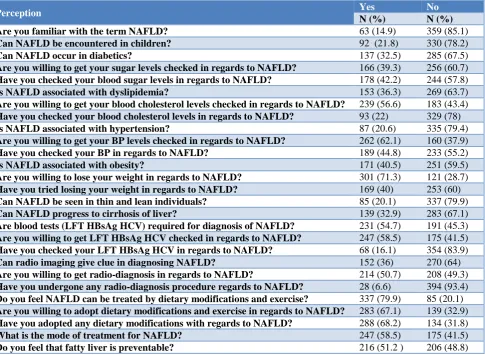
Table 2: Perceptions regarding NAFLD among study participants.
Perception Yes No
N (%) N (%) Are you familiar with the term NAFLD? 63 (14.9) 359 (85.1) Can NAFLD be encountered in children? 92 (21.8) 330 (78.2) Can NAFLD occur in diabetics? 137 (32.5) 285 (67.5) Are you willing to get your sugar levels checked in regards to NAFLD? 166 (39.3) 256 (60.7) Have you checked your blood sugar levels in regards to NAFLD? 178 (42.2) 244 (57.8) Is NAFLD associated with dyslipidemia? 153 (36.3) 269 (63.7) Are you willing to get your blood cholesterol levels checked in regards to NAFLD? 239 (56.6) 183 (43.4) Have you checked your blood cholesterol levels in regards to NAFLD? 93 (22) 329 (78) Is NAFLD associated with hypertension? 87 (20.6) 335 (79.4) Are you willing to get your BP levels checked in regards to NAFLD? 262 (62.1) 160 (37.9) Have you checked your BP in regards to NAFLD? 189 (44.8) 233 (55.2) Is NAFLD associated with obesity? 171 (40.5) 251 (59.5) Are you willing to lose your weight in regards to NAFLD? 301 (71.3) 121 (28.7) Have you tried losing your weight in regards to NAFLD? 169 (40) 253 (60) Can NAFLD be seen in thin and lean individuals? 85 (20.1) 337 (79.9) Can NAFLD progress to cirrhosis of liver? 139 (32.9) 283 (67.1) Are blood tests (LFT HBsAg HCV) required for diagnosis of NAFLD? 231 (54.7) 191 (45.3) Are you willing to get LFT HBsAg HCV checked in regards to NAFLD? 247 (58.5) 175 (41.5) Have you checked your LFT HBsAg HCV in regards to NAFLD? 68 (16.1) 354 (83.9) Can radio imaging give clue in diagnosing NAFLD? 152 (36) 270 (64) Are you willing to get radio-diagnosis in regards to NAFLD? 214 (50.7) 208 (49.3) Have you undergone any radio-diagnosis procedure regards to NAFLD? 28 (6.6) 394 (93.4) Do you feel NAFLD can be treated by dietary modifications and exercise? 337 (79.9) 85 (20.1) Are you willing to adopt dietary modifications and exercise in regards to NAFLD? 283 (67.1) 139 (32.9) Have you adopted any dietary modifications with regards to NAFLD? 288 (68.2) 134 (31.8) What is the mode of treatment for NAFLD? 247 (58.5) 175 (41.5) Do you feel that fatty liver is preventable? 216 (51.2 ) 206 (48.8)
Table 3: Perception of study participants regarding NAFLD (n=422).
Frequency Percentage (%)
Perception Satisfactory 181 42.9
Not satisfactory 241 57.1
Table 2 shows the perceptions regarding NAFLD among study participants. Among 422 participants, 181 (42.9%) had satisfactory perception regarding NAFLD (Table 3).
Table 4 shows that 50.9% of study participants who belonged to age group of 41-50 years had satisfactory perception and this association between age and perception was statistically significant. 67.4% of study participants who were females had better perception
Table 4: Association between demographic profile and perceptions regarding NAFLD.
Variable Perception Total P value
Satisfactory Not satisfactory
Age in years
20-30 24 (28.2) 61 (71.8) 85
0.017 31-40 61 (41.5) 86 (58.5) 147
41-50 55 (50.9) 53 (49.1) 108 51-60 34 (50.0) 34 (50.0) 68 61 and above 7 (50.0) 7 (50.0) 14 Total 181 (42.9) 241 (57.1) 422
BMI (kg/m2)
less than 18.5 6 (35.3) 11 (64.7) 17
0.51 18.5-22.9 59 (43.1) 78 (56.9) 137
23-24.9 25 (36.2) 44 (63.8) 69 More than 25 91 (45.7) 108 (54.3) 199 Total 181 (42.9) 241 (57.1) 422
Gender
Male 121 (36.3) 212 (63.7) 333
0.001 Female 60 (67.4) 29(32.6) 89
Total 181 (42.9) 241 (57.1) 422
Type of family
Nuclear 74 (53.6) 64 (46.4) 138
0.001 Joint 107 (37.7) 177 (62.3) 284
Total 181 (42.9) 241 (57.1) 422
H/o
hypertension?
Yes 55 (74.3) 19 (25.7) 74
0.001
No 126 (36.2) 222 (63.8) 348
Total 181 (42.9) 241 (57.1) 422
H/o
dyslipidemic?
Yes 17 (85.0) 3 (15.0) 20
001
No 164 (40.8) 238 (59.2) 402
Total 181 (42.9) 241 (57.1) 422
Education status
Illiterate 11 (23.9) 35 (76.1) 46
0.001 Primary 3 (12.0) 22 (88.0) 25
High school 31 (35.6) 56 (64.4) 87 Graduates 88 (49.2) 91 (50.8) 179 Postgraduates 48 (56.5) 37 (43.5) 85 Total 181 (42.9%) 241 (57.1) 422
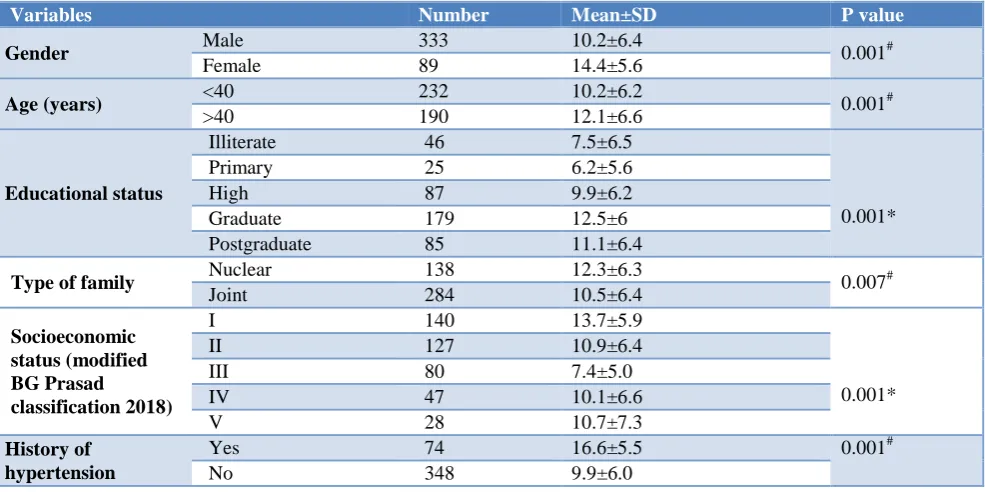
Table 5: Comparison of scores between various groups.
Variables Number Mean±SD P value
Gender Male 333 10.2±6.4 0.001#
Female 89 14.4±5.6
Age (years) <40 232 10.2±6.2 0.001#
>40 190 12.1±6.6
Educational status
Illiterate 46 7.5±6.5
0.001*
Primary 25 6.2±5.6
High 87 9.9±6.2
Graduate 179 12.5±6
Postgraduate 85 11.1±6.4
Type of family Nuclear 138 12.3±6.3 0.007#
Joint 284 10.5±6.4
Socioeconomic status (modified BG Prasad
classification 2018)
I 140 13.7±5.9
0.001*
II 127 10.9±6.4
III 80 7.4±5.0
IV 47 10.1±6.6
V 28 10.7±7.3
History of hypertension
Yes 74 16.6±5.5 0.001#
No 348 9.9±6.0
Variables Number Mean±SD P value
History of dyslipidemia
Yes 20 18.4±4.8
0.001#
No 402 10.7±6.3
BMI (kg/m2)
<18.5 17 9.1±6.7
0.59* 18.5-22.9 137 11.0±6.3
23-24.9 69 10.3±6.0
>25 199 11.1±6.4
*ANOVA, # Independent T test.
Females had better scores compared with males, participants aged more than 40 years had better scores compared with aged less than 40 years, participants of Nuclear family had better scores compared with that of Joint family, participants with history of hypertension and dyslipidemia had higher scores and this difference was statistically significant. Graduate participants and class I participants according to modified BG Prasad classification 2018 had better scores and this difference was statistically significant (Table 5).
DISCUSSION
The present study being a cross sectional study carried among urban study participants for a period of one year where participants were interviewed based on household visits using a pretested semi-structured questionnaire showed 147 (34.8%) were in the age group of 31-40 years, 333 (78.9%) were male participants, 179 (42.5%) were graduates, 284 (67.3%) belonged to joint family, 140 (33.2%) belonged to Modified BG Prasad classification 2018. Around 74 (17.5%) had history of Hypertension, around 20 (4.7%) had history of dyslipidemia and around 199 (47.2%) had BMI more than 25 classified using WHO Asian classification. Among 422 participants, 181 (42.9%) had satisfactory perception regarding NAFLD. Study done by Ghevariya et al in USA to assess the awareness of NAFLD and its risk factors in the general population with the survey questionnaire which had components like awareness of fatty liver, predisposing factors of NAFLD, awareness of cirrhosis, conditions that advance to cirrhosis, awareness of prevention, diagnostic methods and treatment of NAFLD and education of physicians to their patients about NAFLD showed extremely poor awareness regarding NAFLD.17 Study done by Leung et al using a structured questionnaire that consisted of 16 multiple choice questions assessing the respondents’ understanding, perception and concerns about NAFLD as well as questions exploring their general socio-demographics revealed an inadequate knowledge of NAFLD among the general population in Hong Kong.18 Study done by Weiland et al to assess awareness of NAFLD as a disease entity among individuals with and without metabolic risk factors in an outpatient clinical setting showed substantial lack of recognition or awareness of NAFLD among patients, even among high metabolic risk patients.19 Study done by Zhang et al showed low awareness of NAFLD among office employees in Beijing.20 NAFLD being considered iceberg
disease it’s important to implement tools for public education in creating the behaviour change communication to bring out awareness among general public. Behaviour change communication is vital for increasing the enactment of particular behaviours known to promote health and growth and mass media can be a tipping point.21,22 Strengths of study being household interview technique among study participants and limitations were few like a relatively small sample size and smaller cohort. A multi-centric study would be better in generalizability of the data.
CONCLUSION
The present study showed around 57% had poor knowledge regarding NAFLD. The perceptions of the general population toward NAFLD are low. Majority of the participants had little awareness of NAFLD regardless of their age, gender, or educational status. Awareness of NAFLD must be promoted for prevention, early detection, and treatment especially counselling by primary care physicians preponderant influence in preventive strategy for NAFLD breaking the chain of disease progression. Strategies to improve awareness of NAFLD and avoid risk factors among people should be a priority for individual person.
Funding: No funding sources Conflict of interest: None declared
Ethical approval: The study was approved by the Institutional Ethics Committee
REFERENCES
1. Singh SP, Nayak S, Swain M, Rout N, Mallik RN, Agrawal O, et al. Prevalence of nonalcoholic fatty liver disease in coastal eastern India: a preliminary ultrasonographic survey. Tropical Gastroenterology: official J Digest Dis Foundation. 2004;25(2):76-9. 2. Singh S, Kuftinec GN, Sarkar S. Non-alcoholic fatty
liver disease in South Asians: a review of the literature. J ClinTransl Hepatol. 2017;5(1):76. 3. Byrne CD, Targher G. NAFLD: a multisystem
disease. J Hepatol. 2015;62(1):47-64.
4. Zhu JZ, Dai YN, Wang YM, Zhou QY, Yu CH, Li YM. Prevalence of nonalcoholic fatty liver disease and economy. Digestive diseases and sciences. 2015;60(11):3194-202.
liver disease: An Asian Indian perspective. Diabetes Metab Syndr: Clin Res Rev. 2007;1(4):279-85. 6. Praveenraj P, Gomes RM, Kumar S, Karthikeyan P,
Shankar A, Parthasarathi R, et al. Prevalence and predictors of non-alcoholic fatty liver disease in morbidly obese south Indian patients undergoing bariatric surgery. Obesity Surg. 2015;25(11):2078-87.
7. Duseja A, Das A, Das R, Dhiman RK, Chawla Y, Bhansali A, et al. The clinicopathological profile of Indian patients with nonalcoholic fatty liver disease (NAFLD) is different from that in the West. Digest Dis Sci. 2007;52(9):2368-74.
8. Bellentani S, Scaglioni F, Marino M, Bedogni G. Epidemiology of non-alcoholic fatty liver disease. Digest Dis. 2010;28(1):155-61.
9. Younossi Z, Anstee QM, Marietti M, Hardy T, Henry L, Eslam M, et al. Global burden of NAFLD and NASH: trends, predictions, risk factors and prevention. Nature Rev Gastroenterol Hepatol. 2018;15(1):11.
10. Duseja A, Chalasani N. Epidemiology and risk factors of nonalcoholic fatty liver disease (NAFLD). Hepatol Int. 2013;7(2):755-64.
11. Majumdar A, Misra P, Sharma S, Kant S, Krishnan A, Pandav CS. Prevalence of nonalcoholic fatty liver disease in an adult population in a rural community of Haryana, India. Indian J Public health. 2016;60(1):26.
12. Mohan V, Farooq S, Deepa M, Ravikumar R, Pitchumoni C. Prevalence of non-alcoholic fatty liver disease in urban south Indians in relation to different grades of glucose intolerance and metabolic syndrome. Diabetes Res Clin Prac. 2009;84(1):84-91.
13. Juneja A. Non-alcoholic fatty liver disease (NAFLD)—the hepatic component of metabolic syndrome. JAPI. 2009;57:201.
14. Anurag L, Aniket S, Shalik J, Amarja L, Dhananjay R, Sachin J. Non-alcoholic fatty liver disease prevalence and associated risk factors–A study from rural sector of Maharashtra. Trop Gastroenterol. 2015;36(1):25-30.
15. Pandey VK, Aggarwal P, Kakkar R. Modified BG Prasads Socio-economic Classification-2018: The need of an update in the present scenario. Indian J Community Health. 2018;30(1):82-4.
16. Lim JU, Lee JH, Kim JS, Hwang YI, Kim TH, Lim SY, et al. Comparison of World Health Organization and Asia-Pacific body mass index classifications in COPD patients. Int J Chronic Obstruc Pulmonary Dis. 2017;12:2465.
17. Ghevariya V, Sandar N, Patel K, Ghevariya N, Shah R, Aron J, et al. Knowing what’s out there: awareness of non-alcoholic fatty liver disease. Frontiers Med. 2014;1:4.
18. Leung CM, Lai LS, Wong WH, Chan KH, Luk YW, Lai JY, et al. Non‐alcoholic fatty liver disease: An expanding problem with low levels of awareness in Hong Kong. J Gastroenterol Hepatol. 2009;24(11):1786-90.
19. Wieland AC, Mettler P, McDermott MT, Crane LA, Cicutto LC, Bambha KM. Low awareness of nonalcoholic fatty liver disease among patients at high metabolic risk. J Clinical Gastroenterol. 2015;49(1):6-10.
20. Zhang W, Chao S, Chen S, Rao H, Huang R, Wei L, et al. Awareness and Knowledge of Nonalcoholic Fatty Liver Disease Among Office Employees in Beijing, China. Digest Dis Sci. 2019;64(3):708-17. 21. Briscoe C, Aboud F. Behaviour change
communication targeting four health behaviours in developing countries: a review of change techniques. Soc Sci Med. 2012;75(4):612-21. 22. Wakefield MA, Loken B, Hornik RC. Use of mass
media campaigns to change health behaviour. Lancet. 2010;376(9748):1261-71.