Original Research Article
Assessment of magnitude of physical activity among rural high school
children of Nelamangala taluk, Bengaluru: a cross sectional study
Nandish Kumar S., Jyothi Jadhav*, Ranganath T. S., Vishwanatha
INTRODUCTION
WHO defines physical activity as any bodily movement produced by skeletal muscles that requires energy expenditure including activities undertaken while working, playing, carrying out household chores, travelling, and engaging in recreational pursuits.1 Intensity of physical activity refers to the rate at which the activity is being performed or the magnitude of the effort required to perform an activity or exercise. The intensity of different forms of physical activity varies
between people based on their individual previous exercise experience and their relative level of fitness.2 There are two intensities of physical activity- moderate and vigorous. Moderate intensity physical activity requires moderate amount of effort and noticeably accelerates the heart rate. Vigorous intensity of physical activity requires a large amount of effort and causes rapid breathing and a substantial increase in heart rate.2 WHO recommends at least 60 minutes of moderate to vigorous-intensity physical activity daily for children and adolescents aged 5-17 years.3
ABSTRACT
Background: In India, more than two thirds of adolescents aged 11-17 years have insufficient physical activity. Though data on prevalence of physical activity among adolescents with reference to WHO criteria are available, very few studies have assessed the magnitude of physical activity. Hence, the study was conducted to assess the magnitude of physical activity among rural high school children of Nelamangala Taluk, Bengaluru.
Methods: A cross sectional study was conducted among 200 high school students from 6 co-education schools. Magnitude of physical activity was assessed using physical activity questionnaire for adolescents (PAQ-A), a self-reported, validated questionnaire.
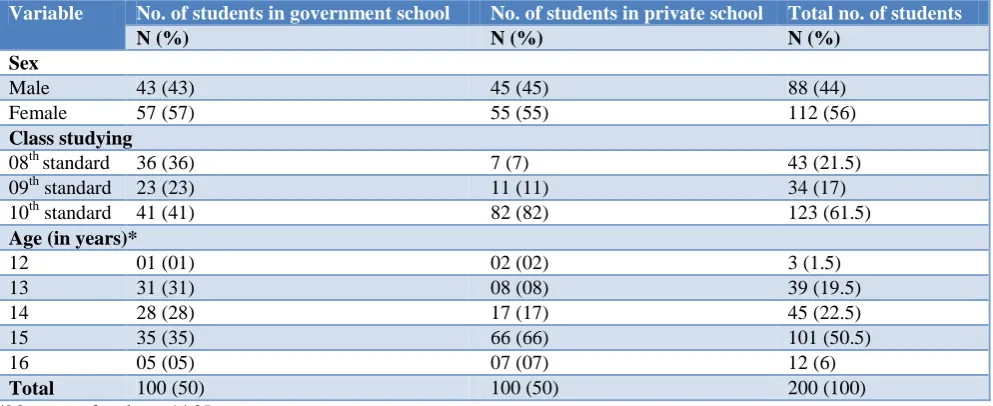
Results: Mean age of the study participants was 14.35 years. 112 (56%) of them were female and 123 (61.5%) of them were studying in 10th standard. 100 (50%) of them were from government or aided school. Final Physical activity score of study participants was 2.39±0.64. There was a statistically significant difference (p<0.05) in the final physical activity score between males and females. Government or aided school participants had a better final score than those of private school and the difference was statistically significant. Final physical activity score decreased with their promotion to higher class. There was no significant difference between activity levels during physical education class across variables like sex, class studying and type of school.
Conclusions: Physical activity was better among males, government school participants and those studying in lower class in comparison to their counterparts. Majority of this difference can be attributed to activities happening beyond the school hours.
Keywords: Physical activity, Adolescent, Rural, School, PAQ-A
Department ofCommunity Medicine, Bangalore Medical College and Research Institute, Bangalore, Karnataka, India
Received: 20 September 2019
Accepted: 11 November 2019
*Correspondence:
Dr. Jyothi Jadhav,
E-mail: [email protected]
Copyright: © the author(s), publisher and licensee Medip Academy. This is an open-access article distributed under the terms of the Creative Commons Attribution Non-Commercial License, which permits unrestricted non-commercial use, distribution, and reproduction in any medium, provided the original work is properly cited.
Regular and adequate levels of physical activity improve muscular fitness, cardio-respiratory fitness, bone health and functional health. It also reduces the risk of hypertension, coronary heart disease, stroke, diabetes, various types of cancer (including breast cancer and colon cancer), depression, risk of falls as well as hip or vertebral fractures; and are fundamental to energy balance and weight control.3 Beyond exercise, any other physical activity that is done during leisure time, for travelling from one place to another places, or as part of a person’s work, has a health benefit.4
Inadequate physical activity is the 4th leading risk factor for global mortality with estimated 3.2 million deaths.5 Inadequate levels of physical activity increases the risk of cancer, heart disease, stroke, and diabetes by 20-30% and shortens lifespan by 3-5 years.6 Globally, 81% of adolescents aged 11-17 years had insufficient physical activity in 2010. Adolescent girls were less active than adolescent boys, with 84% vs. 78% not meeting WHO recommendation respectively.3 In India, prevalence of insufficient physical activity among adolescents aged 11-17 years was 71.6% and 69.6% among girls and boys respectively.7 Even though data on prevalence of physical activity among adolescents with reference to WHO criteria are available, very few studies have assessed the magnitude of physical activity. Also, for comparison across factors affecting physical activity, continuous data in the form of physical activity scores is better than prevalence data which is categorical. Hence, this study was taken up to assess the magnitude of physical activity using physical activity questionnaire-adolescents (PAQ-A).
METHODS
A cross sectional study was conducted in the high schools of Nelamangala Taluk of Bengaluru District during the time period of July to October 2017. Institutional ethical clearance was obtained from ethical committee of Bangalore Medical College and Research Institute (BMCRI). Permission was sought from block education officer of Nelamangala Taluk to conduct the study and list of all the high schools in Nelamangala was also collected. According to study done by Dave et al in Gujarat, mean±SD physical activity score for rural high school children was 2.62±0.72.8 With 95% confidence and relative precision (d) of 5%, calculated sample size was 121. Considering 30% incomplete/wrong response rate, the minimum sample size calculated was 173 which was rounded off to 200.
Out of the 57 high schools in Nelamangala Taluk, 30 schools were government or aided and 27 were unaided schools. 3 government or aided and 3 unaided coeducation schools were chosen using computer generated random numbers (using MS Excel). Permission was sought from Headmaster/mistress of the schools to conduct the study. Assent was taken from the children and consent was taken from parents of all children to conduct the study. Among the students who were present
on the day of data collection, stratified random sampling method was adopted to select the participants for the study. Participants who were mentally and physically challenged (which may limit their abilities to involve in routine physical activity or respond to questionnaire administered) were excluded from the study after interacting with the class teachers.
Data was collected using PAQ-A, a self-reported, structured, validated questionnaire having 8 items designed to measure general moderate to vigorous physical activity levels during a typical week in school year. The first question provides a physical activity checklist including over twenty different kinds of sport and exercise activities asking the students how many times they did each of them in the past seven days. The next five questions examine their activity level in different school settings at certain periods in the last seven days (physical education class, lunch, immediately after school, evening, weekends). The seventh question requires the students to summarize their general activity levels among five different statements. The last one asks students to report their frequency in physical activities for each day of the previous week.9
Each of the 8 questions is scored on a 5-point scale. The values are averaged to create a composite score with a higher value indicative of a higher activity level. Strength of the PAQ is that it quantifies a general physical activity level for a whole week rather than trying to estimate overall frequency, intensity and duration with detailed questions. PAQ also provides specific information about activity levels at different periods of the day (e.g., lunch, physical education class, evening etc).10 The questionnaire was translated into Kannada (local language) and was validated linguistically. Each class was visited by the data collection team (2 data collectors) who distributed the questionnaires to the children and gave an introduction of what was expected from them and instructions on how to fill the questionnaire. Any doubts students had while filling the questionnaire were addressed by data collectors.
Data collected was checked for completeness prior to entering into Excel sheet. Continuous variables were expressed as mean±SD. Categorical variables were expressed as count (%). Using SPSS v20.0 software, statistical tests like student t test, ANOVA were applied to find relation between physical activity scores and variables like age, sex, type of school as and when necessary. A p value ≤0.05 was considered to be statistically significant.
RESULTS
Table 1: Socio-demographicprofile of students.
Variable No. of students in government school No. of students in private school Total no. of students
N (%) N (%) N (%)
Sex
Male 43 (43) 45 (45) 88 (44)
Female 57 (57) 55 (55) 112 (56)
Class studying
08th standard 36 (36) 7 (7) 43 (21.5)
09th standard 23 (23) 11 (11) 34 (17)
10th standard 41 (41) 82 (82) 123 (61.5)
Age (in years)*
12 01 (01) 02 (02) 3 (1.5)
13 31 (31) 08 (08) 39 (19.5)
14 28 (28) 17 (17) 45 (22.5)
15 35 (35) 66 (66) 101 (50.5)
16 05 (05) 07 (07) 12 (6)
Total 100 (50) 100 (50) 200 (100)
*Mean age of students=14.35 years.
Table 2: Association of physical activity levels in physical education class with sex, class and type of school studying.
Variable Physical education class score (mean±SD) P value
Sex
Male 3.81±1.37
0.80*
Female 3.76±1.25
Class studying
08th standard 3.77±1.39
0.99** 09th standard 3.79±1.25
10th standard 3.78±1.30
Type of school studying
Government or aided 3.60±1.36
0.051*
Private 3.96±1.22
*: Student t test, **: ANOVA.
Table 3: Association of final physical activity score with sex, type of school studying and class studying.
Variable Final physical activity score (mean±SD) P value
Sex
Male 2.51±0.71
0.02*
Female 2.29±0.65
Type of school
Government 2.63±0.69
<0.001*
Private 2.14±0.60
Class studying
8th 2.60±0.66
0.02**
9th 2.47±0.89
10th 2.26±0.81
*: Student t test, **: ANOVA.
Final physical activity score of study participants was 2.39±0.64. There was no statistically significant difference in physical activity during physical education class across sex, class and type of school studying variables (Table 2). There was a statistically significant difference in the final physical activity score between male and female study participants (Table 3).
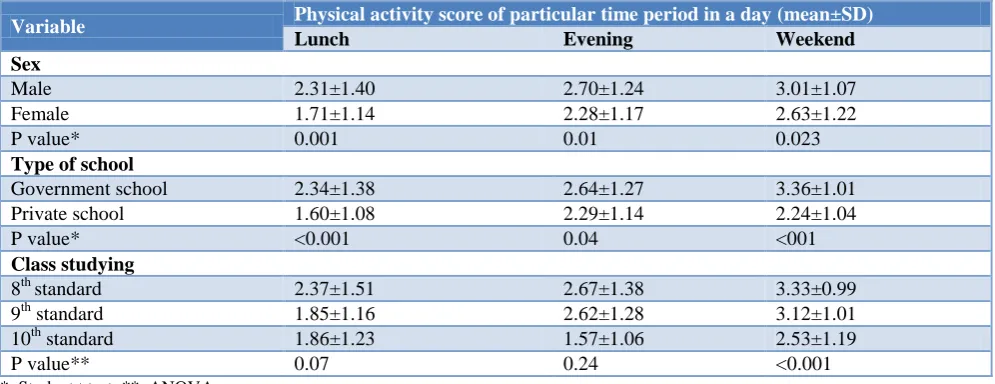
Table 4: Association of physical activity during various timeperiods in a day with sex, class and type of school studying.
Variable Physical activity score of particular time period in a day (mean±SD)
Lunch Evening Weekend
Sex
Male 2.31±1.40 2.70±1.24 3.01±1.07
Female 1.71±1.14 2.28±1.17 2.63±1.22
P value* 0.001 0.01 0.023
Type of school
Government school 2.34±1.38 2.64±1.27 3.36±1.01
Private school 1.60±1.08 2.29±1.14 2.24±1.04
P value* <0.001 0.04 <001
Class studying
8th standard 2.37±1.51 2.67±1.38 3.33±0.99
9th standard 1.85±1.16 2.62±1.28 3.12±1.01
10th standard 1.86±1.23 1.57±1.06 2.53±1.19
P value** 0.07 0.24 <0.001
*: Student t test, **: ANOVA.
As described in Table 4, there was a significant difference in the physical activity levels during lunch break, evening and weekend period across sex and type of school studying variables. With respect to variable of class studying, there was a significant difference only in the physical activity level during weekend.
Of the 200 study participants, 31 (15.5%) reported reasons which prevented them from doing their regular physical activity. Among the 31 who reported reasons, 18 (58%) of them quoted they were sick. Other reasons given were menstruation [08 (25.8%)] and social reasons [05 (16.2%)] like went for family functions, trip etc.
DISCUSSION
This study was done to assess magnitude of physical activity level of adolescents using PAQ-A questionnaire. In our study, final physical activity score was 2.39±0.64 which was similar to studies done by Kundapur et al, in Mangalore, Dave et al in Gujarat.8, 11
There was no difference in physical activity levels during physical education class across variables-sex, type of school and class studying, which may be because of regulations for schools to reserve a minimum period of time for physical education class.
There was a significant difference in physical activity levels between male and female study participants. These findings were in accordance with studies conducted by Kundapur et al in Mangaluru, Guthold et al, Divyasree et al in Puducherry and Esht et al in Punjab.11-14 The gender difference may be because parents or family members of a female adolescent discourage them to play outside with fear of harm, bullying or teasing etc. Also, female adolescents may find it difficult to get involved in moderate to vigorous physical activity being in the first
week of menstrual cycle as seen in studies done by Finne et al.15
Study participants of government or aided and private schools had a statistically significant difference in physical activity levels during times other than the physical education class. This may be because a greater number of private school children travel to school by bus or other vehicles and they have better access to use of electronic gadgets at family level which takes up part of their free time in evening and weekend. Also, some of the government school children from poor families may be going for part time jobs or help their parents in household chores or work which add up to the total physical activity in a day.
There was an inversely proportional relation between class studying and physical activity level which was also found in study done by Esht et al in Punjab.14 This may be attributed to, that students of higher classes often attend coaching classes or tuitions outside the school or special classes may be arranged within the school in the evening and during weekends because of academic pressure. Also, parents of children studying in higher class may insist their children to study because of public exam.
CONCLUSION
In this study, we found that better physical activity levels were seen in males, government school participants and those studying in lower class in comparison to their counterparts. Majority of this difference is attributed to activities happening beyond the school hours. So, interventions to promote physical activity should focus at community level and encourage gender equality.
ACKNOWLEDGEMENTS
Sincere thanks to the Block education officer of Nelamangala, management of the schools, all the children and their parents who gave their consent for participation in the study. We also thank all the staff and postgraduates of Department of Community medicine of BMCRI for providing various inputs in designing the study.
Funding: No funding sources Conflict of interest: None declared
Ethical approval: The study was approved by the Institutional Ethics Committee
REFERENCES
1. WHO. Physical Activity, 2017. Available at: https://www.who.int/dietphysicalactivity/pa/en/. Accessed on 24 June 2019.
2. WHO. What is Moderate-intensity and Vigorous-intensity Physical Activity?, 2014. Available at: https://www.who.int/dietphysicalactivity/physical_a ctivity_intensity/en/. Accessed on 24 June 2019. 3. WHO. Key facts: Physical activity, 2018. Available
at: https://www.who.int/news-room/fact-sheets/ detail/physical-activity. Accessed on 24 June 2019. 4. WHO. Physical activity, 2019. Available at:
https://www.who.int/health-topics/physical-activity#tab=overview. Accessed on 24 June 2019 5. World Health Organization. Physical activity.
SEARO. World Health Organization, South-East Asia Regional Office, 2018. Available at: http://www.searo.who.int/topics/physical_activity/e n/. Accessed on 24 June 2019
6. WHO. Non-communicable diseases and their risk factors. Physical activity, 2018. Available at: https://www.who.int/ncds/prevention/physical-activity/introduction/en/. Accessed on 24 June 2019. 7. WHO. Prevalence of insufficient physical activity, 2019. Available at: https://www.who.int/gho/ncd /risk_factors/physical_activity_text/en/. Accessed on 24 June 2019
8. Dave H, Nimbalkar SM, Vasa R, Phatak AG. Assessment of physical activity among adolescents: a cross-sectional study. J Clin Diagnostic Res. 2017;11(11):21-4.
9. Kowalski K, Crocker P, Donen R. Introduction. The Physical Activity Questionnaire for Older Children (PAQ-C) and Adolescents (PAQ-A) Manual. 2004: 01-03.
10. Crocker P, Bailey DA, Faulkner RA, Kowalski KC, McGrath R. Measuring general levels of physical activity. Med Sci Sports Exercise. 1997;29(10):1344-9.
11. Kundapur R, Baisil S. Assessment of difference in physical activities in urban and rural adolescents of Mangalore. Indian J Community Health. 2017;29(1):75-80.
12. Guthold R, Cowan MJ, Autenrieth CS, Kann L, Riley LM. Physical activity and sedentary behavior among school children: a 34-country comparison. J Pediatr. 2010;157(1):43-9.
13. Divyasree P, Kumar GD, Subitha L, Ramesh RS. Level, motivation and barriers to participate in physical activity among late adolescents in Puducherry. Int J Adolesc Med Health. 2018:05:1-8. 14. Esht V, Midha D, Chatterjee S, Sharma S. A preliminary report on physical activity patterns among children aged 8–14 years to predict risk of cardiovascular diseases in Malwa region of Punjab. Indian Heart J. 2018;70(6):777-82.
15. Finne E, Bucksch J, Lampert T, Kolip P. Age, puberty, body dissatisfaction, and physical activity decline in adolescents. Results of the German Health Interview and Examination Survey (KiGGS). Int J Behav Nutr Phys Act. 2011;8:1-14.
16. Janz KF, Lutuchy EM, Wenthe P, Levy SM. Measuring activity in children and adolescents using self-report: PAQ-C and PAQ-A. Med Sci Sports Exerc. 2008;40(4):767-72.
17. Bai Y. Measuring general activity levels in children and adolescents using self-report: youth activity profile [dissertation]. Iowa State University; 2012: 34-36.