608 | 2019 | ISSUE 3 | VOLUME 14 © 2019 University of Alicante
Methodological validation of a vertical ladder with low intensity
shock stimulus for resistance training in C57BL/6 mice: Effects on
muscle mass and strength, body composition, and lactate plasma
levels
VINÍCIUS DIAS RODRIGUES1,3, DANIEL DE MORAES PIMENTEL1,3, ANDRÉIA DE SOUZA BRITO1,
MAGDA MENDES VIEIRA1, AMANDA RODRIGUES SANTOS1, AMANDA SOUTO MACHADO1, LORRANE
KATHERINE MARTINS PEREIRA1, FERNANDA SANTOS SOARES1, EMISAEL STÊNIO BATISTA
GOMES1, MARIANA ROCHA ALVES2, LUDMILLA REGINA DE SOUZA1, RICARDO CARDOSO
CASSILHAS4, RENATO SOBRAL MONTEIRO JÚNIOR1,3, ALFREDO MAURÍCIO BATISTA DE-PAULA1,5
1Post-graduate Programme in Health Sciences, State University of Montes Claros (Unimontes), Brazil 2Post-graduate Programme in Neurosciences, Federal University Fluminense (UFF), Brazil
3Department of Physical Education and Sport, State University of Montes Claros (Unimontes), Brazil 4Department of Physical Education, Federal University of Vales do Jequitinhonha e Mucuri (UFVJM), Brazil 5Department of Dentistry, State University of Montes Claros (Unimontes), Brazil
ABSTRACT
The objective of this study was to evaluate the effects of a vertical ladder device for resistance exercises with or without electrical shock stimulus on muscle strength, body composition, limb volume, muscle fibres and plasma lactate and glycemia of female mice. This device is represented by a vertical ladder with electrostimulation. It was analysed in groups of C57BL/6 mice practicing spontaneous physical activity in enriched environment, practicing resisted climbing exercises, practicing resistance exercises with the utility model in question and controls. The acute effects of blood lactate and dark light-box behaviour, and the short-term chronic effects of muscle strength, limb volume, body composition, muscle fibre area, and central and light-dark quantification were verified. According to the findings, the vertical electrostimulation ladder model presented acute effects on lactate levels, similar to other experimental models of resistance exercise and physical activity. The behaviour in the light-dark box test showed no difference between the groups. Regarding the short-term chronic response, the best results were obtained in the impact-stimulated resistive exercise in the limb traction muscle variables, greater brown adipose tissue weight, greater quadriceps
1Corresponding author. Programa de Pós-graduação em Ciências da Saúde. Sala 7. Hospital Universitário Clemente de Faria,
Universidade Estadual de Montes Claros. Avenida Cula Mangabeira, 562. Bairro Santo Expedito. Montes Claros, Minas Gerais, CEP: 39401-001. Brazil.
E-mail: [email protected]
Submitted for publication September 2018 Accepted for publication October 2018
Published September 2019 (in press November 2018) JOURNAL OF HUMAN SPORT & EXERCISE ISSN 1988-5202 © Faculty of Education. University of Alicante
VOLUME 14 | ISSUE 3 | 2019 | 609
femoral muscle structure, limb and greater weight number of nuclei in the skeletal striated muscle fibres. The use of the prototype showed similarities in the acute and chronic adaptations expected in resistance training. However, new study proposals should be encouraged, as the data presented here are the first notes on the use of this utility model. Keywords: Resistance exercise; Physical exercise; Rodents; Shock; Climbing.
Cite this article as:
610 | 2019 | ISSUE 3 | VOLUME 14 © 2019 University of Alicante
INTRODUCTION
Resistance exercise, also known as strength exercise, is characterized by the use of equipment or free weights that offer a mechanical load opposite to the movement of the body segment, provoking neural and/or hypertrophic muscular adaptations in the individual (Haff & Triplett, 2015; Kenney, Wilmore, & Costill, 2015; Magbanua et al., 2014; Medicine, 2002; Schnyder & Handschin, 2015). The resistance exercise programs aimed at enhancing the trainable physiological characteristics such as muscular strength, muscular hypertrophy, muscular power and muscular endurance (Haff & Triplett, 2015; Hornberger Jr & Farrar, 2004). The maintenance time of the tension, the speed of execution of the movement, the type of accumulative metabolic, among other situations, are possibilities of the variability of stimuli that promote structural and functional adaptations in the corporal system (Haff & Triplett, 2015; Hornberger Jr & Farrar, 2004; Medicine, 2002).
The improvement of muscle strength primarily uses the anaerobic non lactic and/or lactic energy system (Haff & Triplett, 2015). In this energetic system, neural and hypertrophic muscular adaptations occur mainly in skeletal muscle fibres of fast contraction (fibre type II) recruited (Medicine, 2002; Ratamess, Alvar, & Evetoch, 2009). Skeletal muscle fibres of slow contraction (type I fibre) are most used in aerobic exercises that primarily use oxidative metabolism (Soltow et al., 2006). Neural adaptations are characterized by increased muscle strength, improved intermuscular and intramuscular coordination (Medicine, 2002; Spiering et al., 2008). The muscular hypertrophic adaptations are structural or morphological adaptations that occur due to the increase in the density and volume of muscle fibres (myofibrillar hypertrophy) or the increase of structures and components that will increase the efficiency of muscle fibres contraction (sarcoplasmic hypertrophy) (Hornberger Jr & Farrar, 2004; Spiering et al., 2008).
In rodents, resistance training methodologies include climbing (11), isometric training (Krüger et al., 2013), voluntary climbing (Mori et al., 2003), burrowing (Roemers et al., 2017) and shock-stimulated jumping exercises (Nuzzo, 2014), and the results achieved are quite similar to those that are demonstrated in a training study in humans. However, the literature presents some shortcomings related to exercise efficiency in mimicking the findings that occur in the human model; the prescription of protocol; and the apparatuses that can be used in the experimental models to achieve even more similar results with what occurs in humans.
Thus, in an attempt to promote greater efficiency in the physiological results provoked by experimental resistance exercise, a device for resistance training was developed that represented by a suitable vertical ladder with electric shock stimulus. Such a device possibly causes extensive muscle recruitment of the four rodent members. In the present study, the objective of this study was to evaluate the effects of a vertical ladder device for resistance exercise with or without electric shock stimulation on a muscle strength, body composition, limb volume, muscle fibres and plasma lactate and glucose levels of female mouse.
MATERIAL AND METHODS Type of study and ethical aspects
VOLUME 14 | ISSUE 3 | 2019 | 611 Vertical ladder apparatus
The equipment that was submitted to methodological validation has a design similar to that of a typical vertical ladder to perform resistance exercises for rats (R. Cassilhas et al., 2012; Cassilhas et al., 2013). This apparatus contain grid, feeding chamber, resting chamber, support column, horizontal ladder base, electric stimulator, grid of electrical stimulation chamber, electric stimulation chamber, lateral restraint, vertical base, 43 steps, passage between ladder and resting chamber and electrical stimulation panel. The prototype has 1129 millimetres of the height of the ladder, 1348 millimetres total height, with the base of 300 millimetres wide, with 43 steps of the width of 0.02 millimetres and with a slope of 80 degrees. In addition, it has lateral contentions characterized by 125 mm of height, by 1129 mm of length. The operation of the electric stimulation chamber is performed by a panel of 150 millimetres in height, 288 millimetres in length (with a 30º inclination), 190 millimetres in width, with a round switch of 20 millimetres in diameter and 27.5 millimetres depth switch on and off the electrical stimulator, with two switch buttons 10 mm in diameter and 15 mm in length for intensity and frequency respectively, with a DC\AC inverter circuit, with integrated circuit 555 base, where it can generate 60 Volts AC . The resting chamber is 219 millimetres high, 200 millimetres long, by 295 millimetres wide (Figure 1a and 1b- Supplementary Material).
Animals care
One hundred and fifty-five healthy female C57BL/6 mice, aged 10 to 12 weeks, with about 20 ± 5 grams of body weight. These animals were purchased from the Department of Biochemistry and Molecular
Pharmacology of “Instituto de Ciências Biológicas (ICB) da Universidade Federal de Minas Gerais (UFMG)’’ and were kept in the “Centro de Ciências Biológicas e da Saúde da Universidade Estadual de Montes Claros (Unimontes)’’. The mice were submitted to an initial adaptation period (10 days, adequate conditions of ambient temperature (22 ± 2ºC, relative humidity of 60 ± 5%, 12h of light / dark cycles and low sound level) <40 dB, with free access to filtered water and balanced feed (Purina-Labina®) containing 50.3% of carbohydrates, 41.9% of proteins and 7.8% of fat with a total of 2.18 kcal per 1g of feed. The animals were housed in groups of 3 to 5 animals in boxes of autoclavable polypropylene of dimensions of 414 x 344 x 168 mm, with a lid in galvanized steel and containing stainless steel separators (Zootech, model ZT 375. All boxes were lined with shavings, which were changed three times a week, and the animals consumed daily were weighed using an analytical balance (Bonther®, Ribeirão Preto, Brazil) daily. Ingested water was also measured at regular time intervals.
Groups of animals
612 | 2019 | ISSUE 3 | VOLUME 14 © 2019 University of Alicante exercise with shock. In order to avoid compromising the experimental protocols, two moments of familiarization of the animals were performed in advance of each procedure. The research team performed pilot procedures for technical calibration.
Acute effects of RE, REE, SPA and controls on lactate levels
To evaluate the acute effects promoted by the protocols, 20 animals were randomly assigned to REE (n = 5), RE (n = 5), SPA (n = 5) and control (n = 5). The sessions took place in the afternoon. Before and immediately after the session, peripheral blood samples obtained by puncturing the caudal end of each animal were collected and placed in test strips for lactate quantification (BM-Lactate®, Roche, Rio de Janeiro, Brazil). These test strips containing the blood samples were then introduced into the portable lactate analyser (BM-Lactate®, Roche, Rio de Janeiro, Brazil) (Terra, Alves, Gonçalves da Silva, Salerno, & Dutra, 2012). A vessel was used to mobilize the animals (Figure S3).
Evaluation of the chronic effects of RE, REE and SPA on muscle strength
The grip strength tests of the front and back limbs performed in a grip strength meter (Bonther®, Ribeirão Preto, Brazil). The animals were pulled horizontally by the tail until the grip on the bar was broken. This traction occurred at a constant speed and slow enough to allow the animal to try to increase resistance against the dynamometer (Figure S4). The obtained value of muscle strength was then recorded. This procedure was performed 3 times with intervals of 90 seconds between each measurement. The assessment of muscle strength was performed initially for the front limbs and later for the muscular strength obtained with all limbs (De Luca et al., 2008; Takeshita et al., 2017; Velázquez et al., 2014).
It is important to emphasize that the reliability of the muscle strength test was verified, our results showed that the measurement of the muscular strength obtained in the groups of animals evaluated was considered reliable (CI = 0.807) for the evaluation of the muscular tensile strength by the front members ; and (IC = 0.917) to evaluate the tensile strength for all members (Tables S1 and S2, respectively - Supplementary Material) (Portney & Watkins, 2000; Shrout & Fleiss, 1979).
Twenty animals were randomly assigned into 4 groups: REE (n = 5), RE (n = 5), SPA (n = 5) and control (n = 5). The animals were submitted to 10 sessions at 48-hour intervals between sessions. The tensile strength was measured as previously described in groups of animals, 48 hours before the first session and 48 hours after the last session. All sessions were held in the afternoon.
Evaluation of the chronic effects of RE, REE, and SPA on limb volume and body composition In order to evaluate the short-term chronic effects of RE, REE and SPA on right hind limb volume and body composition of the animals, 12 animals were randomly assigned to 4 groups: REE (n = 3), RE (n = 3), SPA (n = 3) and control (n = 3). The animals were submitted to 10 sessions at 48-hour intervals between sessions. The volume of the right hind limb was measured 48 hours before the first session and 48 hours after the last session. The evaluation of right hind limb volume was performed using ultrasound equipment (G & E Voluson P8 4D) with linear transducer 12L-RS (Frequency: 4.2 – 13.0 MHz). The scanning of the member volume occurred in the network interface (Ethernet) where it enabled documentation in DICOM standard. Prior to this procedure, the animals were anesthetized with ketamine/ xylazine (75 mg/kg and 5 mg/kg body weight, respectively) (Close et al., 1996; Foster, Pavlin, Harasiewicz, Christopher, & Turnbull, 2000; Honors & Kinzig, 2014).
VOLUME 14 | ISSUE 3 | 2019 | 613
(Close et al., 1996; Foster et al., 2000; Honors & Kinzig, 2014) to perform the collection of skeletal muscle tissues of the quadriceps, visceral white adipose, and adipose brown scapular. The collected tissues were weighed using an analytical precision digital scale (A. Cientifica EEQ9003E) (Hansen, Han, Nolte, Chen, & Holloszy, 1997; Honors & Kinzig, 2014).
In the ultrasound evaluation the reliability was verified, our results showed that this analysis was reliable (CI = 0.856) (Tables S3 - Supplementary Material) (Portney & Watkins, 2000; Shrout & Fleiss, 1979).
Area of skeletal muscle fibres and quantification of nuclei
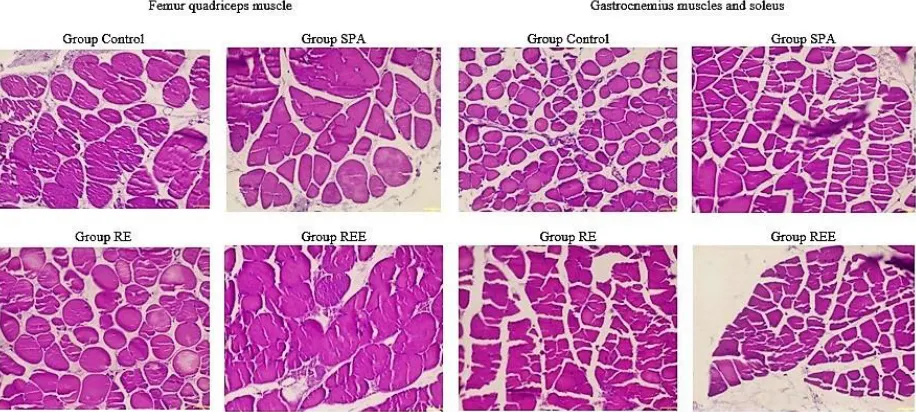
Skeletal muscle structure features a “cable-within-a-cable” structure, in which individual muscle fibres are aligned in parallel with the length of the tissue and are unsheathed by extracellular matrix proteins. A section of skeletal muscles anterior tibialis and gastrocnemius was cut at 90o to the longitudinal axis. Sections were
then examined and photographed using an Olympus BX50 microscope (Olympus Optical). Muscle fibre cross-sectional areas of muscles were determined using Image J software (Scion, Frederick, MD). The greatest distance between the opposite sides of the narrowest aspect of the fibre was chosen (Pallafacchina, Calabria, Serrano, Kalhovde, & Schiaffino, 2002). Measurement of skeletal muscle fibres was performed at least three muscles per group and three distinct randomly chosen fields of each muscle cross section. All data are expressed as the mean ± S.D.
Assessment of the acute and chronic effects of RE, REE and SPA in the exploration of the light-dark box
With the objective of evaluating the acute and chronic effects of RE, REE and SPA in the exploration of the light-dark box. The test consisted of a 5 minute session, the animals were allowed to explore a new environment composed of two different compartments: protected (dark) and unprotected (illuminated) (Campos, Fogaca, Aguiar, & Guimaraes, 2013). They were randomly distributed into 4 groups: REE (n = 3), RE (n = 3), SPA (n = 3) and control (n = 3). The first experiment (acute effect) occurred immediately after the treatment proposal. The second experiment (short-term chronic effect) occurred before and after 5 sessions (at 24-hour intervals between sessions) of the treatment proposal.
Statistical analysis
All data collected were scanned into an electronic database. Subsequently, the data were analysed statistically in the SPSS software (Statistical Package for the Social Sciences) 20.0. All data are presented as means and standard deviations. The confidence level adopted in all analyses was set at 95% (p <0.05). The Shapiro-Wilk test were performed to verify normality. After such analysis, paired Student's t-test, independent Student's t-test, Kruskal-Wallis test, the Wilcoxon test, the ANOVA test and the effect size were performed using the Hopkins classification (2009) (Hopkins, Marshall, Batterham, & Hanin, 2009; Nuzzo, 2014).
RESULTS
Acute effects of resistance exercise and spontaneous physical activity on lactate levels
614 | 2019 | ISSUE 3 | VOLUME 14 © 2019 University of Alicante Short-term chronic effect on muscle strength obtained in the REE group was significantly better than those obtained in the SPA, RE and control groups
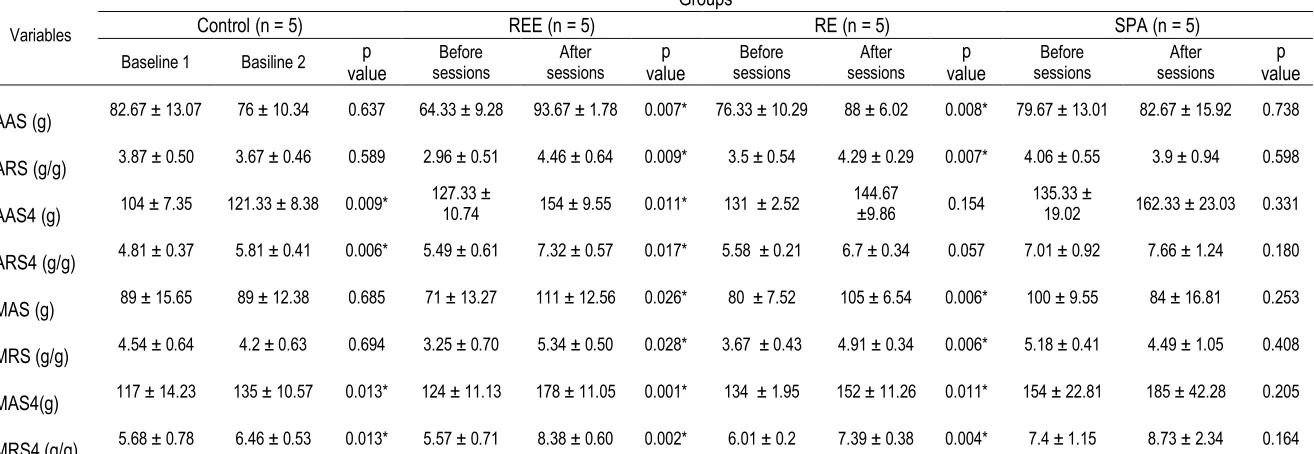
Only the REE mice showed a significant increase in all muscle strength variables investigated in the present study: average absolute muscle strength of the anterior limbs (AAS), average relative muscle strength of the anterior limbs (ARS), average absolute muscle strength of all limbs (AAS4), average relative muscle strength of all members (ARS4), maximum absolute muscle strength of the anterior limbs (MAS), maximum relative muscle strength of the anterior limbs (MRS), maximum absolute muscle strength of the anterior limbs MAS4), and the maximum relative muscle strength of all limbs (MRS4) (p <0.05). The animals of the RE group did not present significant differences only for the AAS4 and ARS4 muscle strength variables (p> 0.05). The animals that performed SPA had no significant difference for any form of muscle strength measurement (p> 0.05). In animals in the control group, a significant increase of AAS4, ARS4, MAS4, and MRS4 occurred (p> 0.05). In Table 2 the situation described above can be visualized.
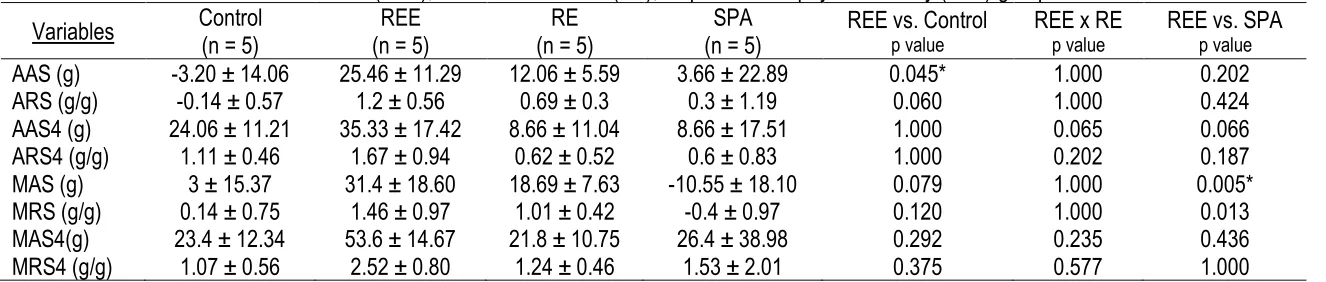
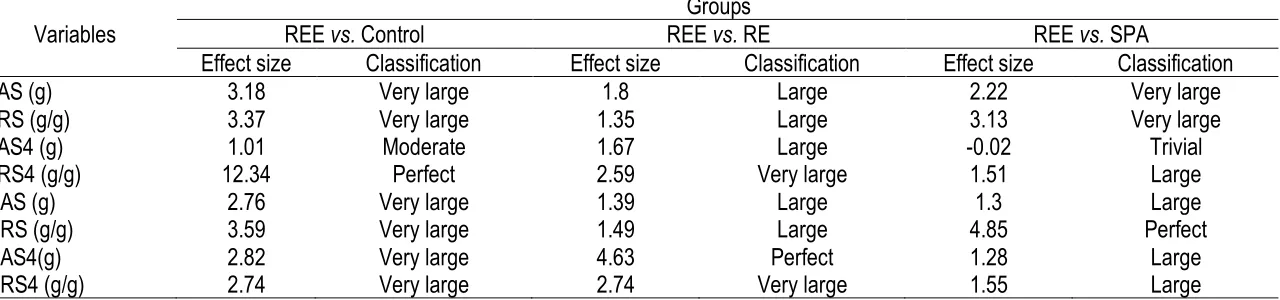
Additionally, when delta values were compared between groups, animals from the REE group showed a significant difference with animals from the control group for the AAS variable (p = 0.045) and animals from the SPA group for the MAS variable (p = 0.005) (Table 3). Due to the small number of animal samples in each group investigated in this study, the size of the effect was processed, all variables presented a large classification (> 1.0), except in the variable AAS4 between SPA and REE that was identified as trivial ( -0.02) (Table S4 - Supplementary material).
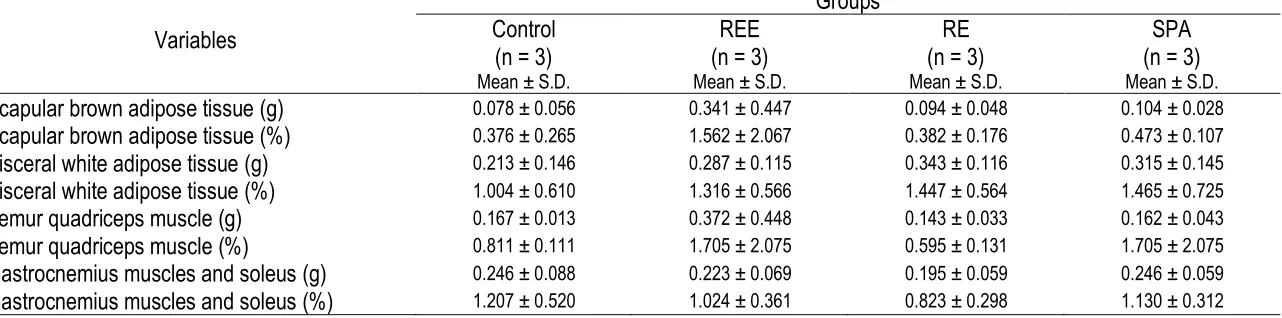
Short-term chronic effect of REE did not promote an increase in the weight of brown adipose scapular tissue and femoral quadriceps muscle in C57BL/6 mice compared to values obtained with the animals in SPA, RE, and control
Animals submitted to REE showed a greater measurement of the total and percentage weights of the adipose brown scapular tissue and the quadriceps femoris muscle (Table 5). However, when compared to data from the other groups of animals investigated, no statistically significant difference was identified.
The short-term chronic effects of REE promote an increase in the volume of the right hind limb in C57BL/6 mice
Animals submitted to REE presented a greater increase in right back limb volume (Table 4), the results were significant (p = 0.012) when compared to moments before and after an intervention. However, when comparing the delta values with the data obtained from the other groups of animals investigated, no statistically significant difference (p < 0.05) was identified. However, the size of the effect showed interesting results (Table S5 - Supplementary Material), where it showed between REE vs. Control, REE vs. RE, and REE vs. SPA was respectively classified as perfect (4.29), small (0.27) and almost large (1.02).
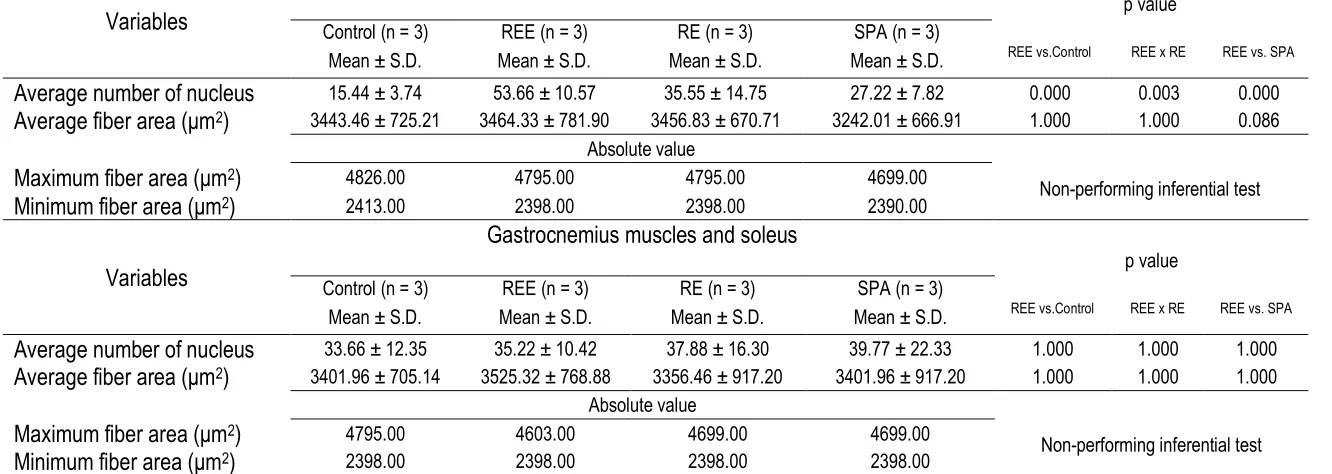
Short-term chronic effect of REE promoted a significant increase of nuclei in the muscle fibres in C57BL/6 mice compared to the values obtained with the animals in SPA, RE, and control
There was no significant difference (Table 6) between the muscle fibre area (μm2) of the control, SPA, RE
and REE animals. However, the number of nuclei in the skeletal muscle fibre in REE was significantly higher when compared to SPA (p = 0.000), RE (p = 0.003) and Control (p = 0.000).
The acute and chronic short-term effects in the REE animals on the light-dark box did not show significant differences when compared to the animals of the SPA, RE and controls
VOLUME 14 | ISSUE 3 | 2019 | 615
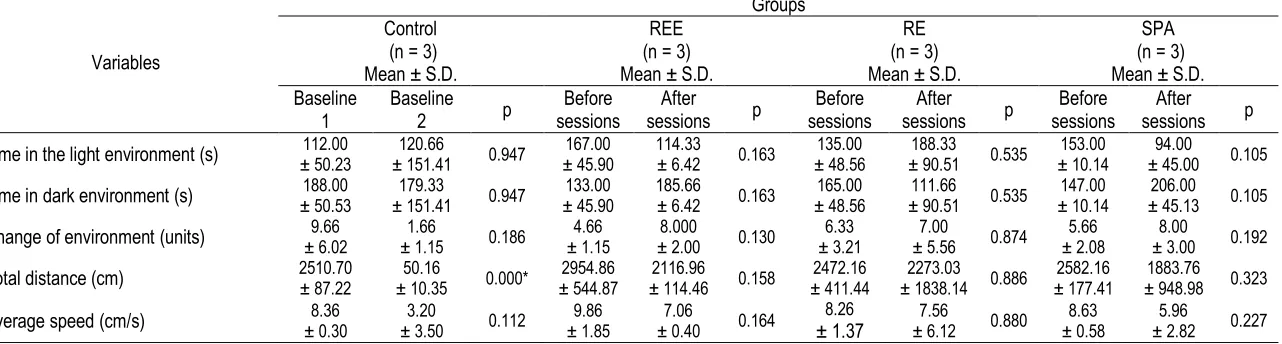
Checking the acute effect (table 7) of the interventions, no statistically significant difference was identified (p> 0.05). Regarding the short-term chronic effect, no statistically significant difference (p> 0.05) was found in the delta values (table S6) between the groups. Analysing the moments (table 8) in each group, there was a significant difference (p = 0.000) in the variable total distance (cm) of the control group, where it presented a decrease between baseline 1 (2510.70 ± 87.22) for baseline 2 (50.16 ± 10.35).
DISCUSSION
The presented prototype study showed important results for future scientific interventions when compare resistance exercise protocols with or without electric stimulation with spontaneous physical activity in an enriched environment. This utility model showed similarities in the production of blood lactate with RE and SPA, decrease in blood glucose, greater increase of muscle strength and in all variables analysed the greater weight of quadriceps femoris and adipose scapular brown tissue.
Lactate is produced in anaerobiosis, a result of low tissue perfusion (hypoxia), it is an organic compound (by-product) derived from carbohydrate metabolism, its increase triggers the use of the bioenergetic system known as lactic anaerobic (Brooks, 1991; Spiering et al., 2008). In this study, it was observed that immediately after the exercise session the significant increase of the blood lactate in the REE, RE and SPA groups occurred. The highest increase occurred in RE and values close to REE, showing the characterization of the training of these studies has a predominantly lactic anaerobic specification, a fact that helps to describe resistance exercise with the goal of muscular hypertrophy, muscular power and/or muscular strength (Medicine, 2002; Ratamess et al., 2009). Corroborating with the findings, a study examining several resistance exercise methods for humans aimed at increasing muscle strength and hypertrophy, found significant increases in blood lactate (Gentil et al., 2006). Another study reinforces the specificity of our research, using 24 male Wistar rats, the animals were distributed in 4 groups: untrained, resistance training, hypertrophy training and strength training. The proposal lasted 12 weeks, moments of acute analysis of blood lactate levels, our variable of interest, the results of this immediate effect showed that blood lactate increased in the experimental groups, this increase is lower after the 12-week chronic adaptation (Scheffer et al., 2012).
616 | 2019 | ISSUE 3 | VOLUME 14 © 2019 University of Alicante After the neural adaptation, the process of hypertrophy becomes more evident, in the results of the body composition the quadriceps femoral muscle and the brown adipose tissue present higher absolute and percentage weights in the animals of the REE group, except in the comparison with the SPA that had the same percentage of brown adipose tissue. The femoral quadriceps has the agonist function in the movement (leg extension) related to REE and RE (Dyce, Sack, & Wensing, 2009; Dyce, Wensing, & Sack, 2004; König & Liebich, 2016; Netter, 2008). However, two findings draw attention to the REE. The first finding is the largest significant increase in right back limb volume found, consistently the second finding is the highest number of nuclei in the muscle fibre in these REE animals. These results show that the potential of the hypertrophic adaptations in the REE methodological proposal is positive indicators of the model presented here. The increase in the number of nuclei is related to the satellite cells, in the face of the appropriate stimulus, they proliferate and fuse with the muscle fibres or with themselves, this is one of the situations that provide muscular hypertrophy (Kadi & Thornell, 2000). It is important to note that the duration of the experiments were three weeks with a total of 10 sessions, the significant hypertrophic adaptations in humans, usually occur between 8 to 12 weeks of resistance training (Medicine, 2002; Ratamess et al., 2009; Spiering et al., 2008; Zatsiorsky & Kraemer, 2006). Such comparisons with the scientific literature reinforce the results found here but show a potential for the advancement of new studies with longer duration.
Regarding the brown adipose tissue that presented higher values in REE but without significant difference, this tissue is important for thermogenic response and energetic balance in the organic system, its action contributes to avoiding obesity (Klingenspor et al., 2017). The results may be related to the training format, but it is not possible to state since the findings are a cross-sectional characterization performed at the end of the study. In this aspect, we have a limitation, but a research potential is shown since the presented values go according to the effects of the exercise in these variables of the body composition of the animals (De Matteis et al., 2013; Medicine, 2002; Ratamess et al., 2009; Spiering et al., 2008; Stanford, Middelbeek, & Goodyear, 2015).
Activity and physical exercise, in general, are important non-pharmacological strategies for the prevention of behavioural disorders (Fulk et al., 2004). However, considering the new methodological strategy proposed in this study, we are concerned about the possibility of behavioural changes, a fact that may directly implicate the aggravation of several other health conditions (Campos et al., 2013). The results of the acute effects show that there is no difference in behaviour in the different interventions proposed. It is reported that the acute effects of physical exercise can cause for several hours the decrease in anxiety levels (Raglin & Wilson, 1996). Anxiolytic drugs, for example, showed the same test (light-dark test), more time spent in the lighted environment and a greater number of transitions between the two areas (Crawley, Marangos, Paul, Skolnick, & Goodwin, 1981), and a fact related to our findings (table 7). Higher values of transitions and in the light environment occurred in animals submitted to REE, RE, and SPA.
Regarding the descriptive data related to the chronic short-term effect (Table 8 and Table S6), there were no significant changes in the analysed variables of the animals submitted to REE, RE and SPA, showing that the implication of the activity and the physical exercise, in particular the resistance training did not have negative impact, revealing the possible maintenance of the behavioural variables (Morgan, 1985), even with interventions that involve physiological changes affecting the organism to the stable state.
VOLUME 14 | ISSUE 3 | 2019 | 617 FINAL CONSIDERATIONS AND CONCLUSIONS
This research presented important results on the use of the vertical ladder device for resistance exercise with or without electrical shock stimulation, since the findings show that GER presented similarities in the acute and chronic adaptations expected for the resistance training. The data presented here are the first notes of the use of this utility model. The methodology presented here offers promising perspectives in research related to skeletal muscle structure, leading to propositions related to physical fitness related to health and/or performance.
CONFLICT OF INTEREST
The authors declare that there is no conflict of interest that could influence the impartiality of the research reported.
ACKNOWLEDGEMENTS
We would like to thank the Foundation for Research Support of the Minas Gerais State (FAPEMIG; grant numbers: PPM-00029-17 and DEG-00010-16); National Council for Scientific and Technological Development (CNPq, grant number: 150038/2017-8 and 430759/2016-9); and the Coordination of Improvement of Higher Education Personnel (CAPES) for the support to carry out this study. AMB De-Paula is research productivity fellow of the CNPq.
REFERENCES
Brooks, G. A. (1991). Current concepts in lactate exchange. Medicine and science in sports and exercise, 23(8), 895-906. https://doi.org/10.1249/00005768-199108000-00003
Campos, A. C., Fogaca, M. V., Aguiar, D. C., & Guimaraes, F. S. (2013). Animal models of anxiety disorders and stress. Revista brasileira de psiquiatria, 35, S101-S111. https://doi.org/10.1590/1516-4446-2013-1139
Cassilhas, R., Lee, K., Fernandes, J., Oliveira, M., Tufik, S., Meeusen, R., & De Mello, M. (2012). Spatial memory is improved by aerobic and resistance exercise through divergent molecular mechanisms. Neuroscience, 202, 309-317. https://doi.org/10.1016/j.neuroscience.2011.11.029
Cassilhas, R. C., Lee, K. S., Venancio, D. P., Oliveira, M. G. M. d., Tufik, S., & Mello, M. T. d. (2012). Resistance exercise improves hippocampus-dependent memory. Brazilian Journal of Medical and Biological Research, 45(12), 1215-1220. https://doi.org/10.1590/S0100-879X2012007500138
Cassilhas, R. C., Reis, I. T., Venâncio, D., Fernandes, J., Tufik, S., & Mello, M. T. d. (2013). Animal model for progressive resistance exercise: a detailed description of model and its implications for basic research in exercise. Motriz: Revista de Educação Física, 19(1), 178-184.
https://doi.org/10.1590/S1980-65742013000100018
Close, B., Banister, K., Baumans, V., Bernoth, E.-M., Bromage, N., Bunyan, J., . . . Hackbarth, H. (1996). Recommendations for euthanasia of experimental animals: Part 1. Laboratory Animals, 30(4), 293-316. https://doi.org/10.1258/002367796780739871
Coletti, D., Aulino, P., Pigna, E., Barteri, F., Moresi, V., Annibali, D., . . . Berardi, E. (2016). Spontaneous physical activity downregulates pax7 in cancer cachexia. Stem cells international, 2016.
618 | 2019 | ISSUE 3 | VOLUME 14 © 2019 University of Alicante Crawley, J. N., Marangos, P. J., Paul, S. M., Skolnick, P., & Goodwin, F. K. (1981). Interaction between
purine and benzodiazepine: Inosine reverses diazepam-induced stimulation of mouse exploratory behavior. Science, 211(4483), 725-727. https://doi.org/10.1126/science.6256859
De Luca, A., Tinsley, J., Aartsma-Rus, A., van Putten, M., Nagaraju, K., de La Porte, S., . . . Carlson, G. (2008). Use of grip strength meter to assess the limb strength of mdx mice. SOP DMD_M, 2(001). De Matteis, R., Lucertini, F., Guescini, M., Polidori, E., Zeppa, S., Stocchi, V., . . . Cuppini, R. (2013).
Exercise as a new physiological stimulus for brown adipose tissue activity. Nutrition, metabolism and cardiovascular diseases, 23(6), 582-590. https://doi.org/10.1016/j.numecd.2012.01.013
Dyce, K. M., Sack, W. O., & Wensing, C. J. G. (2009). Textbook of Veterinary Anatomy-E-Book: Elsevier Health Sciences.
Dyce, K. M., Wensing, C., & Sack, W. (2004). Tratado de anatomia veterinária: Elsevier Brasil.
Foster, F. S., Pavlin, C. J., Harasiewicz, K. A., Christopher, D. A., & Turnbull, D. H. (2000). Advances in ultrasound biomicroscopy. Ultrasound in medicine & biology, 26(1), 1-27.
https://doi.org/10.1016/S0301-5629(99)00096-4
Fulk, L., Stock, H., Lynn, A., Marshall, J., Wilson, M., & Hand, G. (2004). Chronic physical exercise reduces anxiety-like behavior in rats. International journal of sports medicine, 25(01), 78-82.
https://doi.org/10.1055/s-2003-45235
Gentil, P., Oliveira, E., Fontana, K., Molina, G., Oliveira, R. J. d., & Bottaro, M. (2006). Efeitos agudos de vários métodos de treinamento de força no lactato sanguíneo e características de cargas em homens treinados recreacionalmente. Rev bras med esporte, 12(6), 303-307.
https://doi.org/10.1590/S1517-86922006000600001
Haff, G., & Triplett, N. T. (2015). Essentials of strength training and conditioning.
Hansen, P. A., Han, D. H., Nolte, L. A., Chen, M., & Holloszy, J. O. (1997). DHEA protects against visceral obesity and muscle insulin resistance in rats fed a high-fat diet. American Journal of
Physiology-Regulatory, Integrative and Comparative Physiology, 273(5), R1704-R1708.
https://doi.org/10.1152/ajpregu.1997.273.5.R1704
Honors, M. A., & Kinzig, K. P. (2014). Chronic exendin-4 treatment prevents the development of cancer cachexia symptoms in male rats bearing the Yoshida sarcoma. Hormones and Cancer, 5(1), 33-41.
https://doi.org/10.1007/s12672-013-0163-9
Hopkins, W., Marshall, S., Batterham, A., & Hanin, J. (2009). Progressive statistics for studies in sports medicine and exercise science. Medicine+ Science in Sports+ Exercise, 41(1), 3.
https://doi.org/10.1249/MSS.0b013e31818cb278
Hornberger Jr, T. A., & Farrar, R. P. (2004). Physiological hypertrophy of the FHL muscle following 8 weeks of progressive resistance exercise in the rat. Canadian journal of applied physiology, 29(1), 16-31. https://doi.org/10.1139/h04-002
Hutchinson, E., Avery, A., & VandeWoude, S. (2005). Environmental enrichment for laboratory rodents. ILAR journal, 46(2), 148-161. https://doi.org/10.1093/ilar.46.2.148
Kadi, F., & Thornell, L.-E. (2000). Concomitant increases in myonuclear and satellite cell content in female trapezius muscle following strength training. Histochemistry and Cell Biology, 113(2), 99-103.
https://doi.org/10.1007/s004180050012
Kenney, W. L., Wilmore, J., & Costill, D. (2015). Physiology of Sport and Exercise 6th Edition: Human kinetics.
VOLUME 14 | ISSUE 3 | 2019 | 619
Krüger, K., Gessner, D. K., Seimetz, M., Banisch, J., Ringseis, R., Eder, K., . . . Mooren, F. C. (2013). Functional and muscular adaptations in an experimental model for isometric strength training in mice. PloS one, 8(11), e79069. https://doi.org/10.1371/journal.pone.0079069
König, H. E., & Liebich, H.-G. (2016). Anatomia dos Animais Domésticos-: Texto e Atlas Colorido: Artmed Editora.
Magbanua, M. J. M., Richman, E. L., Sosa, E. V., Jones, L. W., Simko, J., Shinohara, K., . . . Chan, J. M. (2014). Physical activity and prostate gene expression in men with low-risk prostate cancer. Cancer Causes & Control, 25(4), 515-523. https://doi.org/10.1007/s10552-014-0354-x
Medicine, A. C. o. S. (2002). Progression models in resistance training for healthy adults. Med Sci Spor Exerc, 34, 364-380. https://doi.org/10.1097/00005768-200202000-00027
Morgan, W. P. (1985). Affective beneficence of vigorous physical activity. Medicine & Science in Sports & Exercise. https://doi.org/10.1249/00005768-198502000-00015
Mori, T., Okimoto, N., Sakai, A., Okazaki, Y., Nakura, N., Notomi, T., & Nakamura, T. (2003). Climbing exercise increases bone mass and trabecular bone turnover through transient regulation of marrow osteogenic and osteoclastogenic potentials in mice. Journal of bone and mineral research, 18(11), 2002-2009. https://doi.org/10.1359/jbmr.2003.18.11.2002
Netter, F. H. (2008). Netter-Atlas de anatomia humana: Elsevier Brasil.
Newberry, R. C. (1995). Environmental enrichment: increasing the biological relevance of captive environments. Applied Animal Behaviour Science, 44(2-4), 229-243. https://doi.org/10.1016/0168-1591(95)00616-Z
Nuzzo, R. (2014). Scientific method: statistical errors. Nature News, 506(7487), 150.
https://doi.org/10.1038/506150a
Pallafacchina, G., Calabria, E., Serrano, A. L., Kalhovde, J. M., & Schiaffino, S. (2002). A protein kinase B-dependent and rapamycin-sensitive pathway controls skeletal muscle growth but not fiber type specification. Proceedings of the National Academy of Sciences, 99(14), 9213-9218.
https://doi.org/10.1073/pnas.142166599
Portney, L. G., & Watkins, M. P. (2000). Foundations of clinical research: applications to practice: Prentice Hall.
Raglin, J., & Wilson, M. (1996). State anxiety following 20 minutes of bicycle ergometer exercise at selected intensities. International journal of sports medicine, 17(06), 467-471.
https://doi.org/10.1055/s-2007-972880
Ratamess, N., Alvar, B., & Evetoch, T. (2009). Progression models in resistance training for healthy adults. American college of sports medicine. Med Sci Sports Exerc, 41(3), 687-708.
https://doi.org/10.1249/MSS.0b013e3181915670
Roemers, P., Mazzola, P., De Deyn, P., Bossers, W., van Heuvelen, M., & van der Zee, E. (2017). Burrowing as a Novel Voluntary Strength Training Method for Mice: A Comparison Of Various Voluntary Strength or Resistance Exercise Methods. Journal of Neuroscience Methods.
Scheffer, D. L., Silva, L. A., Tromm, C. B., da Rosa, G. L., Silveira, P. C., de Souza, C. T., . . . Pinho, R. A. (2012). Impact of different resistance training protocols on muscular oxidative stress parameters. Applied Physiology, Nutrition, and Metabolism, 37(6), 1239-1246. https://doi.org/10.1139/h2012-115
Schnyder, S., & Handschin, C. (2015). Skeletal muscle as an endocrine organ: PGC-1α, myokines and
exercise. Bone, 80, 115-125. https://doi.org/10.1016/j.bone.2015.02.008
Shrout, P. E., & Fleiss, J. L. (1979). Intraclass correlations: uses in assessing rater reliability. Psychological bulletin, 86(2), 420. https://doi.org/10.1037/0033-2909.86.2.420
Soltow, Q. A., Betters, J. L., Sellman, J. E., Lira, V. A., Long, J. H., & Criswell, D. S. (2006). Ibuprofen inhibits skeletal muscle hypertrophy in rats. Medicine and science in sports and exercise, 38(5), 840.
620 | 2019 | ISSUE 3 | VOLUME 14 © 2019 University of Alicante Spiering, B. A., Kraemer, W. J., Anderson, J. M., Armstrong, L. E., Nindl, B. C., Volek, J. S., & Maresh,
C. M. (2008). Resistance exercise biology. Sports Medicine, 38(7), 527-540.
https://doi.org/10.2165/00007256-200838070-00001
Stanford, K. I., Middelbeek, R. J., & Goodyear, L. J. (2015). Exercise effects on white adipose tissue: beiging and metabolic adaptations. Diabetes, 64(7), 2361-2368. https://doi.org/10.2337/db15-0227
Takeshita, H., Yamamoto, K., Nozato, S., Inagaki, T., Tsuchimochi, H., Shirai, M., . . . Yokoyama, S. (2017). Modified forelimb grip strength test detects aging-associated physiological decline in skeletal muscle function in male mice. Scientific Reports, 7. https://doi.org/10.1038/srep42323
Terra, R., Alves, P., Gonçalves da Silva, S., Salerno, V., & Dutra, P. (2012). Exercise Improves the Th1 Response by Modulating Cytokine and NO Production in BALB/c Mice. Int J Sports Med, 10, 0032-1329992. https://doi.org/10.1055/s-0032-1329992
Van de Weerd, H. A., Aarsen, E. L., Mulder, A., Kruitwagen, C. L., Hendriksen, C. F., & Baumans, V. (2002). Effects of environmental enrichment for mice: variation in experimental results. Journal of Applied Animal Welfare Science, 5(2), 87-109. https://doi.org/10.1207/S15327604JAWS0502_01
Velázquez, K. T., Enos, R. T., Narsale, A. A., Puppa, M. J., Davis, J. M., Murphy, E. A., & Carson, J. A. (2014). Quercetin supplementation attenuates the progression of cancer cachexia in ApcMin/+ mice. The Journal of nutrition, 144(6), 868-875. https://doi.org/10.3945/jn.113.188367
Zatsiorsky, V. M., & Kraemer, W. J. (2006). Science and practice of strength training: Human Kinetics.
VOLUME 14 | ISSUE 3 | 2019 | 621 ANNEX: FIGURES AND TABLES
622 | 2019 | ISSUE 3 | VOLUME 14 © 2019 University of Alicante circuit base, where it can generate AC voltages of 60 Volts. The resting chamber is 219 millimeters high, 200 millimeters long by 295 millimeters wide.
Figure S2. Enriched environment for the practice of spontaneous physical activity of rodents using a closed plastic box with 60 cm in length, 30 cm in width and 45 cm in height. This environment was composed of seesaw, wheel, balls and tunnels.
Figure S3. Containment of the animal for biochemical evaluation.
VOLUME 14 | ISSUE 3 | 2019 | 623
Figure S5. Cross section of femoral quadriceps muscle and gastrocnemius and soleus muscles of mice from control (n = 3), REE (n = 3), RE (n = 3), and SPA (n = 3) groups, after the interventions.
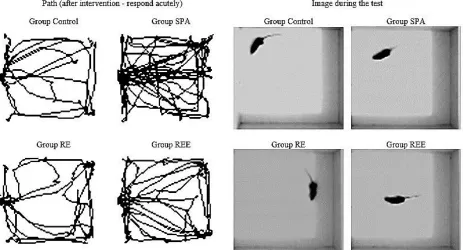
624 | 2019 | ISSUE 3 | VOLUME 14 © 2019 University of Alicante Figure S7. Behavior of the C57BL/6 mouse pathway (acute effect) after resistive exercise with electrical stimulation (REE), resistance exercise without electrical stimulator (ER) and spontaneous physical activity (SPA) and control group.
VOLUME 14 | ISSUE 3 | 2019 | 625
Table 1. Mean and standard deviation values of blood lactate levels before and after the resistance exercise with electrostimulation (RES), resistance exercise without electrical stimulator (RE), and spontaneous physical activity (SPA).
Blood Level
Control
(n = 5) (n = 5) REE (n = 5) RE (n = 5) SPA
Baseline
1 Baseline 2 value(Δ)Delta valuep session Before session After value(Δ)Delta valuep session Before session After value(Δ)Delta valuep session Before session After value(Δ)Delta valuep
Lactate (mmol/L) (mean ± S.D.)
6.90
± 0.47 ± 0.48 6.90 ± 0.08 0.10 0.099 ± 0.16 6.14 ± 0.37 7.26 ± 0.438 0.005* 1.12 ± 0.54 7.28 ± 1.22 9.16 ± 1.26 1.88 0.027* ± 0.44 7.16 ± 0.67 8.18 ± 0.51 1.02 0.011*
*The differences were statistically significant. Means of groups were compared using paired Student's T test. S.D. = standard deviation. REE = the resistance exercise with
electrostimulation. RE = resistance exercise without electrical stimulator. SPA = spontaneous physical activity.
Table 2. Mean and standard deviation values of the various muscle strength variables obtained before and after the use of resistance exercise with electrostimulation (RES), resistance exercise without electrical stimulator (RE), and spontaneous physical activity (SPA), and control.
Variables
Groups
Control (n = 5) REE (n = 5) RE (n = 5) SPA (n = 5)
Baseline 1 Basiline 2 valuep sessions Before sessions After valuep sessions Before sessions After valuep sessions Before sessions After valuep
AAS (g) 82.67 ± 13.07 76 ± 10.34 0.637 64.33 ± 9.28 93.67 ± 1.78 0.007* 76.33 ± 10.29 88 ± 6.02 0.008* 79.67 ± 13.01 82.67 ± 15.92 0.738
ARS (g/g) 3.87 ± 0.50 3.67 ± 0.46 0.589 2.96 ± 0.51 4.46 ± 0.64 0.009* 3.5 ± 0.54 4.29 ± 0.29 0.007* 4.06 ± 0.55 3.9 ± 0.94 0.598
AAS4 (g) 104 ± 7.35 121.33 ± 8.38 0.009* 127.33 ± 10.74 154 ± 9.55 0.011* 131 ± 2.52 144.67 ±9.86 0.154 135.33 ± 19.02 162.33 ± 23.03 0.331
ARS4 (g/g) 4.81 ± 0.37 5.81 ± 0.41 0.006* 5.49 ± 0.61 7.32 ± 0.57 0.017* 5.58 ± 0.21 6.7 ± 0.34 0.057 7.01 ± 0.92 7.66 ± 1.24 0.180
MAS (g) 89 ± 15.65 89 ± 12.38 0.685 71 ± 13.27 111 ± 12.56 0.026* 80 ± 7.52 105 ± 6.54 0.006* 100 ± 9.55 84 ± 16.81 0.253
MRS (g/g) 4.54 ± 0.64 4.2 ± 0.63 0.694 3.25 ± 0.70 5.34 ± 0.50 0.028* 3.67 ± 0.43 4.91 ± 0.34 0.006* 5.18 ± 0.41 4.49 ± 1.05 0.408
MAS4(g) 117 ± 14.23 135 ± 10.57 0.013* 124 ± 11.13 178 ± 11.05 0.001* 134 ± 1.95 152 ± 11.26 0.011* 154 ± 22.81 185 ± 42.28 0.205
626 | 2019 | ISSUE 3 | VOLUME 14 © 2019 University of Alicante
anterior limbs. AAS4 = average absolute muscle strength for all limbs. ARS4 = average relative muscle strength of all limbs. MAS = maximum absolute muscle strength for anterior limbs. MRS = maximum relative muscle strength for anterior limbs. MAS4 = maximum absolute muscle strength for all limbs. MRS4 = maximum relative muscle strength of all limbs.
Table 3. Mean values and delta standard deviation (Δ) for muscle strength assessment before and after short-term chronic response of control, resistance exercise with electrostimulation (RES), resistance exercise (RE), e spontaneous physical activity (SPA) groups.
Variables Control (n = 5) (n = 5) REE (n = 5) RE (n = 5) SPA REE vs. Control p value REE x RE p value REE vs. SPA p value
AAS (g) -3.20 ± 14.06 25.46 ± 11.29 12.06 ± 5.59 3.66 ± 22.89 0.045* 1.000 0.202
ARS (g/g) -0.14 ± 0.57 1.2 ± 0.56 0.69 ± 0.3 0.3 ± 1.19 0.060 1.000 0.424
AAS4 (g) 24.06 ± 11.21 35.33 ± 17.42 8.66 ± 11.04 8.66 ± 17.51 1.000 0.065 0.066
ARS4 (g/g) 1.11 ± 0.46 1.67 ± 0.94 0.62 ± 0.52 0.6 ± 0.83 1.000 0.202 0.187
MAS (g) 3 ± 15.37 31.4 ± 18.60 18.69 ± 7.63 -10.55 ± 18.10 0.079 1.000 0.005*
MRS (g/g) 0.14 ± 0.75 1.46 ± 0.97 1.01 ± 0.42 -0.4 ± 0.97 0.120 1.000 0.013
MAS4(g) 23.4 ± 12.34 53.6 ± 14.67 21.8 ± 10.75 26.4 ± 38.98 0.292 0.235 0.436
MRS4 (g/g) 1.07 ± 0.56 2.52 ± 0.80 1.24 ± 0.46 1.53 ± 2.01 0.375 0.577 1.000
* The differences were statistically significant. Mean and standard deviation (S.D.) bof the group delta values were compared using analysis of variance (ANOVA) Bonferroni setting. = resistance exercise with electrostimulation. RE = resistance exercise without electrical stimulator. SPA = spontaneous physical activity. AAS = average absolute muscle for anterior limbs. ARS = average relative muscle strength for anterior limbs. AAS4 = average absolute muscle strength for all limbs. ARS4 = average relative muscle strength of all limbs. MAS = maximum absolute muscle strength for anterior limbs. MRS = maximum relative muscle strength for anterior limbs. MAS4 = maximum absolute muscle strength for all limbs. MRS4 = maximum relative muscle strength of all limbs.
Table 4. Analysis of back limb volume (mm3) right before and after the training.
Volume of right hind limb (mm3)
Before Training
(Mean ± S.D.) (Mean ± S.D.) After Training p value Delta value
Control (n = 3) 0.58 ± 0.07 0.84 ± 0.06 0.085 0.22 ± 0.14
REE (n = 3) 0.41 ± 0.07 0.97 ± 0.07 0.012 0.60 ± 0.11
RE (n = 3) 0.52 ± 0.14 1.05 ± 0.10 0.061 0.57 ± 0.24
SPA (n = 3) 0.48 ± 0.12 0.94 ± 0.04 0.035 0.52 ± 0.15
VOLUME 14 | ISSUE 3 | 2019 | 627
Table 5. Analysis of components from body composition of C57BL/6 mice from resistance exercise with electrostimulation (RES), resistance exercise without electrical stimulator (RE), and spontaneous physical activity (SPA), and control groups after ten sessions of intervention.
Variables
Groups Control
(n = 3) (n = 3) REE (n = 3) RE (n = 3) SPA
Mean ± S.D. Mean ± S.D. Mean ± S.D. Mean ± S.D.
Scapular brown adipose tissue (g) 0.078 ± 0.056 0.341 ± 0.447 0.094 ± 0.048 0.104 ± 0.028
Scapular brown adipose tissue (%) 0.376 ± 0.265 1.562 ± 2.067 0.382 ± 0.176 0.473 ± 0.107
Visceral white adipose tissue (g) 0.213 ± 0.146 0.287 ± 0.115 0.343 ± 0.116 0.315 ± 0.145
Visceral white adipose tissue (%) 1.004 ± 0.610 1.316 ± 0.566 1.447 ± 0.564 1.465 ± 0.725
Femur quadriceps muscle (g) 0.167 ± 0.013 0.372 ± 0.448 0.143 ± 0.033 0.162 ± 0.043
Femur quadriceps muscle (%) 0.811 ± 0.111 1.705 ± 2.075 0.595 ± 0.131 1.705 ± 2.075
Gastrocnemius muscles and soleus (g) 0.246 ± 0.088 0.223 ± 0.069 0.195 ± 0.059 0.246 ± 0.059
Gastrocnemius muscles and soleus (%) 1.207 ± 0.520 1.024 ± 0.361 0.823 ± 0.298 1.130 ± 0.312
628 | 2019 | ISSUE 3 | VOLUME 14 © 2019 University of Alicante
Table 6. Analysis of the cross-sectional area dimensions of the muscle fibers of C57BL / 6 mice of resistive exercise with electrostimulation (REE), resistance exercise without electrical stimulator (RE) and spontaneous physical activity (SPA) and control groups after ten intervention sessions.
Variables
Femur quadriceps muscle
p value Control (n = 3) REE (n = 3) RE (n = 3) SPA (n = 3)
Mean ± S.D. Mean ± S.D. Mean ± S.D. Mean ± S.D. REE vs.Control REE x RE REE vs. SPA
Average number of nucleus 15.44 ± 3.74 53.66 ± 10.57 35.55 ± 14.75 27.22 ± 7.82 0.000 0.003 0.000
Average fiber area (μm2) 3443.46 ± 725.21 3464.33 ± 781.90 3456.83 ± 670.71 3242.01 ± 666.91 1.000 1.000 0.086
Absolute value
Non-performing inferential test
Maximum fiber area (μm2) 4826.00 4795.00 4795.00 4699.00
Minimum fiber area (μm2) 2413.00 2398.00 2398.00 2390.00
Variables
Gastrocnemius muscles and soleus
p value Control (n = 3) REE (n = 3) RE (n = 3) SPA (n = 3)
Mean ± S.D. Mean ± S.D. Mean ± S.D. Mean ± S.D. REE vs.Control REE x RE REE vs. SPA
Average number of nucleus 33.66 ± 12.35 35.22 ± 10.42 37.88 ± 16.30 39.77 ± 22.33 1.000 1.000 1.000
Average fiber area (μm2) 3401.96 ± 705.14 3525.32 ± 768.88 3356.46 ± 917.20 3401.96 ± 917.20 1.000 1.000 1.000
Absolute value
Non-performing inferential test
Maximum fiber area (μm2) 4795.00 4603.00 4699.00 4699.00
Minimum fiber area (μm2) 2398.00 2398.00 2398.00 2398.00
VOLUME 14 | ISSUE 3 | 2019 | 629
Table 7. Analysis of the immediate behavior of C57BL/6 mice of resistance exercise with electrical stimulation (REE), resistance exercise without electrical stimulator (RE) and spontaneous physical activity (SPA) and control group.
Variables
Groups Control
(n = 3) (n = 3) REE (n = 3) RE (n = 3) SPA
Mean ± S.D. Mean ± S.D. Mean ± S.D. Mean ± S.D.
Time in the light environment (s) 95.66 ± 27.13 109.66 ± 33.08 135.66 ± 33.00 128.66 ± 22.03
Time in dark environment (s) 204.33 ± 27.13 190.33 ± 33.08 164.33 ± 33.00 171.33 ± 22.03
Change of environment (units) 4.66 ± 1.52 7.33 ± 3.05 6.00 ± 0.00 10.00 ± 2.00
Total distance (cm) 16238.33 ± 3003.57 19502.66 ± 5903.63 18292.00 ± 4035.75 22866.66 ± 4293.21
Average speed (cm/s) 53.66 ± 10.01 65.00 ± 19.92 60.66 ± 13.31 72.66 ± 15.94
All differences were not statistically significant (p < 0,05). Groups were compared using Kruskal-Wallis test. S.D. = standard deviation. REE = resistance exercise with electrostimulation. RE = resistance exercise without electrical stimulator. SPA = spontaneous physical activity.
Table 8. Analysis of behavior of C57BL/6 mice of resistance exercise with electrical stimulation (REE), resistance exercise without electrical stimulator (RE) and spontaneous physical activity (SPA) and control group after 5 sessions of each intervention.
Variables
Groups Control
(n = 3) Mean ± S.D.
REE (n = 3) Mean ± S.D.
RE (n = 3) Mean ± S.D.
SPA (n = 3) Mean ± S.D. Baseline
1 Baseline 2 p sessions Before sessions After p sessions Before sessions After p sessions Before sessions After p Time in the light environment (s) ± 50.23 112.00 ± 151.41 120.66 0.947 ± 45.90 167.00 114.33 ± 6.42 0.163 ± 48.56 135.00 ± 90.51 188.33 0.535 ± 10.14 153.00 ± 45.00 94.00 0.105
Time in dark environment (s) ± 50.53 188.00 ± 151.41 179.33 0.947 ± 45.90 133.00 185.66 ± 6.42 0.163 ± 48.56 165.00 ± 90.51 111.66 0.535 ± 10.14 147.00 ± 45.13 206.00 0.105
Change of environment (units) ± 6.02 9.66 ± 1.15 1.66 0.186 ± 1.15 4.66 ± 2.00 8.000 0.130 ± 3.21 6.33 ± 5.56 7.00 0.874 ± 2.08 5.66 ± 3.00 8.00 0.192
Total distance (cm) 2510.70 ± 87.22 ± 10.35 50.16 0.000* ± 544.87 2954.86 ± 114.46 2116.96 0.158 ± 411.44 2472.16 ± 1838.14 0.886 2273.03 ± 177.41 2582.16 ± 948.98 1883.76 0.323
Average speed (cm/s) ± 0.30 8.36 ± 3.50 3.20 0.112 ± 1.85 9.86 ± 0.40 7.06 0.164 ± 1.378.26 ± 6.12 7.56 0.880 ± 0.58 8.63 ± 2.82 5.96 0.227
630 | 2019 | ISSUE 3 | VOLUME 14 © 2019 University of Alicante
SUPPLEMENTARY MATERIAL: TABLES
Table S1. Results of the intrarater reliability test for muscular strength measurement of the anterior limbs in C57BL/6 mice using grip strength meter device.
Single Measures 51 n Test-retest amount 3 Intrarater correlation 0.807 0.000 p
Table S2. Results of the intrarater reliability test for muscular strength measurement of the all limbs in C57BL/6 mice using grip strength meter device.
Single Measures 41 n Test-retest amount 2 Intrarater correlation 0.917 0.000 p
Table S3. Results of the intra-examiner reliability test for measurement of hindleg volume in C57BL/6 mice using an ultrasound.
Single Measures 32 n Test-retest amount 2 Intrarater correlation 0.856 0.000 p
Table S4. Effect size of the mean values and standard deviation of the various muscle strength obtained before and after the use of resistance exercise with electrostimulation (RES), resistance exercise without electrical stimulator (RE), and spontaneous physical activity (SPA), and control.
Variables REE vs. Control REE Groups vs. RE REE vs. SPA
Effect size Classification Effect size Classification Effect size Classification
AAS (g) 3.18 Very large 1.8 Large 2.22 Very large
ARS (g/g) 3.37 Very large 1.35 Large 3.13 Very large
AAS4 (g) 1.01 Moderate 1.67 Large -0.02 Trivial
ARS4 (g/g) 12.34 Perfect 2.59 Very large 1.51 Large
MAS (g) 2.76 Very large 1.39 Large 1.3 Large
MRS (g/g) 3.59 Very large 1.49 Large 4.85 Perfect
MAS4(g) 2.82 Very large 4.63 Perfect 1.28 Large
MRS4 (g/g) 2.74 Very large 2.74 Very large 1.55 Large
VOLUME 14 | ISSUE 3 | 2019 | 631
Table S5. Size of effect of the hind limb volume (mm3) in the animals from obtained before and after the use of resistance exercise with electrostimulation
(RES), resistance exercise without electrical stimulator (RE), and spontaneous physical activity (SPA), and control. Muscle thickness of the hind limb volume (mm3)
Groups
REE vs. Control REE vs. RE REE vs. SPA
Effect size Classification Effect size Classification Effect size Classification
4.29 Almost perfect 0.27 little 1.02 Between moderate to large
Classification of effect size was performed using Hopkins (2009) criteria. REE = resistance exercise with electrostimulation. RE = resistance exercise. SPA = spontaneous physical activity.
Table S6. Mean values and delta standard deviation (Δ) for behavioral assessment before and after 5 sessions of intervention, resisted exercise with electrostimulation (REE), resistance exercise (RE) and spontaneous physical activity groups (SPA).
Groups
Variables Control (n = 3)
Mean ± S.D.
REE (n = 3) Mean ± S.D.
RE (n = 3) Mean ± S.D.
SPA (n = 3) Mean ± S.D.
Time in the light environment (s) 8.66 ± 201.59 -52.66 ± 42.09 23.33 ± 75.08 -59.00 ± 36.09
Time in dark environment (s) - 8.66 ± 201.59 52.66 ± 42.09 - 23.33 ± 75.08 59.00 ± 36.09
Change of environment (units) -8.00 ± 7.00 3.33 ± 2.30 0.66 ± 6.42 2.33 ± 2.08
Total distance (cm) -2460.53 ± 80.68 -837.90 ± 657.62 -199.13 ± 2120.20 -698.40 ± 928.63
Average speed (cm/s) -5.16 ± 3.26 -2.66 ± 2.68 -0.70 ± 7.06 -2.80 ± 2.25