© Global Society of Scientific Research and Researchers http://ijcjournal.org/
Predictive System for Heart Disease Using a Machine
Learning Trained Model
Ozichi N. Emuoyibofarhe
a*, Segun Adebayo
b, Ayodeji Ibitoye
c, Madamidola O.
Ayomide
d, Aderibigbe Taye
ea,b,c
Department of Computer Science and Information Technology ,Bowen University, Iwo, Nigeria
d
Department of Computer Science, Federal university of Technology, Akure
eDirector of Health Services, Bowen University, Iwo aEmail: [email protected]
bEmail: [email protected] cEmail: [email protected]
eEmail: [email protected]
Abstract
Heart as one of the essential organ of the human body and with its related disease such as cardiovascular diseases accounts for the death of many in our society over the last decades, and also regarded as one of the most life-threatening diseases in the world. Hence we seek to predict a system for Heart disease using a supervised Machine Learning (ML) trained model in MATLAB2018 workflow in a real-time environment. To develop the system, 299 heart sounds from patients were obtained and labeled as normal and abnormal heart sound. Features were extracted and labeled as dataset; K Nearest Neighbour (KNN), Support Vector Machine (SVM) and Decision Tree (DT) algorithm were used as the training platform. From the classification analysis developed using the supervised ML trained model in MATLAB2018 in conjunction with system software features for the prediction of the heartbeat for both current and predefined of a heart condition algorithms used in training the dataset for the prediction when principle component analysis was enabled, the result shows that KNN algorithm has the highest and best accuracy of 94.4%, followed by the SVM with 84.4% and DT had 81.1%. while from the evaluation analysis, KNN on Receive Operation Characteristic Curve (ROC) with 90% variance and training time of 12.88 seconds on positive class of abnormal over false classes of normal heart sound has AUC as 0.94 and on ROC curve with PCA 90% variance and training time of 1.7119 seconds on positive class of normal over negative classes of abnormal heart sound has AUC as 0.89 efficiency.
---
Hence the analysis from the result shows that out of the three classified algorithms used, KNN predicts and have the highest accuracy and is more efficient with respect to real-time environment.
Keywords: Machine Learning; Heart Disease; K Nearest Neighbour; Support Vector Machine; Decision Tree algorithms; Classification Analysis.
1.Introduction
Machine learning (ML) is the scientific study of algorithms and statistical models that computer systems use in order to perform a specific task effectively without using explicit instructions, relying on patterns and inference instead. It is seen as a subset of artificial intelligence. Machine learning algorithms build a mathematical model based on sample data, known as "training data", in order to make predictions or decisions without being explicitly programmed to perform the task [1,2]. Heart as an important organ also termed as the centrality of the human body generates blood to the other part of the organs in the body and where it fails in its responsibility, it can lead to the immediate death of a person. Hence it is observed from research that works overload, mental stress, depression, change of lifestyle and bad food or eating habits which occurs basically among mostly in adults are responsible in the rate of several heart-related diseases in our modern world. According to the survey from the World Health Organisation, Heart-related diseases account for the death of over 17 million lives globally. To diagnose heart-related diseases or cardiovascular is so complicated and at times difficult to accurately and efficiently made thereby leading to the wrong diagnosis from the healthcare provider which makes the costs of medical care to the patients to be very expensive in most cases. Therefore a predictive system is developed using a supervised Machine learning trained model in MATLAB2018 in order to predict the accuracy and evaluate the efficiency of the heart-related disease in a person. This will in turn help in diagnosing the disease and lessen the patient medical costs and treatments though this is based on the experience of the doctor and the patients' current result test [5]. The predictive system used in health care is primarily to determine certain conditions, like diabetes, asthma, heart disease, and other lifetime illness and also in supporting medical decision in a healthcare sector such as when and how to apply a particular diagnosis with the specific tests or treatments. In this work, Principal Component Analysis (PCA) which is a popularly used linear transformation algorithm is used for feature extraction and selection. This helps in the determination of the maximum variance and finds the direction that is mutually orthogonal and the best global algorithm that gives the suitable accuracy [9]. Also, Receive Operation Characteristic Curve (ROC) which is a graphical plot that illustrates the diagnostic ability of a binary classifier system is used with three classified algorithms in order to determine and evaluate the efficiency with respect to real-time environment which is used in by the medical doctor to monitor the patients who are at increased risk of dangerous heart conditions and thereby removal of unskilled clinician diagnostically approach..
2. Review Of Related Works
An analysis of Heart Disease Prediction System using different data mining tools such as artificial neural network, fuzzy logic and genetic algorithm and decision trees stipulated in their analysis that Neural Network with 15 attributes shows an accuracy of 100% which is the highest while the Decision Tree shows 99.62% as the accuracy with the same attributes but in combination with Genetic algorithm and 6 attributes, the Decision Tree shows 99.2% as efficiency [3]. An improved study of Heart Disease Prediction System using Data Mining Classification Techniques was proposed by [4] which shows from their result that Neural Networks provides more accurate results when compared to Decision trees and Naïve Bayes to determine which of the techniques is more accurate to predict the presence of heart disease; using two more attributes obesity and smoking. Also, [6] in their paper Mining Biosignal Data: Coronary Artery disease diagnosis using linear and nonlinear features of Heart Rate Variability (HRV) using a Bayesian Classifiers, Classification based on Multiple Association Rules (CMAR), Decision Tree and Support Vector Machine (SVM) to develop the multi-parametric feature with linear and nonlinear characteristics of the HRV; and A proposed Machine learning prediction based approach with the right class weight that is superior to other Machine Learning and statistical techniques for the prediction of 30 day heart failure readmission or death was developed[1] Furthermore, a classification method for the extraction of multiparametric features by assessing HRV from ECG, data pre-processing and heart disease pattern was developed in [7]. In their work, the dataset consists of 670 peoples which are distributed into two groups namely normal people and patients with heart disease were employed in carrying out the experiment for the associative classifier. In [11], it demonstrated the use case model and showed how machine learning power can be harness and apply to the real-world problems.
3. Proposed Prediction System
3.1 K-Nearest Neighbor
K-Nearest neighbor (KNN) also known as the case-based reasoning has been used in many applications like pattern recognition, statistical estimation.is a simple, lazy and nonparametric classifier and is preferred when all the features are continuous. The classification here is obtained by identifying the classes of K nearest neighbors of a given dataset which is based on the majority class obtained, thereafter it assigns a class to determine the class of the unknown sample.
3.2 Support Vector Machine
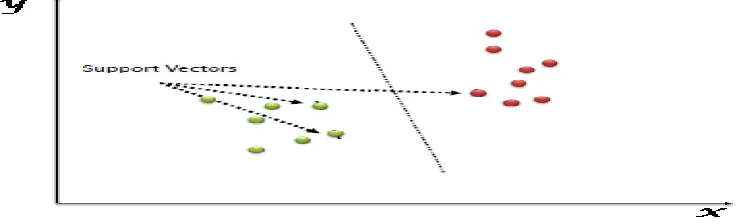
Support Vector Machine (SVM) is a supervised machine learning algorithm used for the pattern classification and nonlinear regression of the features. It is an approximate implementation of the method of structural risk minimization that provides a good generalization on a pattern classification problem. In the algorithm, each dataset is plotted as a point in the feature space with the value of each features being the value of a particular coordinate. For the classification, a hyper-plane in the feature space that differentiates the classes is derived. An SVM model is the training data points as points in the feature space which is mapped in a way that the various points belonging to the separate classes are differentiated by a wide margin thereby enabling the test data points to be mapped into the same space and classified based on the side of the margin they fall into.
Figure 1: Support Vector Machine
3.3 Decision Tree
Figure 2: Decision Tree
3.4 System Architecture
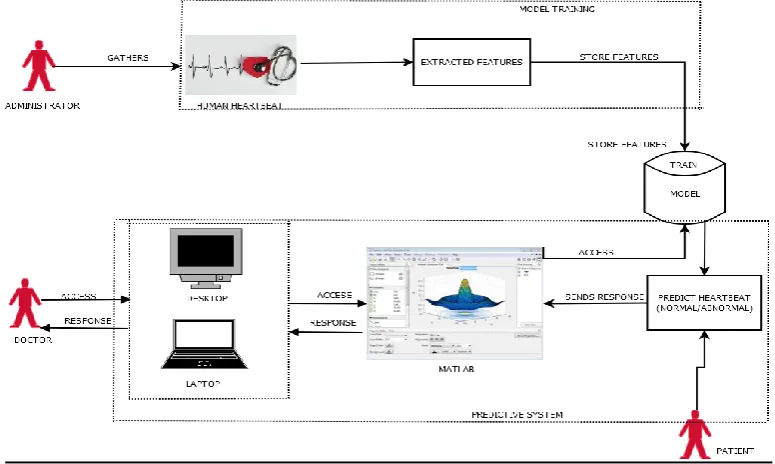
The system developed from the MATLAB 2018 models is a 2 tier system where the administrator gathers heartbeat data from the patient in the hospital through the use of a stethoscope or any heartbeat reader as the dataset. As shown in the architectural diagram on Figure 3, the system takes visual input from the extraction and sends it the systems model for the dataset training in order to determine the health status or state through the signal and responses from the various parameters and thereafter, it reports its responses are displayed on the desktop or laptop for the doctor’s responses.
Figure 3: Architectural view of the proposed system
with 80% of the samples of class A and 20% of the samples of class B as the training set, the model accuracy after the training becomes 90% by simply predicting every training sample belonging to class A. The developed system was evaluated using some performance metrics which are Receive Operation Characteristic (ROC), Confusion Matrix, Classification accuracy and Area under the Curve.
4.Result
The proposed system using the approach that was adopted in the methodology achieved the objective of this research which is to develop a predictive system for heart failure using a machine learning trained model. The working system theoretical design were converted while the components of the system were tested and evaluated using the hardware specifications which includes Pentium processor of AMD E1-2100 processor speed, 4GB RAM on the system, 10GB of hard disk space and LCD; and also for the software requirements, operating systems windows 8.1 with 64bits, System based application, MATLAB2018 and GenyMotion were used for the running of the proposed system. From the classification analysis which is developed using the supervised machine learning trained model in MATLAB2018 in conjunction with the system software for the prediction of the heartbeat for both current and predefined of a heart condition obtained from the different algorithms used in training the dataset for the prediction when principle component analysis (PCA) was enabled, K Nearest Neighbour algorithm has the highest and best accuracy of 94.4%, followed by the Support Vector Machine with 84.4% accuracy from 5 features out of 26 while Decision Tree with 81.1% from 3 features out of 26. The screenshots of the graphical analysis of the model prediction are shown below
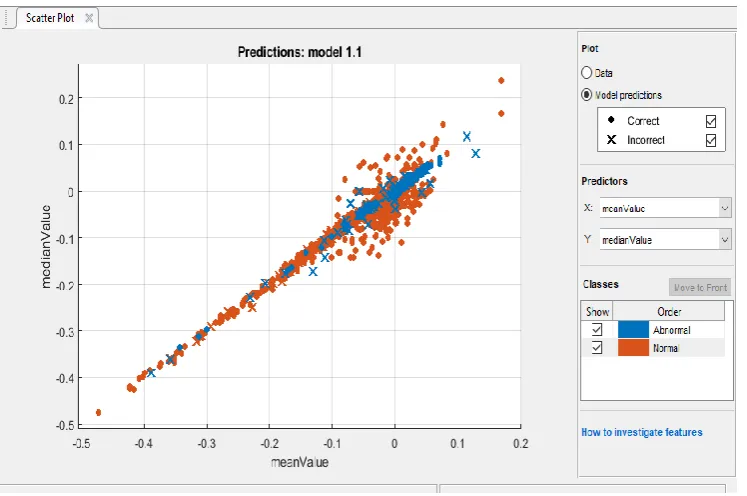
Figure 5: The Model prediction that shows for quantile75 on Y-axis and quantile25 on the X-axis for both Abnormal and Normal Heart sound
Figures 4 and 5 show the model predictor of KNN with an accuracy of 90% and training time of 12.88 seconds plotting incorrect and correct classes of the abnormal and normal heart sound.
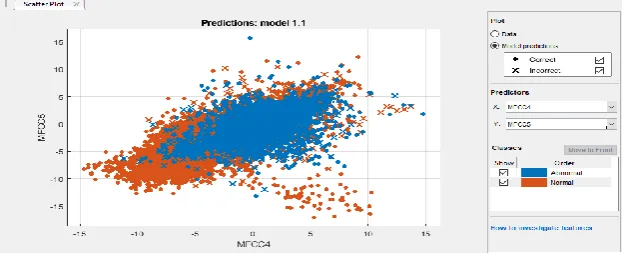
Figure 6: The Model prediction that shows for MFCC4 on Y-axis and MFCC3 on X-axis for both Abnormal and Normal Heart sound
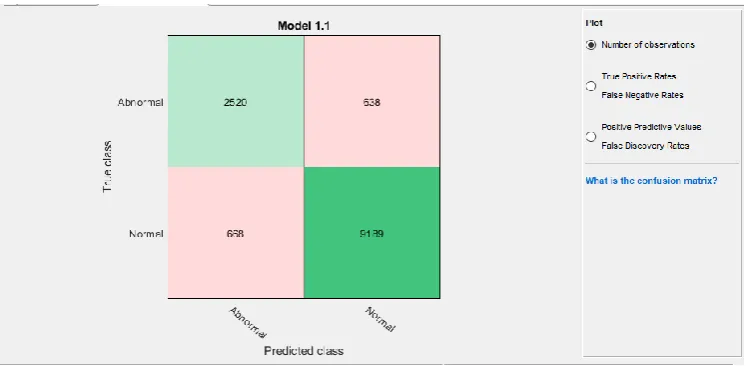
Figure 6 and 7 model predictor of KNN for MFCC4 and MFCC3 also MFCC5 and MFCC4 are shown above with accuracy of 90% and training time of 12.88 seconds plotting incorrect and correct classes of the abnormal and normal heart sound. A Confusion Matrix gives the matrix output and describes the complete performance of the model and help to identify the areas where the classifier has performed poorly. Also, the confusion matrix plot helps us to understand how the currently selected classifier performed in each class. In the plot when it is opened, the rows show the true class, and the columns show the predicted class and using the holdout or cross-validation, the confusion matrix is calculated using the predictions on the held-out observations. The diagonal cells show where the true class and predicted the class match. If these cells are green, the classifier is satisfied to have performed well and is said to have correctly classified observations as a true class.
There are 4 important terms of confusion matrix found in this work which are
TP (True Positives): The cases in which we predicted YES and the actual output was also YES.
TN (True Negatives): The cases in which we predicted NO and the actual output was NO.
FP (False Positives): The cases in which we predicted YES and the actual output was NO.
FN (False Negatives): The cases in which we predicted NO and the actual output was YES.
The Accuracy for the matrix was calculated by taking the average of the values lying across themain diagonal and displayed on the screenshots below.
Figure 8: A trained model on the Confusion Matrix of a number of observations on the plot
Figure 9: A trained model on the Confusion Matrix of True Positives Rates and False Negatives Rates on the plot.
This shows the model predictor of KNN on confusion matrix with an accuracy of 90% and training time of 12.88 seconds plotting true positive rate over false-negative rate for normal and abnormal heart sound with various ranging values.
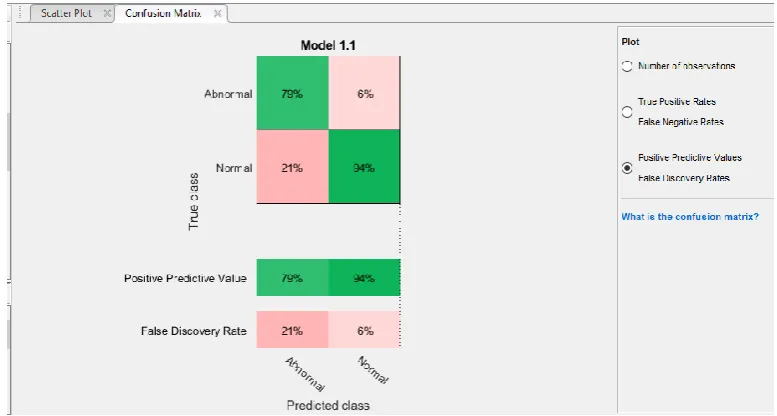
Figure 10: A trained model on the Confusion Matrix of the predicted class of Positives Predictive Values and False Discovery Rates on the plot
Figure 11: A trained model on the ROC Curve of a positive class of abnormal heart sound and Negative classes of Normal heart sound
This shows the model predictor of KNN on ROC curve with an accuracy of 90% and training time of 12.88 seconds plotting positive class of abnormal over the false classes of normal heart sound has the AUC to be 0.94
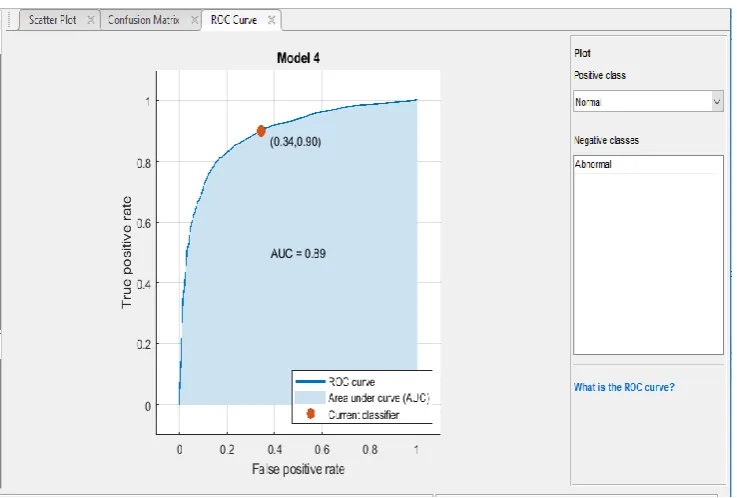
Figure 12: A trained model on ROC Curve PCA (principal component analysis) explaining 90% positive class of Normal heart sound over false classes of the abnormal heart sound.
Figure 13: A trained model on Confusion Matrix with PCA explaining 90% variance of True Positive Rates and False Negative Rates on the plot
In Figure 13, model predictor on confusion matrix is shown, with PCA explaining 90% variance and training time of 1.623 seconds with 3 out of 26 features plotting true positive values and false-negative rates for normal and abnormal heart sound.
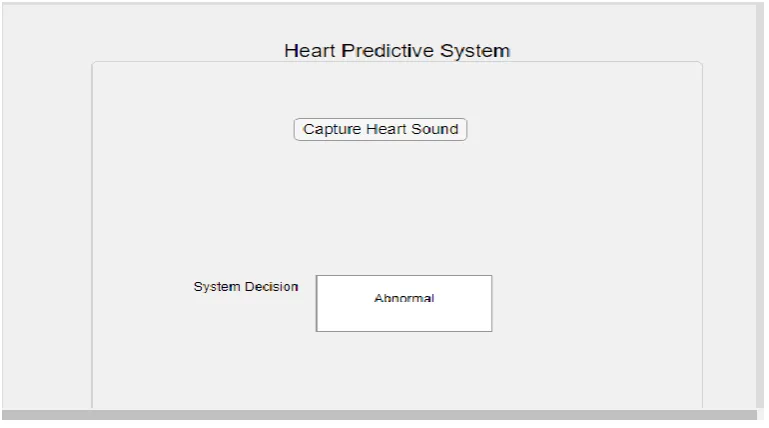
Figure 14: Heart sound prediction for Abnormal Heart sound.
Figure 15: Heart prediction for Normal heart sound.
This system interface captures the heart sound and processes the data for the decision that predicts normal heart sound.
5.Conclusion
Based on the above review, it can be concluded from the classification analysis result that is developed using the supervised machine learning trained model in MATLAB2018 in conjunction with the system software for the prediction of the heartbeat for both current and predefined of a heart condition obtained from the different algorithms used in training the dataset for the prediction when principle component analysis (PCA) was enabled, that K Nearest Neighbour algorithm has the highest and best accuracy of 94.4% from 5 features out of 26, followed by the Support Vector Machine with 84.4% accuracy while Decision Tree with 81.1%. Also from the evaluation analysis, it shows that KNN on ROC curve with 90% variance and training time of 12.88 seconds plotting positive class of abnormal over the false classes of normal heart sound has the AUC to be 0.94 while on ROC curve with PCA 90% variance and training time of 1.7119 seconds with 5 out of 26 features plotting positive class of normal over negative classes of abnormal heart sound has the AUC to be 0.89 efficiency.
5.1 Limitations of the Study
The limitation in this study is the use of only heart beat without the corresponding use of other features like Electrocardiography (ECG), Chest X-ray and Echocardiography since sometimes the heartbeat may not necessarily correspond to these other features. However this is not likely to be a problem in this study as the study participant has no particular features that could cause irregular heartbeat. Hence the heartbeat analysis could also be done without the under listed features.
6. Recommendation
References
[1] Awan, S. E., Bennamoun, M., Sohel, F., Sanfilippo, F. M., and Dwivedi, G., 2019. Machine learning‐ based prediction of heart failure readmission or death: implications of choosing the right model and
the right metrics. ESC heart failure, 6(2), 428-435.
[2] Bishop, C.M., 2006 Pattern Recognition and Machine Learning. Springer ISBN 978-0-387-31073-2.
[3] Bhatla, N. and Jyoti, K., 2012. An Analysis of Heart Disease Prediction using Different Data Mining Techniques. International Journal of Engineering Research and Technology (IJERT), Vol.1 Issue 8, ISSN: 2278-0181.
[4] Char, D.S, Shah, N.H., Magnus, D., 2018. Implementing Machine Learning in Health care- Addressing Ethical Challenges. New England Journal of Medicine. 378(110): 981-983.doi:10.1056/nejmp1714229 PMC 5962261, PMID 29539284.
[5] Chaitrali S. D. and Sulabha S. A., 2012. Improved Study of Heart Disease Prediction System Using Data Mining Classification Techniques. International Journal of Computer Applications, Vol.47-10 (0975-888).
[6] Heon Gyu Lee, Ki Yong Noh, Keun Ho Ryu,, 2007. Mining Biosignal Data: Coronary Artery Disease Diagnosis using Linear and Nonlinear Features of HRV,” LNAI 4819: Emerging Technologies in Knowledge Discovery and Data Mining, pp. 56-66.
[7] Kiyong Noh, Heon Gyu Lee, Ho-Sun Shon, Bum Ju Lee, Keun Ho Ryu, 2006. Associative Classification Approach for Diagnosing Cardiovascular Disease” Intelligent Computing in Signal
Processing and Pattern Recognition. International Conference on Intelligent Computing, ICIC 2006
Kunming, China, https://link.springer.com/chapter/10.1007/978-3-540-37258-5_82 pp. 721-727
[8] Langley P., 2011. The changing Science of Machine Learning. Machine Learning 82(3):275-279 DOI: 10, 1007/S 10994-011-5242.
[9] Ramalingam, V.V., Ayantan Dandapath, M. Karthik Raja, 2018. Heart disease prediction using machine learning techniques: a survey. International Journal of Engineering and Technology, 7(2, 8) pp. 684-687
[10] Wang, X., Dasgupta, S., 2016. An algorithm for LI nearest neighbor search via monotonic embedding. (PDF) Advances in Neural information processing systems 29, Curran Associates, Inc. app.983-991