Asian Journal of Pharmaceutical Research and Development
(An International Peer-Reviewed Journal of Pharmaceutical Research and Development)
www.ajprd.com
ISSN 2320-4850
Research Article
METHOD DEVELOPMENT& SIMULTANEOUS ESTIMATION OF
METFORMIN HYDROCHLORIDE AND REPAGLINIDE IN
TABLET DOSAGE FORM
Madhavi Jain1*, Ami Sharma1, Love Kumar Soni1, Mahaveer Kabra2
1School of Pharmacy, Devi Ahilya Vishwavidyalaya, Indore (Madhya Pradesh) ,India
2 Kota College of Pharmacy, Kota (Rajasthan), India
Email: [email protected]
Received: 13 May 2013, Revised and Accepted: 28May 2013
ABSTRACT
Development and Validation of RP-HPLC Method for Simultaneous Estimation of MET and RPG in Tablet Dosage Form was performed by using LC system consists of pump (Shimadzu LC 10AT VP) with universal loop injector (Rheodyne 7725 i) of injection capacity 20 µL. Detector consists of Photodiode Array Detector (PDA) SPD-10 AVP UV-Visible detector, for separation column used was Chromatopak C18 (5µm×250mm×4.6mm i.d). For quantitative estimation of MET and RPG, mobile phase used was acetonitrile : water in the volume of 90 : 20 v/v with the flow rate of 1.0ml/ min was confirmed by considering the resolution between both the peaks. Detection wavelength 223nm was selected as both the analyte absorbed well and at this particular wavelength neither any interference from the mobile phase nor any baseline disturbance appeared. Validation reveals the method is specific,rapid,accurate,precise,reliable and reproducible. The high recovery and low coefficients of variation confirm the suitability of the method of simultaneous analysis of the two drugs in tablets.
Key words: HPLC, Metformin, Repaglinide
INTRODUCTION
etformin Hydrochloride
1- (diaminomethylidene)-3,3-dimethyl-guanidine Hydrochloride is a Biaguanides antidiabetic which is white crystalline powder, hygroscopic , odorless and bitter in taste.
Repaglinide
S-2-Ethoxy-4-[2-[[methyl-1-[2-[(1-piperidinyl) Phenyl]-butyl] amino]-2-oxoethyl]
benzoic acid is a Meglitinide antidiabetic which is white to off white in color.
* For Corroding: Madhavi Jain
School of Pharmacy, Devi Ahilya Vishwavidyalaya, Indore (Madhya Pradesh), India
Email: [email protected]
A literature survey reveals that MET and RPG have been reported separately by HPLC and UV Spectrophotometry. Since no chromatographic method has been developed yet for the combination of these two drugs and thus this combination was selected in order to develop a chromatographic
method.[1]
Experiment
Pure sample of MET and RPG were obtained from was obtained from Modern Laboratories, Indore, India. and Torrent pharma Ltd Gujarat, India respectively. The tablet dosage form, Prandimet, manufactured by Novo Nordisk Ltd, Bangalore (Label claim: 500 mg metformin and 2 mg
and reagents used were of HPLC grade and purchased from Spectrochem, Mumbai, India.
(A) (B)
Fig.1. The chemical structure of MET (A) and RPG (B)
Preparation of Standard and Sample Solutions
MET and RPG (10mg each) were weight accurately and separately transferred to 100ml volumetric flasks. Two drugs were dissolved in acetonitrile to prepare standard stock solution containing 100µ/ml.
For analysis of tablet dosage form, twenty tablets were weighed individually and their average weight was determined. The tablet were crushed to a fine powder and powder equivalent to the weight of one tablet was trasffered to a 100ml volumetric flask and dissolve it in for 30ml, acetonitrile .The solution was shaken vigorously for 15min and filtered through Whatman #41 filter paper, and the residue was washed with solvent. The solution was
than dissolved to a volume with same solvent.
Chromatography
The LC2 system consists of pump (Shimadzu LC
10AT VP ) with universal loop injector (Rheodyne
7725 i) of injection capacity 20 µL. Detector
consists of photodiode array detector (PDA)
SPD-10 AVP UV-Visible detector, for separation column
used was Chromatopak C18 (5µm×250mm×4.6mm
i.d). The equipment was controlled by a PC work station equipped with software CLASS M 10-VP software (Shimadzu, Kyoto, Japan).The volume capacity of the reservoir was greater than 500ml. The mobile phase velocity was within 1-2 ml/min.
The mobile phase was a 90:20(v/v) mixure of acetonitrile and water at a flow rate of 1mL min -1
.The run time was 10min. Before analysis both mobile phase and sample solution were degassed by sonication and filtered through 0.2-µm filter paper. The analytes were monitored at 223nm. The two components were identified by comparison of retention time obtained from sample and standard solutions. The work was performed in an
air-conditioned room maintained at 25±20C.
Construction of calibration plots
From the standard stock solutions of two drugs MET and RPG, different dilutions were prepared for each drug and chromatographed and the peak area was measured. From the calibration it was found that response to MET and RPG was linear
function of concentration in the range 5-40µg mL-1
and 2-35 µg mL-1. Unknown assay sample were
quantified by reference to this calibration plots.
Assay of Tablet Formulation
Table 1: RESULTS FROM ASSAY OF THE TABLET FORMULATION
Drug Label claim
(mg\tablet) n=6 Amount Found in mg Drug Concentration ( %)
MET 500 498.48 99.696
RPG 2 1.987 99.35
MET: Metformin, RPG: Repaglinide
Validation
The method was validated for linearity, accuracy, precision, reapitability, selectivity, and specificity. Accuracy was studied by measurement of recovery at three different level 80, 100, 120% of the amount expected in the formulation, in accordance with ICH guidelines3. Precision measured at both intra-day and inter-intra-day. In the intraintra-day study the concentration of two drugs were calculated three times on the same day at interval of an hour. In the inter-day study the concentration of two drug were measured on three different days. The selectivity and specificity of the method will validated by injecting solution containing two drugs; two sharp peaks obtain for two drugs. The limit of detection and quantitation of the method were studied to detect the lowest amount of analyte and quantitative determination of analyte in a sample, respectively.
HPLC Method Development and Optimization
Column chemistry, solvent type, solvent strength, detection wavelength, and flow rate were varied to determine the chromatographic conditions giving the best separation. The mobile conditions were optimized so the tablet components free from interference from the solvent and from the excipient. Other criterias, for example time required
for analysis, appropriate k range for eluted peaks, assay sensitivity, solvent noise, and use of same solvent system for extraction of the drug from formulation matrices during drug analysis were also considered . After trying column containing different stationary phase, the final choice giving satisfactory resolution and run time was the 25cm×4.6mm i.d., 5µm particle, Chromatopack C18 reversed phase column. A series of aqueous mobile phase in combination with different volume fraction of acetonitrile as modifier were also tested. The best result was obtained with acetonitrile: water in the ratio of 90:20 (v/v). The flow rate was determined by testing the effect of different flow
rates on peak area and resolution; 1.0mL min-1 was
found to be optimum. The experiment was performed at ambient temperature. To determine the appropriate wavelength for simultaneous determination of MET and RPG, solution of these
compound in acetonitrile by UV-visible
spectrophotometry (Shimadzu 1700) in the range of 200-400nm. From the overlain spetra, suitable wavelength considered for monitoring the drugs were 223nm . Solution of each substance in acetonitrile were also injected directly for HPLC analysis and the responses (peak) were recorded at 223nm. It was obsereved there was no interference from the mobile phase or baseline disturbance and all the analyte absorbed well at 223nm. [7-9]
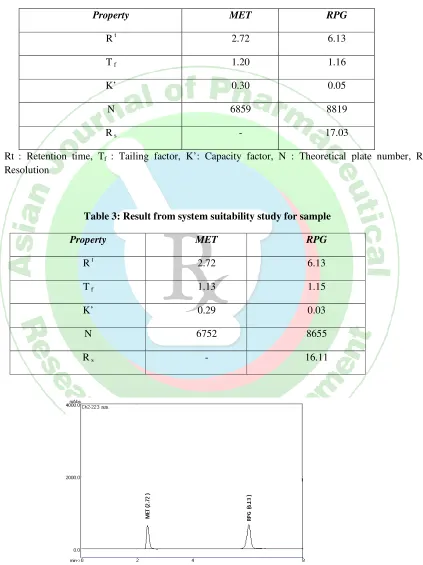
Under the optimum chromatographic condition, the retention time obtained for MET and RPG were 2.72 and 6.13 min respectively(fig-3). Resolution
(Rs) between MET and RPG was 17.03 respectively. Capacity factor, Tailing factor, no of theoretical plates are reported in Table-2.
Table 2: Result from system suitability study for standard
Property MET RPG
R t 2.72 6.13
T f 1.20 1.16
K’ 0.30 0.05
N 6859 8819
R s - 17.03
Rt : Retention time, Tf : Tailing factor, K’: Capacity factor, N : Theoretical plate number, Rs: Resolution
Table 3: Result from system suitability study for sample
Property MET RPG
R t 2.72 6.13
T f 1.13 1.15
K’ 0.29 0.03
N 6752 8655
R s - 16.11
The values obtained for k and Rs (1<10, Rs>2) shows these chromatographic condition are appropriate for separation and separation and quantification of two compounds. The number of plates (N) is a measure of column efficiency; which shows the high separation efficiency of the column used.
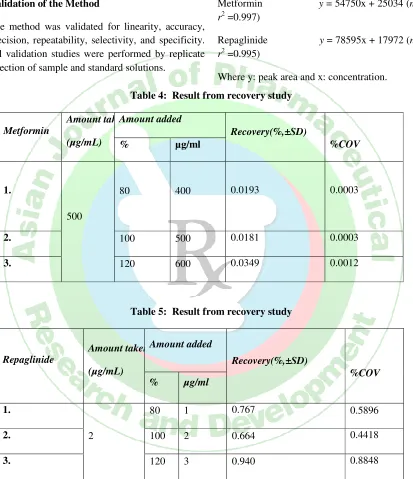
Validation of the Method
The method was validated for linearity, accuracy, precision, repeatability, selectivity, and specificity. All validation studies were performed by replicate injection of sample and standard solutions.
Linearity
For each drug, appropriate dilutions of standard stock solutions were assayed as per the developed methods. MET has linearity between 5-40 µ g/ml and linearity of RPG has range between 2-35 µg/ml the linear regression equation for two drugs was; [10-11]
Metformin y = 54750x + 25034(n = 5,
r2 =0.997)
Repaglinide y = 78595x + 17972 (n = 5,
r2 =0.995)
Where y: peak area and x: concentration.
Table 4: Result from recovery study
Metformin
Amount taken
(µg/mL)
Amount added
Recovery(%,±SD)
%COV
% µg/ml
1.
500
80 400 0.0193 0.0003
2. 100 500 0.0181 0.0003
3. 120 600 0.0349 0.0012
Table 5: Result from recovery study
Repaglinide
Amount taken
(µg/mL)
Amount added
Recovery(%,±SD)
%COV
% µg/ml
1.
2
80 1 0.767 0.5896
2. 100 2 0.664 0.4418
3. 120 3 0.940 0.8848
S.D., standard deviation; COV, coefficient of variance.
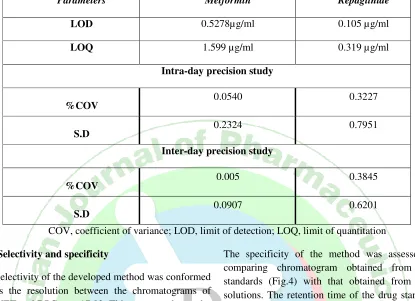
Precision, LOD and LOQ
Precision was studied both intra-day and inter-day. Six replicate sample solution were prepared from the stock solution. For study of intra-day precision the concentration of two drugs were measured three times on the same day at interval of 1hr. In the
inter-day study the drug concentration were measured on three different days. The limis of detection and quantitation, LOD and LOQ, were
calculated by use of equation LOD=3.3σ/S and
Table 6: Result from Precision and LOD and LOQ
Parameters Metformin Repaglinide
LOD 0.5278µg/ml 0.105 µg/ml
LOQ 1.599 µg/ml 0.319 µg/ml
Intra-day precision study
%COV 0.0540 0.3227
S.D 0.2324 0.7951
Inter-day precision study
%COV 0.005 0.3845
S.D 0.0907 0.6201
COV, coefficient of variance; LOD, limit of detection; LOQ, limit of quantitation
Selectivity and specificity
Selectivity of the developed method was conformed as the resolution between the chromatograms of MET and RPG was 17.03. This suggests that under the proposed chromatographic conditions MET and RPG were completely separated from each other. Which indicates the method is selective for simultaneous estimation.
The specificity of the method was assessed by comparing chromatogram obtained from drug standards (Fig.4) with that obtained from tablet solutions. The retention time of the drug standards and the drugs from the tablet solutions were same, so the method was specific. The method was also specific and selective because there was no interference from excipients in the tablets.
(A) (B)
CONCLUSION
The developed methods for simulataneous
estimation of MET and RPG in tablet dosage form using RP- HPLC was found statistically significant as the statistical results of validation study were with in the acceptance range. This reveals that the developed method was simple, accurate, precise, selective and specific for simultaneous estimation of both the drugs from commercially available dosage form.
REFERENCES
1. Indian Drugs Review; A. Mediworld publication; New delhi, 2006; 105-119.
2. Sethi PD, In; HPLC Quantitative Analysis of Pharmaceutical formulation; CBS Publishers and distributors, New Delhi, 2001; 1, 60-63.
3. Patel JR, Suhagia BN, Patel BH. Simultaneous spectrophotometric estimation of metformin and repaglinide in synthetic mixture. Indian Pharma Sci 2007; 69:844-846.
4. Jain D, Jain S, Amin M, Simultaneous estimation of metformin, pioglitazone and glimepiride by RP-HPLC in tablet formulation. J. Chromatographic Science 2008;46:501-504.
5. Gandhimathi M, Ravi TK, Renu SK. Determination of repaglinide in pharmaceutical formulations by HPLC with UV detection. J Pharm Biomed Anal 2003;19:1675. 6. Jain HK, Agrawal RK. Simultaneous estimation of
gliclazide and metformin in combined dosage forms. Indian J Pharma Sci 2002;64, 88-91.
7. Rajput SJ, Chaudhary BG. Validated analytical method of repaglinide in bulk and tablet formulations.Indian J Pharma Sci. 2006; 68:130-132.
8. Martindale, The complete drug reference, The pharmaceutical press, London 33 Edn,2002;332.3- 334.1. 9. International Conference on Harmonization (ICH),Q2A:
Text on validation of Analytical Procedures: definitions and terminology, US FDA Federal Register,1995; 60 10.Berecka A,Gumieniczek A,Hopkala H. Development and
validation of new HPLC method for determination of gliclazide and repaglinide in pharmaceutical formulations.J AOAC Int, 2006;89:319-25.