OIL AND GREASE CONTAMINATION OF EUPHRATES RIVER
Dr. Hussein Abdulmuttaleb Ali khan
University of Kufa/ Eng. College
---Abstract
The environmental impact of most releases of petroleum wastes would be minimal if the wastes remained at their points of release. However, wastes can migrate away from a release point by a number of pathways. The present study was conducted on Al Manatherah river in Al Manatherah city in the aim of studying the contamination levels of oil and grease, with some water quality parameters (NO3, pH, T.U., Cl,) and selected climatic parameters (precipitated dust
particles, temperature, dust storm, and rain) were depended. Samples of raw water were collected and analyzed from Al Manatherah river station during a period of fifteen months, starting from October 2010 to December 2011. The purpose is to assess the level of parameters measured and their effects on the river. Statistical analysis used to describe the relations between oil and grease and the other parameters and a regression analysis was performed by "Data Fit" program version 8.0 Software. This study showed that discharging domestic sewage and industrial waste water from adjacent areas, caused oil and grease contamination of levels more than Iraqi standard limits in 64 times .The highest values of oil and grease recorded in heavy rainy months impacted by runoff from land, the second highest values of oil and grease occurred in May. Finally, oil and grease levels, also increased according to precipitated dust particles, and dust storm which will lead to use more amounts of oil and grease due to different activities, followed by discharging of polluted waters to sewers or into river directly.
INTERNATIONAL REVIEW OF HUMANITIES AND SCIENTIFIC RESEARCH By International Scientific Indexing
ISSN (Online) : 2519-5336 www.irhsr.org
218 1. INTRODUCTION
Water that may be considered absolutely pure is not to be found in nature. Even rainwater which is in fact, distilled water, collects impurities such as dust, gases, bacteria etc. during its passage through the atmosphere. The portion of rainwater which flows over the surface and called run-off picks up organic and suspended matter, whereas the portion percolating through the ground has got mineralogical, organic and inorganic matter which it gathers while traversing through the underground strata before reaching the water table (Duggal, 2008).
Oil is a natural product which results from plant remains fossilized over millions of years, under marine conditions. It is not surprising, therefore, that all components of oil are readily biodegradable by bacteria, although different components degrade at different rates, tars being one of the slowest. When oil is spilled on water body, being light, it is spreads over the surface as a slick. The lighter components, which are also often the most toxic, either evaporate or dissolve in the water. Immiscible components become emulsified and dispersed in the water, while heavy residues form tar balls. The immiscible fraction forms a water-in-oil emulsion called" chocolate mousse", which contains about 75 per cent water. This forms sticky brown masses when it comes ashore and causes major problems on tourist beaches and river banks (Kiely, 1997).
Generally, petroleum contains about 85 per cent carbon 12 per cent hydrogen. The remaining 3 per cent is composed of small amounts of oxygen, nitrogen, and sulfur. Some products and by-products of oil refining are gasoline, kerosene, lubricants, gas oil and fuel oil, wax, asphalt, petroleum coke, miscellaneous materials such as petrolatum and insecticides (Nemerow, 1971).
Oil is washed into surface waters in runoff from roads and parking lots, and groundwater can be polluted from leaking underground tanks. Accidental oil spills from large transport tankers at water bodies occasionally occur, causing significant environmental damage. Oil spills at surface water may eventually move toward shore, affecting aquatic life and damaging recreation areas (Nathanson, 2000). The acute effect of oil on birds, fish, and other aquatic organisms is well cataloged; the subtle effects of oil on aquatic life is not so well understood and is potentially more harmful (Weiner and Matthews, 2003).
Prior to 1940, most municipal wastewater was generated from domestic sources. After 1940, as industrial development in the United States grew significantly, increasing amounts of industrial wastewater have been and continue to be discharged to municipal collection systems. The amounts of heavy metals and synthesized organic compounds generated by industrial activities have increased, and some 10,000 new organic compounds are added each year. Many of these compounds are now found in the wastewater from most municipalities and communities (Metcalf & Eddy, 2004).
Hunter et al., 1979, showed that the runoff from an urban area was found to contain on the average 3.69 mg/1 total hydrocarbons. Of the total hydrocarbons, 69.6% were aliphatic and 30.4% aromatic. In addition, 86.4% were associated with the particulate materials present and only 13.6% with the soluble constituents. However, as the runoff increased the fraction of hydrocarbons associated with the particulates also increased. No relationship was found between load and the time since prior rainfall, but a relationship was observed between runoff and load. Preliminary analysis indicates that the primary source of these hydrocarbons may be crankcase oil.
From previous studies done by Iraqi researchers, there is no study that deal with measurement and monitoring of oil and grease in water bodies specifically. So, this paper in our companion paper (Alikhan, 2014) will be used to observe oil and grease contamination of Euphrates river at Al Manatherah river station.
2. STUDY AREA
Al Manatherah city is located about 15 km south of Al Najaf city, and the location of Al Manatherah station is on the Euphrates river/ Al Kufa river, near the Al Manatherah water treatment plant for surface water monitoring, at coordinates (E044.49070, N31.90693). The water level at the station is not stable at a certain depth, according to the season of the year, in the summer decline is attributed to its lowest level so that the bottom of the river can be seen in some areas near the station, and even in winter the water levels are not rising as required, and the center of the river is not covered with water even in winter and the rainy season (figure 1 ). The nature of the land surrounding the station is agricultural land, with some residential building.
Euphrates river near Al Manatherah station receives many pollutants discharged by different sources, including:
i. Al Barakiah waste water treatment plant at 10 km north.
ii. Careless use of pesticides can contaminate water sources and make the water unsuitable for drinking. Wastes of animals and plants from agricultural areas are discharged to the river on both sides.
iii. Contaminated water discharged from many drainage channels located at 750 meters north and 1000 m south.
Table (1): The proposed models.
Rank Equation Description
A
y
exp(ax
bx
...
j
x
M)
k k 2
1
B
y
ax
bx
...
j
x
M
k k 2
1
C
k k 2
1
b
x
...
j
x
x
a
y
Where;
y = dependent variables.
x1, x2, …, xk= the independent variables.
a, b, c, …jk= are model coefficients,
and M = model constant term.
4. DATA ANALYSIS
This research covers the study and analysis the pair of monthly water quality parameters of surface water for Euphrates river at Al Manatherah river station, and climatic conditions factors involved.
Data for Euphrates river in Al Manatherah station were collected, from the period extended from October 2010 to December 2011. These data represent the nitrate (NO3), hydrogen ion
concentration (pH), turbidity unit (T.U.), chloride (Cl), precipitated dust particles (PM, g/m2), mean max. temperature (T), dust storm (DS), and monthly rain totals (Ra) as independent variables, and oil &grease (O&G) as dependent variable, as shown in table (2).
The samples of water parameters used were tested in the laboratory in environment directorate of Al Najaf city.
Table (2): Description of independent and dependent variables in Al Manatherah river station.
Type of variables
Variables Detail
In
de
pe
n
de
n
t
X1 Nitrate (NO3, mg/L)
X2 Hydrogen Ion concentration (pH)
X3 Turbidity unit (T.U., NTU)
X4 Chloride (Cl, mg/L)
X5 Precipitated dust particles (PM, g/m2/month)
X6 Mean Max. Temperature (T, ºC)
INTERNATIONAL REVIEW OF HUMANITIES AND SCIENTIFIC RESEARCH By International Scientific Indexing
ISSN (Online) : 2519-5336 www.irhsr.org
222
Figure (2) shows the variations of O&G with time compared with some allowable limits according to Iraqi and United States standards in Al Manatherah river station. Monthly variations of NO3, pH, T.U., Cl, and PM shows by Figs. 3 to 7, while temperature, dust storm, and rain
variations are represented by Fig. 8 during period of study.
Table (3) shows analysis of variance (ANOVA) for regression model obtained, the Prob (F) = 0.82 . Table (4) shows the data statistics of water quality parameters used in present study, the optimum correlation equation from rank A in an exponential form with coefficient of determination R2equal to 0.40, was shown in table (5).
The correlation matrix is shown in table (6), and table (7) shows regression variables results and 95% confidence intervals.
Fig (9) shows the plot model of parameters used of Euphrates river at Al Manatherah river station during study period.
Figure (2): Variations of O&G with time compared with some allowable limits according to Iraqi and US Standards in Al Manatherah river station.
*Source: Iraqi environmental legislations book
**Source: Maximum allowable values in United States related to type of use published by California (Liu, 1999).
0 1 2 3 4 5 6 7 8 9
O
ct
N
ov Dec Jen Feb
M
ar Apr
M
ay Jun Jul Aug Sep Oct Nov Dec
O
il
&
G
re
as
e,
m
g/
l
Time, month
O& G Iraqi Stand. US Stand.
X8 Monthly rain totals, (Ra, mm)
Figure (3): Variations of NO3with Time
Figure (4): Variations of pH with Time
0 10 20 30 40 50 60
O
ct
N
ov Dec Jan Feb Mar Apr
M
ay Jun Jul Aug Sep Oct Nov Dec
N
O
3,
m
g/
l
Time, month
NO3 Iraqi Stand.
5 6 7 8 9
O
ct
N
ov Dec Jan Feb
M
ar Apr
M
ay Jun Jul Aug Sep Oct
N
ov Dec
pH
Time, month
pH
INTERNATIONAL REVIEW OF HUMANITIES AND SCIENTIFIC RESEARCH By International Scientific Indexing
ISSN (Online) : 2519-5336 www.irhsr.org
224
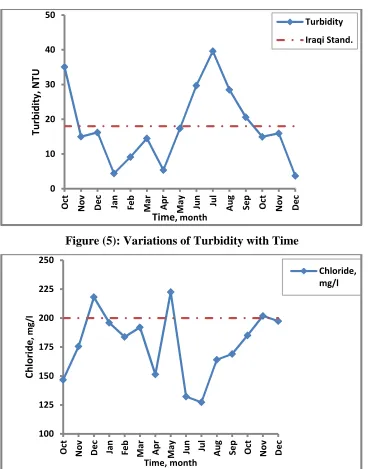
Figure (5): Variations of Turbidity with Time
Figure (6): Variations of Chloride with Time
0 10 20 30 40 50
O
ct
N
ov Dec Jan Feb Mar Apr
M
ay Jun Jul Aug Sep Oct Nov Dec
Tu
rb
id
ity
, N
TU
Time, month
Turbidity Iraqi Stand.
100 125 150 175 200 225 250
O
ct
N
ov Dec Jan Feb
M
ar Apr
M
ay Jun Jul Aug Sep Oct Nov Dec
Ch
lo
rid
e
, m
g/
l
Time, month
Figure (7): Variations of Precipitated Dust Particles with Time
Figure (8): Variations of Temperature, Dust Storm and Rain with Time
0 20 40 60 80 100 120 140 160 180 200
O
ct
N
ov Dec Jan Feb Mar Apr
M
ay Jun Jul Aug Sep Oct Nov Dec
Pr
ec
ip
ita
te
d
Du
st
, g
m
/m
2/
m
on
th
Time, month
Precipitated Dust
0 10 20 30 40 50
O
ct
N
ov Dec Jan Feb
M
ar Apr
M
ay Jun Jul Aug Sep Oct Nov Dec
Time, month
rain totals in December, this agreed well with result gained by Hunter et al., 1979 that presented a relationship between runoff and load.
Figures (3 to 7) show monthly variations with Iraqi standard limits of NO3, pH, T.U., Cl, and PM
during the period of the study. The value of oil &grease 5.9 mg/l in November (2010), increased according to high values of NO3,pH, Cl, and Ra, as a result of sewage from northern drainage
and raw waste water discharged to river affecting of chlorides, nitrates, and oil and grease increasing (Metcalf & Eddy, 2004). Consequently, oil and grease increased with rain since reasons mention above.
The variation of temperature, dust storm and rain with time during the period of the study is given in figure (8). The value of oil &grease reached (5.5 mg/l) in March, increased according to high values of NO3, pH, T.U., Cl, PM, Ra, and high value of DS as a result of contaminants
discharged to river, this agreed very well with the result obtained by (Hunter et al., 1979) that showed of runoff increase the fraction of hydrocarbons associated with the particulates increased. Table (6) shows that the rain has high negative correlation with temperature and turbidity (-0.89 and -0.77) agreed very well Iraqi climatic conditions.
Petroleum hydrocarbons from atmospheric sources (e.g., automobile exhaust fumes) are deposited daily on road surfaces. When it rains, these oily deposits wash into nearby streams (Weiner and Matthews, 2003). This principle agreed well with the statistical analysis of the present study concerning the highest value of oil and grease through raining months and dust storm periods.
6. CONCLUSIONS
The following conclusions are drawn on the basis of the results obtained from the present analysis:
1. Oil and grease ranged in Al Manatherah river station throughout the study period between 0.3-8.3 mg/l, those concentrations range from 3 to 83 times greater than Iraqi standard limits.
2. The highest values of oil and grease 8.3 mg/l measured in October and December related with T.U. and Cl in October through wastewater discharged to river, and with Cl and heavy monthly rain totals in December, caused oil washing into surface water in runoff from roads and parks.
3. The value of oil and grease 6.1 mg/l recorded in May interrelated with increased values of NO3, T.U., Cl, T, and DS. Highest values of NO3, T.U., and Cl, 8.65, 17.35, 222.5,
respectively, registered in same month, increasing concentrations as a result of wastewater discharged from near drainage channel and sewage discharged. Also, oil and grease increased with temperature as a result of oil product used for irrigation of rice crop.
INTERNATIONAL REVIEW OF HUMANITIES AND SCIENTIFIC RESEARCH By International Scientific Indexing
ISSN (Online) : 2519-5336 www.irhsr.org
228 REFERENCES
Mayahi, A. W. T, 2005, "Concentration of total hydrocarbons in some region of Shatt Al-Arab river and its effected on benthic Algae", M. SC. Thesis, College of Agriculture, University of Basrah.
Corbitt, R. A., 2004, "Standard Handbook of Environmental Engineering", Mc Graw-Hill
(www.digitalengineeringlibrary.com).
Duggal, K.N., 2008, "Elements of Environmental Engineering", S. Chand&Company Ltd. (Duggal, K.N., 2008)
Geography Dept., Education faculty for girls / university of kufa, unpublished data.
Hill, M. K., 2004, " Understanding Environmental Pollution", Cambridge university press
Hunter, V., Sabatino, T., Gomperts, R., and MacKenzie, M. J., " Contribution of Urban Runoff to Hydrocarbon Pollution ", Journal (Water Pollution Control Federation), Vol. 51, No. 8 (Aug., 1979), pp. 2129-2138Published by: Water Environment Federation, Stable URL: http://www.jstor.org/stable/25040687.
Kaluarachchi, J. J., and J. C. Parker, 1989, “An efficient finite element method for modeling
multiphase flow”. Water Resources Research, 25, 43-54.
Kiely, G., 1997, "Environmental Engineering", McGraw-Hill, International (UK) Limited. Liu , I., 1999, " Environmental Engineers Handbook", CRC Press LLC
Masters, G, M., and Ela, W., P., 2008, "Introduction to Environmental Engineering and Science",3rdEdition Prentice Hall, Inc. .
Meenambal, T., Uma, R. N., and Murali, K., 2005, "Principles of Environmental Science and Engineering", S. Chand & Company LTD, New Delhi.
Metcalf & Eddy, 2004, " Wastewater Engineering Treatment And Reuse", Fourth Edition, McGraw-Hill.
Ministry of environment, Iraq, Iraqi environmental legislations book.
Nathanson, J. A., 2000." Basic environmental technology", Prentic-Hall, Inc.
Nemerow, N. L., 1971, "liquid waste of industry, theories, practices, and treatment", Addison-Wesley P
Pankratz, T. M.,2001, "Environmental Engineering Dictionary and Directory " ,CRC Press LLC.
Reis, J. C., 1996, "Environmental Control in Petroleum Engineering", Gulf Publishing company, Houston, Texas.
Singh, G. and Singh, J., 2007, "Water Supply and Sanitary Engineering", Nem Chand Jain, Delhi.
Sleep, B. E., and J. F. Sykes, 1993, “Modeling the transport of volatile organics in variable
saturated media”. Water Resources Research, 29(3), 705-722.
Stapleton, R. M., Hemminger, P., Senecah, S. L., 2004, " Pollution A to Z”, by Macmillan
Reference USA.
Steel, E. W., and McGhee, T. J., 1979, " Water Supply and Sewerage", Fifth Edition, McGraw-Hill.
Weiner, R. E, And Matthews, R. A. , 2003, "Environmental Engineering", Fourth Edition, Elsevier Science (USA).
Table (3): Variance analysis of variables in Al Manatherah river station Variance Analysis
Source DF Sum of Squares Mean Square F Ratio Prob(F)
Regression 8 35.720 4.465 0.503 0.819
Error 6 53.250 8.876
Total 14 88.979
Table (4): Data statistics of variables in Al Manatherah river station
Statistics
Variable X1 X2 X3 X4 X5 X6 X7 X8 Y
No. of Pts 15 15 15 15 15 15 15 15 15
Miss Pts 0 0 0 0 0 0 0 0 0
Max.
Value 9 8.75 39.6 222.5 181.29 46.3 3.5 20.7 8.3
Min.Value 2.68 6.79 3.7 127.3 9.31 18.2 0 0 0.3
Range 6.32 1.96 35.9 95.2 171.98 28.1 3.5 20.7 8
Average 7.132 7.886 18.004 177.499 49.745 30.033 0.8 9.107 3.93 Stad. Dev. 1.786 0.563 10.951 28.998 51.335 10.103 1.207 7.566 2.521
Table (5): Model selected of variables in Al Manatherah river station
R
an
k
Model Std
E
rr
o
r
R
es
id
u
al
Su
m
R
es
id
u
al
A
v
g
.
R^2 1 exp(a*x1+b*x2+c*x3+d*x4+e*x5+f*x6+g*x7+h*x8+i) 2.98 3.03 0.20 0.40
INTERNATIONAL REVIEW OF HUMANITIES AND SCIENTIFIC RESEARCH By International Scientific Indexing
ISSN (Online) : 2519-5336 www.irhsr.org
230
E-15 E-16
3 a*x1+b*x2+c*x3+d*x4+e*x5+f*x6+g*x7+h*x8 3.04 0.09 0.0 0.27
Table (6): Correlation matrix of variables in Al Manatherah river station
C. Ma.
X1,NO3 X2,pH X3,TU X4,Cl X5,PM X6,T X7,DS X8,Ra Y,O&G
X1,NO3 1
X2,pH 0.561 1
X3,TU 0.019 -0.099 1
X4,Cl -0.054 0.013 -0.626 1
X5,PM 0.327 0.011 -0.199 -0.146 1
X6,T 0.112 -0.397 0.629 -0.530 0.163 1
X7,DS 0.435 0.113 -0.076 -0.116 0.867 0.221 1
X8,Ra -0.006 0.352 -0.769 0.612 -0.061 -0.893 -0.103 1
Y,O&G 0.107 0.051 -0.158 0.180 0.084 -0.083 -0.013 -0.032 1
Table (7): Regression coefficients results and 95%confidence intervals Regression Variable Results
Var. Value Standard Error t-ratio Prob(t)
a 0.109959435 0.184428327 0.59621771 0.57282 b -0.281733672 0.518958156 -0.542883214 0.60677 c -0.056259417 0.048498895 -1.160014428 0.29011 d 0.009213901 0.010342388 0.890887161 0.40729 e 0.002291032 0.009243516 0.247852859 0.81251 f -0.117997699 0.091729839 -1.286361133 0.24572 g -0.053879854 0.420470871 -0.128141704 0.90222 h -0.187452108 0.125311655 -1.495887263 0.18532 i 7.124588788 6.372811697 1.117966312 0.30634
95% Confidence Intervals