Pak. J. Anal. Environ. Chem. Vol. 11, No. 2 (2010) 1 – 11
Physicochemical Assessment of Surface and Groundwater
Quality of the Greater Chittagong Region of Bangladesh
M. J. Ahmed
1*, M. R. Haque
1, A. Ahsan
2, S. Siraj
2, M. H. R. Bhuiyan
3,
S. C. Bhattacharjee
3and S. Islam
31Laboratory of Analytical Chemistry, Department of Chemistry, University of Chittagong, Chittagong-4331, Bangladesh, 2ARD, BCSIR Laboratoires, Dhaka, Bangladesh.
3BCSIR Laboratoires, Chittagong, Bangladesh.
--- --- Abstract
The study was carried out to assess surface and groundwater quality of the greater Chittagong (Chittagong and Cox’s Bazar districts) and Chittagong Hill Tracts (Rangamati, Khagrachhari and Bandarban districts) of Bangladesh. To study the various physicochemical and microbiological parameters, surface water samples from the Karnafuli, Halda, Sangu, Matamuhuri, Bakkhali, Naf, Kasalong, Chingri and Mayani Rivers, Kaptai Lake and groundwater samples from almost every Upazilas, smaller administrative unit of Bangladesh, were collected and analyzed. The statistical methods of sampling were used for collecting samples. Samples were preserved using suitable preservation methods. Water samples from the freshwater resources were collected from different points and tide conditions and at different seasons for continuous monitoring during the hydrological years 2008-2009. The collected samples were analyzed for the following parameters: pH, electrical conductivity (EC), total dissolved solids (TDS), total suspended solids (TSS), total solids (TS), dissolved oxygen (DO), transparency, acidity, dissolved carbon dioxide, total alkalinity, total hardness, chloride, ammonia-N, hydrogen sulfide, sulphate-S, o-phosphate-P, biochemical oxygen demand (BOD), chemical oxygen demand (COD), nitrate-N, nitrite-N, total nitrite and nitrate-N, arsenic, iron, manganese, copper, nickel, chromium, cadmium, lead, calcium, magnesium, sodium and potassium using the procedure outlined in the standard methods. Average values of maximum physicochemical and microbiological parameters studied for the Karnafuli River were found higher than the World Health Organization (WHO) guideline. The maximum water quality parameters of Kaptai Lake and other Rivers of Chittagong region were existed within the permissible limits of WHO guideline. The data showed the water quality slightly differs in pre-monsoon and post-monsoon than monsoon season. The concentration of different constituents of most of the groundwater samples were within the permissible limits of BSTI drinking water quality guideline except As, Fe, and Mn. Results of water quality assessment identified the problem areas in respect of arsenic. The results also provided data to understand and quantify the threat of the impact of climate change on freshwater resources of this region. The results also provided data for water quality of surface and groundwater resources of Chittagong region to match national and international standards for drinking, agricultural, industrial and livestock requirements.
Keywords: Physicochemical assessment, Freshwater resources, Greater Chittagong region.
--- ---
Introduction
Chittagong region consists of Chittagong, Cox’s Bazar, Bandarban, Rangamati and Khagrachhari
districts. This region is quite different from other parts of Bangladesh for its unique natural beauty
characterized by hills, rivers, lakes, sea, forests and valleys. Main rivers of this region are the Karnafuli, Halda, Sangu, Matamuhuri, Bakkhali, Naf, Kasalong, Chingri, Mayani and Kaptai lake. The main seaport of Bangladesh is located at the estuary of the Karnafuli River. Chittagong is also called the commercial capital of Bangladesh. A large number of chemical and fertilizer industries have been established since the independence on both the banks of the Karnafuli. Effluents from these industries are reportedly being directly discharged into this river. Huge amount of solid wastes and effluents are discharged through Chaktai, Sundari, Noakhal, Mazirghat, Gupta, Mohesh, Shikalbhaha and Ferighat canals into the Karnafuli River; as a result pollution of this river is increasing day by day. Leaking and leaching of oil from ships and boats are also polluting the water of the Karnafuli River. Due to the climate change during flood, soil erosion and land slide increases the suspended solids, metallic and other pollutants. Halda, a tidal river, is the only natural breeding ground for carps of Bangladesh, affected by the polluted water of the Karnafuli river. Due to the sea level rise, during the dry season, sea water intrusion into the Halda, Karnafuli, Sangu and Naf rivers will destroy the biodiversity of these rivers for increasing salinity. Kaptai Lake is the largest artificial freshwater reservoir in Bangladesh. Though created for power generation, it contributes to produce significant quantity of freshwater fishes, navigation, flood control, household, agriculture etc. and thus water of this lake getting polluted. Boating activities for fishing and boat repairing activities may also cause the contamination; this phenomenon is also reported in literature for evaluation of pollution in other Lakes [1]. Heavy metal contamination in water is an increasing worldwide environmental concern. At present the underground water is not safe for drinking purpose because of arsenic contamination [2]. Degradation of water quality, depletion of water resources and loss of aquatic biodiversity are prominent features of the environmental landscape requiring urgent attention at global and national scales [3]. Therefore, physicochemical assessment and monitoring of surface and groundwater resources of this region using simple and rapid methods is of paramount importance.
Experimental section
Collection and preservation of samples
samples were collected within 3-9 inches from the surface of the water. Groundwater samples were collected from tube wells after discarding water for the first 2 minutes. The samples were mixed well and a sample of 1.0-1.5 L was transferred to an amber coloured clean plastic bottle for analysis in the laboratory. Samples were preserved using suitable preservation techniques [4, 5].
Figure 1. Surface water sample collection points of the greater Chittagong region.
Materials and Methods
Different water quality parameters were
determined using the following methods
A glass thermometer was used for the measurement of temperature. Transparency was measured by Sacchi disc. pH, EC and TDS were measured at the sampling site by Hanna Combo meter, Model – HI 98129. TS and TSS were measured by drying and weighing method. Measurement of DO was done by Jenway 970 DO2
meter at the sampling site. BOD was measured from the differences of initial and 5 day, DO by DO2 meter. COD was determined by titrimetric
Spectrophotometry and atomic absorption spectrophotometry samples were digested according to the wet-digestion method [8]. Coli form was measured by MPN method [9]. Data were analysed by Excel 2000 software. SPSS 11.5 software was used for statistical analysis, such as, seasonal variation and Pearson correlation. Pearson correlation establishes relationship between the parameters of water quality i.e. whether a parameter increases or decreases with the increase and decrease of other parameters.
Reagents and solutions
All chemicals used were of analytical - reagent grade or the highest purity available.
Doubly distilled de-ionized water was used throughout this study.
Results
The results of surface water resources are shown in Table 1 and 3 and seasonal variation shown in Table 2 and groundwater resources shown in Table 4. The results of Pearson Correlations among the different parameters of the Halda, Karnafuli River and groundwater are shown in Table 5, 6, 7, respectively.
Table 1. Water quality of the Halda and Karnafuli river.
Parameters
Halda
WHO Standard
Karnafuli
Present study Previous study
[10] Present study
Previous Study [11]
Ambient temp/0C 22.30-35.50 ND - 18.25-35.00 ND
Water temp/0C 20.30-36.10 22-30 - 19.50-34.30 ND
pH 7.03-8.60 5.65-7.34 NYS 6.36-9.86 7.01-8.24
EC./µScm-1 72.00-414.00 ND 800-1000 90.00-45600.00 100-26150
TDS/mgL-1 30.00-200.00 ND -- 45.00-20000.00 ND
TSS/mgL-1 20.00-653.00 ND -- 14.40-5100.00 ND
TS/mgL-1 100.00-740.00 ND -- 46.00-27700.00 ND
DO/mgL-1 3.02-9.90 ND 4-6 0.00-7.91 3.20-7.20
Transparency/cm 8.00-39.00 ND -- 1.50-150.00 ND
Acidity/mgL-1 2.12-35.36 ND -- 1.60-52.25 ND
CO2/mgL-1 1.87-16.61 ND 6 1.41-49.98 ND
P.alkalinity/mgL-1 0.00 ND -- 0.00 ND
T.Alkalinity/mgL-1 6.28-90.78 22-72 -- 5.64-121.00 32.10-84.70
T. Hardness /mgL-1 9.00-380.00 30-62 80-120 10.00-4500.00 39.50-3700.00
Chloride/mgL-1 2.41-73.50 3.00-7.00 600 2.09-13147.70 1.50-10196.84
H2S/mgL-1 0.21-1.60 ND -- 0.00-6.39 ND
NH3- -N/mgL-1 .00 0.51-0.49 0.2-5 0.01-0.08 BDL-7.91
BOD/mgL-1 0.70-5.08 ND 6 0.21-9.17 ND
Table 1.Water quality of the Halda and Karnafuli river (continued).
Parameters Halda WHO
Standard
Karnafuli
Present study Previous study [10] Present study Previous Study 11]
NO2- -N/mgL-1 BDL-0.87 ND 0.03 0.00-5.18 BDL-0.09
NO3- -N/mgL-1 0.00 ND NYS 0.00-1.63 BDL-1.45
NO2-+NO3- -N/mgL-1 0.14-04.90 0.61-1.11 -- 0.54-14.60 ND
PO43- -P/mgL-1 0.73-4.28 0.09-0.40 0.8 0.12-4.94 BDL-7.60
SO42--S/mgL-1 BDL-95.52 ND -- 9.26-977.08 8.50-1250.70
Zn/mgL-1 0.04-.80 ND -- 0.01-0.04 0.02-0.45
Cu/mgL-1 BDL-0.07 ND <0.4 0.01-0.03 0.02-4.23
Co/mgL-1 0.01-0.04 ND -- BDL BDL-0.02
Cr/mgL-1 BDL-0.01 ND NYS BDL-0.01 0.02-0.35
Cd/mgL-1 BDL ND NYS BDL BDL-0.01
Pb/mgL-1 BDL-0.07 ND 0.05 BDL-0.02 BDL-0.11
Fe/mgL-1 0.25-5.94 0.99-2.5 NYS 0.06-3.24 0.01-9.35
Mn/mgL-1 0.122.93 ND 0.1-1 BDL-0.92 0.02-2.59
%NaCl BDL-0.40 ND -- 0.20-19.10 ND
Coliform/100mL ≥1600 ND 5000 ≥1600 ND
BDL= Below Detection Level, ND= Not Done
Table 2. Seasonal variation of the Halda and Karnafuli river water quality.
Parameters Seasons Halda Karnafuli
Min. Max. Min. Max.
pH
Pre-monsoon 7.03 8.60 7.15 8.12
Monsoon 7.25 7.93 6.36 9.86
Post-monsoon 7.10 7.95 7.20 8.40 EC
Pre-monsoon 106.10 194.50 90.00 36325.00 Monsoon 72.00 172.00 99.00 25300.00 Post-monsoon 78.00 414.00 93.00 45600.00 DO
Pre-monsoon 3.02 8.32 .00 6.33
Monsoon 3.34 7.15 2.15 6.50
Post-monsoon 4.05 9.90 3.25 7.91 Carbon dioxide
Pre-monsoon 1.87 11.09 1.41 13.31
Monsoon 3.70 12.46 4.47 13.40
Post-monsoon 3.17 16.61 3.12 49.98
Total alkalinity
Pre-monsoon 6.28 90.78 5.64 119.00 Monsoon 23.60 89.60 16.29 104.00 Post-monsoon 30.60 64.40 24.00 121.00
Total hardness
Pre-monsoon 10.00 84.00 16.00 4000.00 Monsoon 9.00 380.00 10.00 2380.00 Post-monsoon 17.00 88.00 22.00 4500.00 Chloride
Pre-monsoon 3.56 36.30 2.09 13147.70
Monsoon 7.34 39.02 3.21 10125.94
Post-monsoon 2.41 73.50 7.00 12120.20 BOD
Pre-monsoon 1.37 5.08 0.22 9.17
Monsoon 1.42 3.12 0.21 6.22
Post-monsoon 0.70 2.88 11.39 122.46 Nitrite-N
Pre-monsoon 0.09 0.87 1.01 3.89
Monsoon 0.00 0.59 .00 5.18
Post-monsoon 0.16 0.17 1.60 14.60
o-Phosphate-P
Pre-monsoon 1.52 4.28 2.00 3.37
Monsoon 0.43 0.64 0.12 4.94
Post-monsoon 0.73 0.97 9.26 212.81 Sulphate-S
Pre-monsoon 8.64 95.52 152.08 974.10
Monsoon 0.00 6.62 28.55 977.08
Post-monsoon 4.48 12.59 9.26 32.87 Fe
Pre-monsoon 0.51 4.66 0.06 2.30
Monsoon 0.79 4.05 0.40 2.72
Post-monsoon 0.25 5.94 0.23 3.24 Mn
Pre-monsoon 0.12 2.37 0.01 0.92
Monsoon 0.33 2.93 0.22 0.45
Table 3. Water quality of other rivers of the greater Chittagong region.
Parameters Sangu Kaptai
Lake
Matamu-huri Naf Bakkhali Kasalong Chingri
pH 7.66 7.90 7.71 7.73 9.55 7.69 7.31
EC./µScm-1 270.90 85.87 237.50 49300.00 353.00 235.90 170.90
TDS/mgL-1 135.32 41.33 118.55 24700.00 171.00 117.70 85.50
DO/mgL-1 5.83 6.85 5.64 7.56 6.96 5.36 4.91
Transparency/cm 35.00 82.00 64.00 26 16.00 66 47
Acidity/mgL-1 3.09 10.08 ND ND ND ND ND
T.Alkalinity/mgL-1 146.52 53.62 113.55 153.52 146.85 128.16 96.12
T. Hard ness/mgL-1 160.00 27.62 84.00 5840.00 220.00 84.00 60.00
Chloride/mgL-1 14.35 3.96 13.88 21720.92 62.96 8.61 6.70
BOD/mgL-1 2.24 1.27 3.60 6.92 7.40 2.34 2.79
NO2- -N/mgL-1 0.01 0.01 ND ND ND ND ND
NO3- -N/mgL-1 0.25 0.44 ND ND ND ND ND
o-PO43- -P/mgL-1 1.13 2.36 2.85 0.43 1.50 0.64 0.32
SO42- -S/mgL-1 4.66 6.79 7.41 1411.73 1.54 3.09 3.09
Ni/mgL-1 ND BDL ND ND ND ND ND
Zn/mgL-1 ND 0.037 ND ND ND ND ND
Cu/mgL-1 ND BDL ND ND ND ND ND
Co/mgL-1 ND BDL ND ND ND ND ND
Cr/mgL-1 ND 0.004 ND ND ND ND ND
Cd/mgL-1 ND BDL ND ND ND ND ND
Pb/mgL-1 ND BDL ND ND ND ND ND
Fe/mgL-1 0.60 1.71 1.47 0.52 2.05 BDL 1.65
Mn/mgL-1 0.37 0.82 0.02 1.01 0.84 0.50 0.06
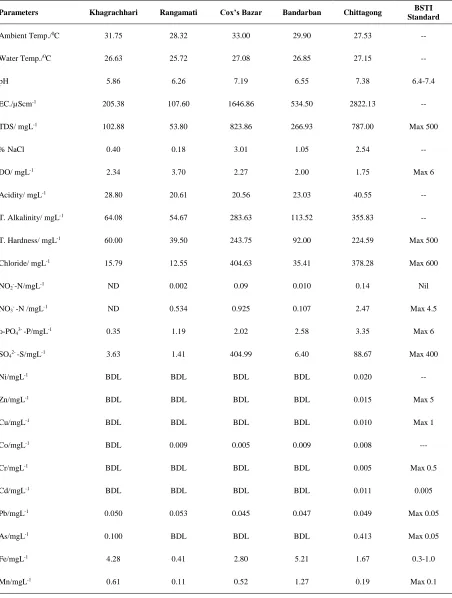
Table 4. Groundwater quality of the greater Chittagong region.
Parameters Khagrachhari Rangamati Cox’s Bazar Bandarban Chittagong BSTI
Standard
Ambient Temp./0C 31.75 28.32 33.00 29.90 27.53 --
Water Temp./0C 26.63 25.72 27.08 26.85 27.15 --
pH 5.86 6.26 7.19 6.55 7.38 6.4-7.4
EC./µScm-1 205.38 107.60 1646.86 534.50 2822.13 --
TDS/ mgL-1 102.88 53.80 823.86 266.93 787.00 Max 500
% NaCl 0.40 0.18 3.01 1.05 2.54 --
DO/ mgL-1 2.34 3.70 2.27 2.00 1.75 Max 6
Acidity/ mgL-1 28.80 20.61 20.56 23.03 40.55 --
T. Alkalinity/ mgL-1 64.08 54.67 283.63 113.52 355.83 --
T. Hardness/ mgL-1 60.00 39.50 243.75 92.00 224.59 Max 500
Chloride/ mgL-1 15.79 12.55 404.63 35.41 378.28 Max 600
NO2--N/mgL-1 ND 0.002 0.09 0.010 0.14 Nil
NO3- -N /mgL-1 ND 0.534 0.925 0.107 2.47 Max 4.5
o-PO43- -P/mgL-1 0.35 1.19 2.02 2.58 3.35 Max 6
SO42- -S/mgL-1 3.63 1.41 404.99 6.40 88.67 Max 400
Ni/mgL-1 BDL BDL BDL BDL 0.020 --
Zn/mgL-1 BDL BDL BDL BDL 0.015 Max 5
Cu/mgL-1 BDL BDL BDL BDL 0.010 Max 1
Co/mgL-1 BDL 0.009 0.005 0.009 0.008 ---
Cr/mgL-1 BDL BDL BDL BDL 0.005 Max 0.5
Cd/mgL-1 BDL BDL BDL BDL 0.011 0.005
Pb/mgL-1 0.050 0.053 0.045 0.047 0.049 Max 0.05
As/mgL-1 0.100 BDL BDL BDL 0.413 Max 0.05
Fe/mgL-1 4.28 0.41 2.80 5.21 1.67 0.3-1.0
Mn/mgL-1 0.61 0.11 0.52 1.27 0.19 Max 0.1
Table 5. Pearson correlations among the different parameters of the Halda river water.
pH EC DO Acidity T.A T.H Cl- PO
43--P SO42--S Fe Mn
pH 1 -.108 .663(**) -.298 .360(*) -.145 -.451(**) -.252 -.225 .346 -.235
EC -.108 1 .285 .049 .260 .135 .804(**) -.479 -.122 .264 .169
DO .663(**) .285 1 -.100 .181 -.040 -.082 -.894 -.292 .312 -.366
Acidity -.298 .049 -.100 1 -.032 .622(**) .255 -.733 -.225 -.118 .092
TA .360(*) .260 .181 -.032 1 .113 .134 .632 -.046 .112 .023 T.H -.145 .135 -.040 .622(**) .113 1 .489(**) -.992(*) -.160 -.134 .374
Cl- -.451
(**) .804(**) -.082 .255 .134 .489(**) 1 -.998(*) .028 -.190 -.032
PO43—P -.252 -.479 -.894 -.733 .632 -.992(*) -.998(*) 1 .679 -.538 -.578
SO42—S -.225 -.122 -.292 -.225 -.046 -.160 .028 .679 1 -.094 -.851(*)
Fe .346 .264 .312 -.118 .112 -.134 -.190 -.538 -.094 1 .685(**)
Mn -.235 .169 -.366 .092 .023 .374 -.032 -.578 -.851(*) .685(**) 1
**Correlation is significant at the 0.01 level (1-tailed), *Correlation is significant at the 0.05 level (1-tailed). TA= Total Alkalinity, TH= Total Hardness
Table 6. Pearson correlations among the different parameters of the Karnafuli river water.
pH EC DO Acidity T.A T.H Cl- PO43--P SO42-- S Fe Mn
pH 1 .280(*) .196 .310(*) .335(**) .432(**) .255(*) -.246 .614(**) .076 -.403 EC .280(*) 1 .250(*) .379(**) .279(*) .972(**) .964(**) -.552(*) .899(**) -.099 -.545(*) DO .196 .250(*) 1 .075 -.073 .266(*) .244(*) -.180 .509(*) -.017 -.580(*) Acidity .310(*) .379(**) .075 1 .204 .335(**) .274(*) .417 -.134 -.085 .671(**) T.A .335(**) .279(*) -.073 .204 1 .379(**) .292(*) .026 .180 -.290(*) -.032 T.H .432(**) .972(**) .266(*) .335(**) .379(**) 1 .980(**) -.505(*) .905(**) -.025 -.768(**) Cl- .255(*) .964(**) .244(*) .274(*) .292(*) .980(**) 1 -.482(*) .887(**) .043 -.739(**)
PO43—P -.246 -.552(*) -.180 .417 .026 -.505(*) -.482(*) 1 -.433 .296 .633(*)
SO42—S .614(**) .899(**) .509(*) -.134 .180 .905(**) .887(**) -.433 1 -.007 -.243
Fe .076 -.099 -.017 -.085 -.290(*) -.025 .043 .296 -.007 1 -.296 Mn -.403 -.545(*) -.580(*) .671(**) -.032 -.768(**) -.739(**) .633(*) -.243 -.296 1
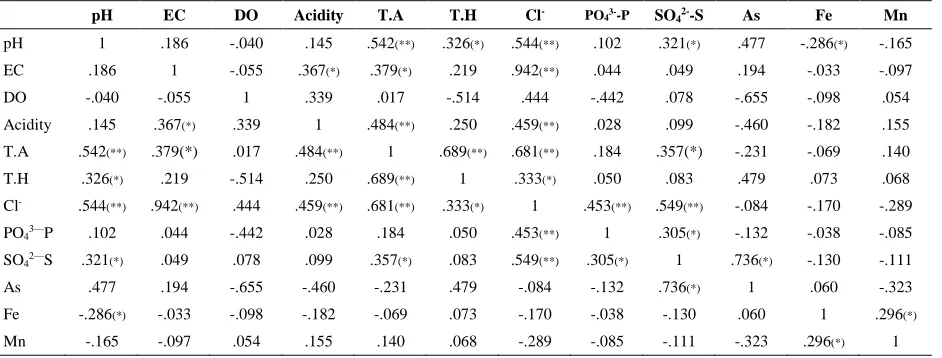
Table 7. Pearson Correlations among the different parameters of groundwater.
pH EC DO Acidity T.A T.H Cl- PO
43--P SO42--S As Fe Mn
pH 1 .186 -.040 .145 .542(**) .326(*) .544(**) .102 .321(*) .477 -.286(*) -.165
EC .186 1 -.055 .367(*) .379(*) .219 .942(**) .044 .049 .194 -.033 -.097 DO -.040 -.055 1 .339 .017 -.514 .444 -.442 .078 -.655 -.098 .054 Acidity .145 .367(*) .339 1 .484(**) .250 .459(**) .028 .099 -.460 -.182 .155
T.A .542(**) .379(*) .017 .484(**) 1 .689(**) .681(**) .184 .357(*) -.231 -.069 .140 T.H .326(*) .219 -.514 .250 .689(**) 1 .333(*) .050 .083 .479 .073 .068 Cl- .544(**) .942(**) .444 .459(**) .681(**) .333(*) 1 .453(**) .549(**) -.084 -.170 -.289
PO43—P .102 .044 -.442 .028 .184 .050 .453(**) 1 .305(*) -.132 -.038 -.085 SO42—S .321(*) .049 .078 .099 .357(*) .083 .549(**) .305(*) 1 .736(*) -.130 -.111
As .477 .194 -.655 -.460 -.231 .479 -.084 -.132 .736(*) 1 .060 -.323 Fe -.286(*) -.033 -.098 -.182 -.069 .073 -.170 -.038 -.130 .060 1 .296(*)
Discussion and Conclusions
From the present physicochemical study of the water quality of the Chittagong region, it can be concluded that the condition of the Karnafuli River is critical and Halda River may be affected by the polluted Karnafuli River water. Decreasing trend of DO of the Karnafuli River water was observed from the present and previous study [11]. Minimum DO value found for the Karnafuli River was as low as 0 mgL-1. This indicates the critical
condition of this River. Similar situation was observed by Gasim [12]. Alam et al. [13], reported DO values in the range (2.74-5.12 mgL-1) and
(3.95-5.97 mgL-1) for river water samples and
(3.73-5.01 mgL-1) and (5.04-5.49 mgL-1) for lake
water samples in the dry and rainy seasons, respectively. Only tidal cycle is keeping the Karnafuli River alive. If there were no tidal cycle, the Karnafuli would have been turned into a dead River like Buriganga and Turag of Dhaka. The development of strong institutional mechanisms is necessary to facilitate the sustainable management of resources and to prevent further deterioration of the environment [14].
The Karnafuli and Halda River water quality significantly varied with seasons, tide conditions and locations. From the location dependent variation it can be concluded that effect of sea water reaches up to the Kalurghat point. So there is possibility of destroying biodiversity of the Halda River by the intrusion of polluted Karnafuli River water in the pre-monsoon period at high tide. Due to this, spawning of carps are decreasing gradually and lesser quantities of fish eggs are being harvested nowadays.
Toxic metals pollution is not predominant in the Karnafuli and Halda River water as the toxic metals were found within the acceptable limit for surface water. Manganese content of the Halda and Karnafuli River was found slightly higher than the permissible limit. The average values of manganese in Turag, Buriganga and Shitalakhya were reported by Hossain [15] as 63.10, 33.10 and 192.27 µg L-1, respectively. Maximum EC, TDS,
Hardness, chloride and sulphate-S values of the Karnafuli River water were found at the estuary and decreases gradually with the distance from the estuary. Phenolphthalein alkalinity was not
detected in any of the samples analyzed. So alkalinity of the Halda, Karnafuli, Sangu, Kaptai Lake and also for groundwater samples is mainly for carbonates and bicarbonates [16]. Mean pH value of the Naf River water (Table 3) was found in the alkaline range. Similar pH values 7.5-8.5 were reported by Chowdhury et al. [17], for the Naf River.
Higher BOD values found at Sadarghat (9.17mgL-1) and Chandraghona (6.22 mgL-1)
points of the Karnafuli River indicates that these two sites are severely polluted by the wastes and effluents of the industries and Chittagong City Corporation area and Karnafuli Paper Mill (KPM), respectively. o-phosphate-P of the Karnafuli and Halda was found in the range (0.73-4.28 mgL-1)
and (0.12-4.94 mgL-1), respectively, which is
higher than permissible limit. Higher values may be due to the washing out of fertilizer from agricultural fields and detergents used in household purposes which ultimately disposed off into the Rivers water. Carbon dioxide found for the Halda (max 16.61 mgL-1), Kaptai Lake (max 14.00
mgL-1), Karnafuli (max 49.98 mgL-1) exceeds the
limit (6 mgL-1) of surface water. Comparison of the
water quality of the Halda, Karnafuli and other rivers (Table-4) shows that Karnafuli is the most polluted among the Rivers of Chittagong region.
From the pH value of the groundwater samples it is observed that lowest value is found in samples collected from Khagrachhari districts, which is far below the permissible limit. Iron content of groundwater samples of this region (Khagrachhari 5.72 mg L-1, Cox's Bazar 10.38
mgL-1, Bandarban 11.53 mg L-1, Chittagong 4.93
mg L-1) exceeds the Bangladesh standard for
drinking water (0.3-1.0 mg L-1). Chittagong region
groundwater also contains arsenic (max 0.5 mgL-1)
exceeding the BSTI limit (0.05mgL-1) and WHO
limit (10 µgL-1) for drinking water. Miah et al.
[18], reported that irrigation with high arsenic water (>100µgL-1) is positively related to the high
arsenic content in wetland rice. Groundwater samples of Mirsharai and Sandwip contained arsenic (max 0.5 mgL-1) exceeding the WHO
tolerance limit (0.01 mgL-1) for drinking water.
limit. Some groundwater samples contained nitrite-N (max 0.14 mg L-1) exceeding the limit of BSTI
limit for drinking water.
In groundwater samples used for drinking purposes coli form should not be present but some samples contained coli form (<2-2/100mL). Nitrate-N of the groundwater samples were found for the Chittagong region (0.11-2.47 mgL-1).
Bashar et al. [20] reported that nitrate-N is the most prevalent form of nitrogen compound in groundwater and (1.1-1.8 mgL-1) in Maddhayapara
Granite mine area of Dinajpur district.
From the Pearson Correlations of the Halda (Table 5), Karnafuli (Table 6) and groundwater (Table 7) samples of this region it can be concluded that correlation of different parameters from different sources differs significantly e.g. pH of the Halda River water was found positively correlated with DO and alkalinity and negatively correlated with chloride but the Karnafuli River water pH was found positively correlated with EC, acidity, total alkalinity, total hardness, chloride and sulphate-S.
Recommendations
1. From the present study it is found that the Karnafuli River water becomes polluted from Industrial, municipal and agricultural sources. Industrial and municipal effluents must be discharged into the River after proper treatment. Many industries have effluent treatment plants, but they are not using it. 2. The Chittagong Municipal Authority and
Department of Environment (DoE) should take a lead role in organizing a concrete and concerted effort with other Government and non-Government agencies in solving the problems of the Karnafuli River as soon as possible.
3. Steps must be taken to save the Halda River from getting polluted by the Karnafuli River water especially in the pre-monsoon season when flow of this River decreases. Proper law should be passed and implemented, so that authority can take necessary action against the industries and bodies responsible for polluting the Rivers. The community people should be mobilized in such efforts, because people’s
participation is very much fruitful in improving the environmental situation. 4. Government should take necessary steps to
supply safe drinking water in the hilly regions. Arsenic prone areas such as Sandwip, Mirsharai and Sitakundu should be provided with safe drinking water from deep tube-wells. 5. Steps must be taken for using rain water, after preserving in tanks and ponds in the rainy season, as alternate source of groundwater. 6. Government of Bangladesh should be taken
proper action for making new national and regional policies and appropriate preventive measures on the basis of assessment data prior further deterioration of water quality.
7. The Public awareness should be increased of the risk and affected areas so that they could ready to face the disaster due to Climate change.
Acknowledgements
The authors are grateful to the Ministry of Science, Information and Communication Technology for financial assistance to complete this project. The authors would also like to express sincere thanks to the Ministry of Education and Bangladesh University Grants Commission for sanctioning deputation and granting scholarship, respectively to one of us (M. Reazul Haque).
References
1. M. B. Arain, T. G. Kazi, M. K. Jamali, H. I. Affidi, J. A. Baig, N. Jalbani and A. Q. Shah,
Pak. J. Anal. Environ. Chem., 9 (2008) 101.
2. M. Z. Islam, M. A. Azim, R. Islam and S. B. Quraishi, Journal of Bangladesh Academy
of Sciences, 32 (2008) 13.
3. M. Alkins-Koo, F. Lucas, L. Maharaj, S. Maharaj, D. Phillip, W. Rostant and S. Surujdeo-Maharaj, Ecological Indicators, 8 (2008) 709.
4. S. Mitra (Ed.), Sample Preparation
Techniques in Analytical Chemistry, Wiley
Interscience, New Jersey (2003) 14.
5. APHA, Standard Methods for the
Examination of Water and Wastewater (18th
6. G. N. Chattopadhyay, Chemical Analysis of
Fish Pond Soil and Water, Daya Publishing
House, New Delhi-110035, (1998) 68. 7. A. K. De, Environmental Chemistry, 4th
edn, New Age International Publication, (2000) 246.
8. S. M. Flanagan, D. L. Montgomery and J. D. Ayotte, US. Geological Survey,
Water-Resources Investigations Report 01-4042,
(2001) 12.
9. L. S. Clesceri, A. L Greenberg and A. D. Eton (Eds.), Standard Methods for the
Examination ofWater and Wastewater (20th
edition), APHA, New York, (1998).
10. M. A. Majid, M. R. Haque and S. K. Sharma, The Chittagong Univ. J. Sci., 23 (1999) 23.
11. M. A. Majid and Swapan K. Sharma,
Journal of the Bangladesh Chemical Society,
12 (1999) 17.
12. M. B. Gasim, B. S. Ismail, E. Toriman, S. I. Mir and T. C. Chek, Global Journal of
Environmental Research, 1 (2007) 7.
13. M. M. Alam, M. A. Islam, S. Islam and S. Z. Haider, Journal of the. Bangladesh
Chemical Society. 8 (1996) 129.
14. C. I. Viju, Journal of Environmental
Management, 45 (1995) 319.
15. Md. A. Hossain, M. A. Rahman, N. Sidique and A. M. S. Alam, Dhaka Univ. J. Sci. 57 (2009) 153.
16. N. Manivasakam, Physicochemical
Examination of Water, Sewage and
Industrial Effluents, 2nd edn., Pragati
Prakashan, (2000) 47.
17. M. S. N. Chowdhury, M. S. Hossein, S. R. Chowdhury and N. G. Das, Bangladesh
Journal of Marine Sciences and Fisheries, 1
(2009) 1.
18. M. A. M. Miah, Z. U. Ahmed, M. S. Rahman and H. M. Khaled, Bangladesh J.
Sci. Res. 21 (2008) 35.
19. I. M. M. Rahman, M. A. Majid, M. Nazimuddin and A. S. M. S. Huda, The
Chittagong Univ. J. Sci., 27 (2003) 7.
20. K. Bashar, M. R. Karim, M. S. Hossain, D. A.Chowdhury, M. S. Rahman and M. N. Chowdhury, Bangladesh Geosciences