DOI: 10.30954/0424-2513.1.2019.26
©2019 New Delhi Publishers. All rights reserved
Democratic Values, Freedom, Control and Life Satisfaction
Suraj Sharma
Department of Economics, S.M. College, Chandausi, Uttar Pradesh – 244412 (Affiliated to M.J.P. Rohilkhand University, Bareilly, Uttar Pradesh, India)
Corresponding author: surajsharma1903@gmail.com
ABSTRACT
The present study tries to measure the level of life satisfaction for individuals from Asia & Australasia and capture the determinants in deciding one’s satisfaction level. The study hypothesized that whether democratic values and ethics play a significant role in determining one’s level of life satisfaction and for testing the same on econometric tools the study presents the methodology and conceptual framework in subsequent sections. The study uses the latest wave (wave six) of World Value Survey which was conducted during 2010-14.
Results show that democratic values affect SWB most significantly and found to be the strongest predictor of SWB, however, this relation is insignificant with positive signs for Hybrid democracies. Importance to politics and religion results in decreased odds of SWB for Full and Flawed democracies but here too the relationship is opposite in case of Hybrid democracies resulting in increased SWB for every scale increase in importance to politics and religion. Tax cheating attitude is found to be negatively accounting for SWB in case of Full and Hybrid democracies where trust on national institutions (particularly in Full democracies) is a virtue and results in increased odds of SWB, this relation is very opposite in case of Flawed democracies where cheat on tax is associated with increased odds of SWB and increased trust in national institutions results in decreasing SWB. The study suggests that contemporary governments should engage common people in policy decision making, give freedom for creativity and controlling their own life as they want and revitalize the education system to have a better future generation who takes care of these values and feel happy being obedient.
JEL Classifications: D60;D63; D70;H00; H10
Keywords: Democracy, freedom, life satisfaction,well-being
Do democratic values and participation of people (citizens) in political or decision-making process of
their government affect the level of satisfaction of individuals or subjective well-being (SWB)? Many philosophers, psychologists, social scientists,and
other scholars tried to analyze the relationship between democratic values and political orientation with subjective well-being. Starting from Adam
Smith, who discussed the relationship of happiness
with governing structure of the society or nation (Owen et al. 2008) and more recent researches which tried to establish and understand how nature of
institutions, governing structure and individual behavior influences subjective well-being or own
assessment of individual’s satisfaction with life
(Diener and Suh, 1999; Helliwell 2003; Helliwell and
Putnam 2004). High levels of life satisfaction are
being found to be associated with secure and stable
economies while individuals, in economies which
are politically and economically challenged or in
transitions, tend to experience lower life satisfaction or SWB (Loubser and Steenekamp, 2012).
Participation in the political decision-making process which should be an important part of the democratic system and procedural fairness in every policy decision may lead to increased well-being.
However, it has been found that utility or
well-being gained from a democratic system is somewhat smaller than the utility gained from participation
and procedural fairness (Stutzerand Frey, 2003). It
is very important to mention here that procedural
of satisfaction as democracies are known for their
“performance driven attitude,” (Magalhães, 2016) the qualification of being a perfect democracy lies
in civic participation and procedural fairness of
policy decision making. Studies (Huntington 1991; Caldeiraand Holston, 1999) found that democratic
system has been characterized by rapid transitions and civil rights movements and stable democracies strengthen well-being in long run but at the same time volatile democracies are unlikely to do so.
Because of this, different democracies may show different levels of SWB and it is important to see the effect separately for different democracies. Diener and Suh (1999) pointed out that increased wealth of nations significantly positively affects the SWB of individuals and wealth of nations strongly correlates with individualism, political stability,and interpersonal trust. Helliwell (2003) also explained that SWB depends on both individual characteristics
and characteristics of the society in which the
individual lives. Individual’s personal characteristics
decide their subjective well-being to an extent only and limiting to the person or the family but
the effect of societal characteristics and how the
society is governed is far-reaching in this sense and has long-term effects on the social welfare.
Helliwell and Putnam (2004) confirmed that the
societal relationships and social capital are closely related to happiness and subjective well-being.
Here the trustworthiness and trust on government institutions, civic engagement and religious and community ties play a significant role in deciding
ones’ subjective well-being.
Inglehart (1988) posits that personal life satisfaction, political satisfaction, interpersonal trust and support
for the existing social order are strongly associated
with stable democracies. Life satisfaction not only
includes the material well-being but it is a part of political-cultural attitude that includes political
and personal freedom, trust, tolerance, political activism etc. (Inglehart and Ponarin, 2013). Later studies (Inglehart et al. 2008; Veenhoven 2008) have proven the relationship between well-being and happiness with political and personal freedom and the feeling of having choice and control over one’s life. Democratic society and political structure not only give a fair chance to every citizen to participate
and get involved in every decision process, either by
direct democracy or representative democracy but
it also triesto meet people’s expectations on every policy front (Dorn et al. 2007; Frey and Stutzer 2000).
The association of well-being with human and material capital is already established in the
literature. Studies (Diener and Seligman 2004; Frey and Stutzer 2002; Hayo 2004) have shown that human capital indicators like age, education and
self-reported health are strongly associated with the
level of life satisfaction (or SWB). Better occupational status, possession of land and household assets,
higher relative socio-economic status also increases
well-being. It is a general consensus that more wealth, income and consumption is associated with increased level of SWB (Heady and Wooden 2004; Heady et al. 2004). Furthermore, the increasing level of income is definitely associated with increasing SWB but this positive effect gets weaker or the SWB increases with a decreasing rate after reaching a
maximum threshold level of income and further increase in income or prosperity does not result
into increased SWB (Diener and Seligman 2004; Ng 2002; Lane 2000).Literature also suggests that rather than having absolute income level, it is better
to focus on the relative economic position of an
individual or society (McBride 2001; D’Ambrosio and Frick 2004). For the purpose, the study takes
the variable of relative income where it has been scaled from 1 to 10.
Ngoo et al. (2015) also found other than income
factors like marital status, the standard of living and the role of government have a greater influence on SWB. Here, the role of social capital in deciding ones’ SWB has got strength over the years and studies (Maass et al. 2016; Takahashi et al. 2011) found social capital; particularly group membership
or participation in multiple groups is significantly associated with increased SWB. This is just like the participation and engagement in various social, political, community groups which can flourish only
in Democracy where every individual has control
on his own life and freedom of actions. It has been proved that social capital; measured by social trust, civic engagement and relations, also influence the health status of an individual (Helliwell and Putnam
2004; Kawachi et al. 2008) thereby influencing SWB. Many other studies (Anheier et al. 2004; Bjornscov
domains e.g. income, family, job, friends, sentiment
relationships and health found raising awareness of these life domains strongly correlated with
self-reported levels of life satisfaction and effects were
not homogenous across subgroups.
Similarly comparing Europe and Asia, Jagodzinski (2010) found economic factors influencing both the
regions in the same way but social and cultural
factors strongly influence the level of life satisfaction
when it comes to Asian countries. As far as
European economies are concerned, literature has
many studies which are already there and stabilizing
the relationship between democracy and SWB but
reviews showed that there is a dearth of literature
on the relationship of democratic values and SWB
when it comes to Asian countries. The present study
tries to measure the level of SWB and capture the
determinants in deciding ones’ satisfaction level.
Objectives and hypotheses
Earlier works have shown that material well-being or more appropriately called physical and
economic well-being always comes first in deciding
one’s satisfaction level with life but ultimately after securing a good position or maybe before
that democratic values, freedom of choice and
control over one’s life and political orientation
affect satisfaction level to a much extent. Therefore,
the present study is trying to capture the role of
democratic values, political orientation,and freedom
in deciding one’s level of satisfaction with life or subjective well-being.
The study is more important because it captures the economies from Asia& Australasia. As we know the
Asian countries are very different from each other
when it comes to political orientation and level of
democracy. So, this study makes a good pool of data to capture the effect of democratic and moral ethics
in deciding subjective well-being and take separate
effects of these for differently leveled democracies e.g. Full, Flawed or Hybrid.
The present study tries to measure the level of life satisfaction for individuals from Asia& Australasia and capture the determinants in deciding one’s satisfaction level. The study hypothesized that whether democratic values and ethics play a
significant role in determining one’s level of life
satisfaction and for testing the same on econometric
tools the study presents the methodology and conceptual framework in subsequent sections.
Data and research methodology
The study uses the latest wave (wave six) of World Value Survey (WVS) which was conducted during 2010-14. The dataset best serves the purpose for the study because it is country pooled and includes
important perceptions of individuals on values, ethics, beliefs etc. and its impact on economic, social, political and cultural life. By having six continuous
waves (the seventh wave is under process) from
1981 it has shown the changing value pattern overtime and it includes almost 90 percent of the
world’s population by using appropriate sampling techniques.
These data and their representative sampling strategy have previously been described in detail
in Inglehart et al. (2014)1. The cleaned WVS dataset and questionnaires are publicly available online2. The WVS survey is a multipurpose survey with hour-long interviews on a range of topics. Wave six
covers more than 86,000 individuals as respondents from 60 countries from different continents. The data has been organized at three different levels e.g. Country, Wave,and Longitudinal. Currently,
the study uses a complete wave and uses the data
as a cross-section for different countries from Asia
& Australasia only. The latest data from wave six
includes India in 2012, fixes the errors for different
variables and includes new variables.
The data set is more appropriate when it comes to
aspirations for democratic values, happiness,and life satisfaction. The desire for control over one’s life, freedom, autonomy and having different choices
is always preceded by the desire for physical and economic security. As long as an individual is
physically or economically insecure, these needs
will be on a higher priority than democratic values. The self-expression for democracy grows as an individual or society fulfills these physical and economic desires. The process of democratization gets revitalized as mass self-expression values
1Inglehart, R., C. Haerpfer, A. Moreno, C. Welzel, K. Kizilova, J.
Diez-Me-drano, M. Lagos, P. Norris, E. Ponarin & B. Puranen et al. (Eds.). 2014.
World Values Survey: Round Six - Country-Pooled Datafile Version: http:// www.worldvaluessurvey.org/WVSDocumentationWV6.jsp. Madrid: JD Systems Institute.
2The data set and questionnaires are available at
become more widespread and it puts pressure on
authoritarian economies (as well as on flawed and
hybrid democracies) for political liberalization in terms of democratic institutions.
The study filtered in the individuals/respondents from Asia & Australasia only. Non-response, refusals and filtering used in the study narrowed down the sample to 10,769 in the present case.
Variables
The study uses various variables which are described
by variable type, description, and corresponding
range (see table 1).
Table 1: Description of variables used in the study
Variable Type Description
(Range) Range
Subjective
Well- Being (SWB)
Categorical
(Ordinal) Life satisfaction ladder score (1 - 10)1 – 10
Age Continuous Age of the respondents in
years (18-90)
18 – 90
Age2 Continuous Age squared (324
– 8100) 324 – 8100
Female Dummy Gender of
respondent 1 = Female0 = Male
Married Dummy Marital status of
the respondent 1 = Married0 = Unmarried Number of
Children Discrete Number of children of the respondent
0 – 8
Education Scale
(Ordinal) Level of education of the respondent 1 – 9
Income level Scale
(Ordinal) Level of income of the respondent 1 – 10 Unemployed Dummy Employment status
of the respondent 1 = Unemployed 0 = Employed
Health statusScale
(Ordinal) Self-reported health status of respondents
1 – 4
Importance
of family Dummy Importance of family in life 1 = Important0 = Otherwise
Importance
of politics Dummy Importance of politics in life 1 = Important0 = Otherwise
Importance
of work Dummy Importance of work in life 1 = Important0 = Otherwise
Importance
of religion Dummy Importance of religion in life 1 = Important0 = Otherwise Average trust Categorical
(Ordinal) Average trust on institutions like
press, courts,
government and parliament
1 – 4
Tax Cheat Scale
(Ordinal) Cheating on taxes if have a chance is
justifiable
1 = Never to 10 = Always
Feeling of
happiness Scale (Ordinal) Self-positioning in Feeling of
happiness
1 = Not happy to
4 = Very happy
Political scale Categorical Self-positioning in
political scale 1 = Extreme Left to
10 = Extreme Right
Freedom of
choice and control
Scale
(Ordinal) Freedom of choice and control over own life
1 = No choice to
10 = A great deal of choice
Level of
democracy Scale (Ordinal) How democratically is this country being governed today
1 = Not at all democratic to 10 =
Completely democratic
Source: Computed by the author from WVS (Wave 6) unit level data.
Theoretical modeling framework
First, the study uses descriptive analysis, bar
diagrams and density plots to explain the outcome variable (life satisfaction level)and further Analysis of Variance (ANOVA) has been used to capture
the statistical significance of raw SWB differences among different economies from Asia & Australasia. After that, the ordinary least square (OLS) model uses the life satisfaction level or SWB as our regress and democratic values, individual values
and human capital as our regressors to estimate the level of life satisfaction among the Asian and Australasian nation. The study controls for personal
characteristics like age, gender and marital status to capture the personal characteristics differences in
life satisfaction levels of individuals. The democratic values variables include. Level of democracy, Freedom of choice and control and Political scale
perception of individuals; individual values variables
include importance of family, politics, work, and religion, Average trust, Tax Cheat and Feeling of
of education, Income level, Employment status and Health status. The weakness of the OLS regression
technique in regressing the ordinal outcome variable leads to use of ordinal logistic regression because our regressand is ordinal in nature.
The equation for ordinal logistic regression can be given as follows:
Level of life satisfactioni = β0 + β1 democratic valuesi + β2
individual valuesi + β3 human capitali + β4 personal
characteristicsi + εi …(1)
Where there are N individuals, indexed i = 1 …N such that:
(i) The variable on the left-hand side (L.H.S)
level of life satisfaction is ordinal (scaled from 1 to 10) and taken as regressand.
(ii) The variables on the right-hand side (R.H.S.)
are the regressors of the model and εi are the error term and residuals.
(iii) β0,β1, β2,β3 and and β4 are the parameters to be estimated.
The OLS model for three different heads e.g. democratic values, individual values, and human capital have been fitted as Model 1 including only human capital, Model 2 including both
human capital and individual characteristics
and Model 3 including all three heads. All three models using OLS regression has been verified with their assumption tests for multicollinearity, heteroscedasticity and normality tests. Model
3 which includes our main outcome variable democratic values are then compared with model 4which has been estimated using ordinal logistic
regression with same regressors because OLS
regression may give over-estimated R squared and
OLS regression model specification for ordinal
outcome variable may be inappropriate.
Furthermore, three different models e.g. model 5,
6 and 7 have been estimated using ordinal logistic
regression for countries grouped as Full, Flawed and Hybrid democracies. There is a hierarchy from Full democracy to Hybrid one, where Full
democracies are most fair when it comes to civil liberties and political or individual freedom.
The grouping of countries in three different heads as
mentioned above has been done using Democracy
Index3 2016. As far as different groupings are
concerned,the study takes a sample from WVS data. Full democracies are Australia and New Zealand; Flawed democracies are Hong Kong, India, Japan, Malaysia, Philippines, Taiwan, Singapore, and South Korea; Hybrid democracies are Thailand, Pakistan.
Authoritarian country (China) is not covered here for separate logistic regression as they have no or
very less democracy element in them. Lastly, the
regression estimates have been compared among these groups to come to a conclusion and concrete policy suggestions.
RESULTS AND ANALYSIS
The outcome variable is life satisfaction level (SWB) of individuals, which is an ordinal variable with
a ten-step ladder where‘1’is equal to ‘completely
dissatisfied’ and ‘10’, indicates ‘completely satisfied’
with their own life. These levels of satisfaction were upward ordinal structured and table 2 provides the categories and frequencies of life satisfaction ladder score.
The variables like Political scale, Freedom of choice
and control over one’s life and level of democracy in a country comes under the broad head of ‘Political orientation and freedom.’ All these variables are originally measured on a scale of 1 to 10 like
‘Political scale or orientation’ as Left (1) to Right (10), ‘Freedom of choice and control’ as No choice (1) to A great deal (10) and ‘Level of democracy’ as
Not at all democratic (1) to Completely democratic
(10). Being equal on living standard, two persons
with a different level of freedom of choice and
control over their own actions and with different
democratic conditions may result in different satisfaction or well-being scores. This paper will test
whether democratic conditions, political orientation
and freedom of choice and control significantly
affect these well-being scores and if it affects what is the magnitude of these variables for different democracies like Full, Flawed, and Hybrid.
For the year 2010-14 outcome variable; the level of life satisfaction, which is an ordinal variable with 3Democracy Index has been developed by Economist Intelligence Unit in
2006. Currently, the index is based on weighted average of 60 indicators
which are subsets of five parameters: electoral process and pluralism, civil
a Likert scale (1 to 10) showed the hierarchical structure as 1 indicates completely dissatisfied and 10 indicates completely satisfied with the life. Table 2 provides the different scales of satisfaction with life, its corresponding frequencies and cumulative
frequencies of all satisfaction levels. The sample frequency distribution shows that almost half of the sample is in the scale of satisfaction level of 7 and above which can also be seen through the frequency distribution plot.
Table 2: Frequency table of satisfaction with life
Satisfaction
with your life Frequency Percentage Cumulative Percentage
1 374 3.47 3.47
2 307 2.85 6.32
3 367 3.41 9.73
4 446 4.14 13.87
5 1,171 10.87 24.75
6 1,280 11.89 36.63
7 1,804 16.75 53.38
8 2,332 21.65 75.04
9 1,174 10.90 85.94
10 1,514 14.06 100.00
Total 10,769 100.00
Source: Computed by the author from WVS (Wave 6) unit level data.
From the frequency distribution plot for all observation, it is very clear that the outcome
variable is negatively skewed and distribution’s mode is concentrated at life satisfaction level of 8
(see Fig. 1).
Fig. 1: Histogram of satisfaction with life (on 1 – 10 scale) for all (Pooled)
Source: Computed by the author from WVS (Wave 6) unit level data.
If we compare the frequency distributions of full democracy with flawed and hybrid democracies of
Asia & Australasia, it is very clear that the degree of uniformity is more in case of flawed democracies
than the others and hybrid democracies of Asia & Australasia are highly negatively skewed than the others. This shows the unevenness of life satisfaction level among the individuals of a nation and this is
evident in case of hybrid democracies (see Fig. 2,
3 & 4).
Fig. 2: Histogram of satisfaction with life (on 1 – 10 scale) for Full democracies
Source: Computed by the author from WVS (Wave 6) unit level data.
Fig. 3: Histogram of satisfaction with life (on 1 – 10 scale) for Flawed democracies
Source: Computed by the author from WVS (Wave 6) unit level data.
Fig. 4: Histogram of satisfaction with life (on 1 – 10 scale) for Hybrid democracies
Source: Computed by the author from WVS (Wave 6) unit level data.
Fig. 5 shows probability density (kernel density
plot) as to capture the existing life satisfaction gaps
persisted among different level of democracies. The
distribution (densities) at any point represents the extent of the raw life satisfaction gap. As evident
from the figure that hybrid democracy’s density is
placed or skewed most rightward with respect to
other density of democracies, indicating towards significant life satisfaction gaps (see Fig. 5).
Fig. 5: Kernel density estimates of satisfaction with life for group countries
Source: Computed by the author from WVS (Wave 6) unit level data.
To capture whether the raw gaps in life satisfaction
among different level democracies are statistically significant or not, the study uses one-way ANOVA for three groups’ e.g. Full, Flawed,and Hybrid
democracy.
The descriptive statistics provide information
on mean, standard deviation and corresponding
frequency (sample sizes) for the dependent variable
(Level of life satisfaction) for each group of
independent variables (level of democracy). The
mean satisfaction level is highest for Hybrid democracies followed by Full and least for the Flawed democracies (see table 3).
Table 3: Descriptive statistics
Level of democracy Mean Std. Dev. Freq. Full democracy 7.5058309 1.898011 1372 Flawed democracy 6.6000837 2.4064657 7169 Hybrid democracy 7.5332136 2.0172741 2228
Total 6.9085338 2.3118843 10769
Source: Computed by the author from WVS (Wave 6) unit level data.
The ANOVA results show a statistically significant difference in the mean life satisfaction between the three different levels of democracies (p-value< 0.01,
see table 4).
Table 4: Analysis of Variance for life satisfaction level
among different democracies
Source SS d.f. MS F Prob.
> F Between
groups 2040.97026 2 1020.48513 197.91 0.0000 Within
groups 55511.9355 10766 5.15622659 Total 57552.9057 10768 5.34480923
Bartlett’s test for equal variances: chi2 (2) = 186.4466, Prob.>chi2 = 0.000
Source: Computed by the author from WVS (Wave 6) unit level data.
Tukey post hoc test presents pairwise comparisons of means with an equal variance for our dependent
variable (Level of life satisfaction), to determine which level of democracy differs from each other. Looking at the t values and corresponding p
values, it can be seen that Flawed democracies are significantly different from the Full and Hybrid democracies in terms of the level of life satisfaction. However, there were no such differences between Hybrid and Full democracies
when it comes to the average level of life satisfaction (see table 5).
Table 5: Pairwise comparison of means with equal variances (Tukey post hoc test)
Over: Level of democracy Number of Comparisons: 3 Tukey
Level of democracy Contrast Std. Err. t-value P>|t| Flawed vs Full -0.7415972 0.0515917 - 14.37 0.000 Hybrid vs Full 0.1335149 0.0661925 2.02 0.182 Hybrid vs Flawed 0.8751121 0.0508484 17.21 0.000 Source: Computed by the author from WVS (Wave 6) unit level data.
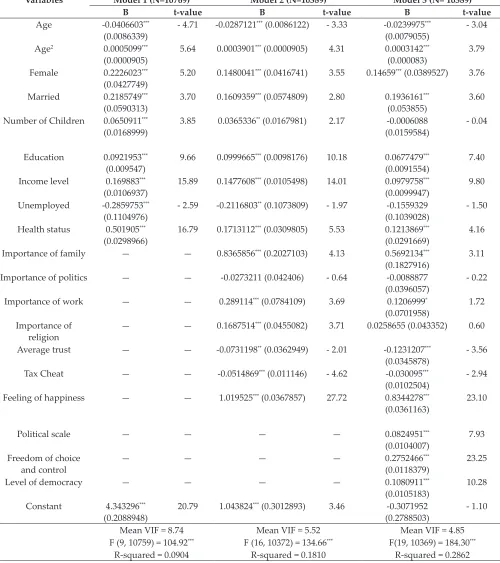
An OLS model for human capital was fitted first (Model 1) and subsequently, the models for Individual values (Model 2) and democratic values (Model 3) were estimated. In Model 1, the F-test with 9 degrees of freedom, F (9, 10759) = 104.92, p < 0.01, indicates that the coefficient of the regressors was statistically significantly different from 0 (see table 6). The estimated regression coefficient for
human capital indicated that three variables e.g.
Table 6: Results of ordinary least square regression model
Variables Model 1 (N=10769) Model 2 (N=10389) Model 3 (N= 10389)
Β t-value Β t-value Β t-value
Age -0.0406603***
(0.0086339) - 4.71 -0.0287121
*** (0.0086122) - 3.33 -0.0239975***
(0.0079055) - 3.04 Age2 0.0005099***
(0.0000905) 5.64 0.0003901
*** (0.0000905) 4.31 0.0003142***
(0.000083) 3.79
Female 0.2226023***
(0.0427749) 5.20 0.1480041
*** (0.0416741) 3.55 0.14659*** (0.0389527) 3.76
Married 0.2185749***
(0.0590313) 3.70 0.1609359
*** (0.0574809) 2.80 0.1936161***
(0.053855) 3.60
Number of Children 0.0650911***
(0.0168999) 3.85 0.0365336
** (0.0167981) 2.17 -0.0006088
(0.0159584) - 0.04
Education 0.0921953***
(0.009547) 9.66 0.0999665
*** (0.0098176) 10.18 0.0677479***
(0.0091554) 7.40 Income level 0.169883***
(0.0106937) 15.89 0.1477608
*** (0.0105498) 14.01 0.0979758***
(0.0099947) 9.80 Unemployed -0.2859753***
(0.1104976) - 2.59 -0.2116803
** (0.1073809) - 1.97 -0.1559329
(0.1039028) - 1.50 Health status 0.501905***
(0.0298966) 16.79 0.1713112
*** (0.0309805) 5.53 0.1213869***
(0.0291669) 4.16 Importance of family — — 0.8365856*** (0.2027103) 4.13 0.5692134***
(0.1827916) 3.11 Importance of politics — — -0.0273211 (0.042406) - 0.64 -0.0088877
(0.0396057) - 0.22 Importance of work — — 0.289114*** (0.0784109) 3.69 0.1206999*
(0.0701958) 1.72 Importance of
religion — — 0.1687514
*** (0.0455082) 3.71 0.0258655 (0.043352) 0.60
Average trust — — -0.0731198** (0.0362949) - 2.01 -0.1231207***
(0.0345878) - 3.56
Tax Cheat — — -0.0514869*** (0.011146) - 4.62 -0.030095***
(0.0102504) - 2.94 Feeling of happiness — — 1.019525*** (0.0367857) 27.72 0.8344278***
(0.0361163) 23.10
Political scale — — — — 0.0824951***
(0.0104007) 7.93
Freedom of choice
and control — — — — 0.2752466
***
(0.0118379) 23.25
Level of democracy — — — — 0.1080911***
(0.0105183) 10.28 Constant 4.343296***
(0.2088948) 20.79 1.043824
*** (0.3012893) 3.46 -0.3071952
(0.2788503) - 1.10
Mean VIF = 8.74 Mean VIF = 5.52 Mean VIF = 4.85
F (9, 10759) = 104.92*** F (16, 10372) = 134.66*** F(19, 10369) = 184.30*** R-squared = 0.0904 R-squared = 0.1810 R-squared = 0.2862 Note: 1. Standard errors are in parentheses, N stands for sample size and * p < 0.10, ** p<0.05, *** p < 0.01.Cameron & Trivedi’s decomposition of IM-test and Breusch-Pagan/Cook-Weisberg test for heteroscedasticity for Ho: Constant variance was used and Chi2 values came out 1940.60
(201), p-value =0.0000 and 368.28 (1) p-value = 0.0000 for model 3 which indicates towards acceptance of alternate hypothesis (presence of heteroscedasticity) so study reported robust (standard errors) results.
2. Normality of residuals for full OLS model has been checked and plots have been shown in the appendix which indicates towards non-normality of residuals which violates one of the OLS assumptions.
taken as human capital indicators, had a positive and significant effect on life satisfaction level and unemployment status leads to affect the level of life satisfaction statistically negatively. Particularly,
the health of an individual is directly related to life
satisfaction and better health leads to more satisfied life, whereas coefficients of income and education
are not less important than health in deciding life satisfaction and significantly affecting one’s perception about life satisfaction.
Model 2 which was fitted with human capital and individual values showed the model gets better with
variables on individual values and the R squared
increases from 0.0904 to 0.1810 with F-test statistic, F (16, 10372) = 134.66, p <0.01 (see table 6). After including the variables for individual values, human capital variables still affect SWB significantly; however, their magnitude has been decreased. The OLS regression coefficients for individual values
showed that more an individual gives importance
to his/her family, work and religion, more he/she would be satisfied with his/her life or increasing importance to family, work and religion results into increasing SWB.
On the other hand, more importance to politics results in less satisfaction with life, however, the coefficient is not statistically significant, it shows
how expectations from political parties may result
in false promises. This is very often in democracies
with multiple party-political structures. The
variable trust also affects the SWB negatively and the coefficient is statistically significant too.
The trust variable corresponds to average trust
on four pillars of democracy e.g. Press (Media), Courts (Judiciary), Government (Executive) and Parliament (Legislature). The variable trust too
shows similar results as like importance to politics where individual expect a lot from these democratic institutions but somehow when the reputation of these institutions is at stake because of some
incidents, it reflects into decreased satisfaction or SWB.
The increased justification for tax cheat results into decreased SWB or satisfaction with life because as
the theory goes to cheat on taxes is unethical and
thereby affecting the level of satisfaction negatively. Lastly, the feeling of happiness is an emotion which
can lead an individual to spirituality and the feeling ultimately counts in ultimate satisfaction with life.
Our full OLS Model (model 3) that is for human capital, individual values,and democratic values has a better fit and R squared increases from 0.1810 to 0.2862 (see table 6). OLS coefficients for democratic values variables e.g. Political scale, Freedom of choice and control over one’s life and Level of democracy are significantly positively associated with the level
of life satisfaction which shows that freedom of choice or having alternatives and democracy do
affect SWB positively. One very interesting finding shows that the political environment also affects the SWB and from the coefficients, it can be seen that turning from left to right wing ideologies results into increased SWB or satisfaction with life which
is contrary from the variable freedom of choice and
control, where more freedom is resulting into more SWB. Why so because Left ideology is generally
believed to be more liberal and forward moving but the Right ideology is assumed to be conservative and generally traditional in policy issues. This contradiction needs to be further explored.
Model 3 shows that how democratic values and ethics are significantly affecting the SWB in Asia
& Australasia. The effect of age is negative on
life satisfaction and with increasing age, SWB is
decreasing at an increasing rate. This means that as an individual gets older the satisfaction level
decreases rapidly. Females and married individuals
are more satisfied than their counterpart and increased number of children results in decreased
SWB which can be justified as the responsibility
increases with an additional member in the family.
Furthermore, ordinal logistic regression has been
used on the same variables as our dependent variable is categorical and ordinal in nature. Our full ordinal logistic regression model (model 4)
estimates the log likelihood ratio LR chi2 (19) = 3768.28, p < 0.01 and Pseudo R2 of 0.0860 (see table
7). Logit coefficients and odds for democratic values variables e.g. Political scale, Freedom of choice and control over one’s life and Level of democracy are significantly positively associated with the level of life satisfaction or SWB. Being in a more democratic
society where there is freedom of choice and one has control over life results into higher levels of satisfaction which can be seen from the odds greater
The result shows democratic values do affect SWB and political orientations of an economy do affect the life satisfaction level. Life satisfaction is merely not
associated with socio-economic and demographic
variables. Individual life satisfaction also depends on individual values, trust on institutions and how
the political scenario is leading the economy.
Giving more importance to family, work, politics,and religion are associated with increasing odds of SWB however only importance to the family is attributed to significantly affect the individual SWB. Having
trust in national institutions results in decreased
odds of SWB and an individual having tax cheating attitude seems to be less satisfied with his or her life. Across the sample, increasing age decreases the SWB until a certain age and females found to be more satisfied than males on an average. Level of
education definitely increases the odds of SWB and being married is a strong predictor of SWB (that can be seen from the coefficients). The economic
status that can be measured by the level of income
is one of the strongest variables which predict SWB
significantly and the most important variable is the health status of an individual which decides
SWB. Lastly, being unemployed leads to less SWB or decreased satisfaction, however, the coefficients are not significant (see table 7).
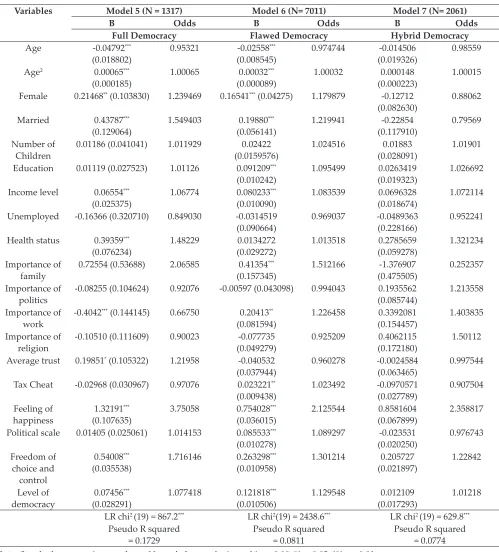
Separate ordinal logit models and corresponding
coefficients for different democracies are shown in model 5, 6 and 7 (see table 8). It can be seen that Pseudo R squared for full democracies is 0.1729 followed by Flawed (0.0811) and Hybrid (0.0774) democracies. The LR chi-square test shows that all three are good fit models as p < 0.01.
Table 7: Results of proportional odds model 4 (ordinal logistic regression)
Variables Model 3 (N= 10389) Model 4 (N = 10389)
Β t-value B Odds
Age -0.0239975*** (0.0079055) - 3.04 -0.02939*** (0.0069234) 0.9710377 Age2 0.0003142*** (0.000083) 3.79 0.0003549*** (0.0000728) 1.000355 Female 0.146588*** (0.0389527) 3.76 0.1125805*** (0.0350062) 1.119163 Married 0.1936161*** (0.053855) 3.60 0.1782078*** (0.0463953) 1.195074 Number of Children -0.0006088 (0.0159584) - 0.04 0.0074983 (0.0130213) 1.007526 Education 0.0677479*** (0.0091554) 7.40 0.0478267*** (0.0079743) 1.048989 Income level 0.0979758*** (0.0099947) 9.80 0.0698373*** (0.0082105) 1.072334
Unemployed -0.1559329 (0.1039028) - 1.50 -0.0666959 (0.0813893) 0.9354797
Health status 0.1213869*** (0.0291669) 4.16 0.1102854*** (0.0243676) 1.116597 Importance of family 0.5692134*** (0.1827916) 3.11 0.3474547** (0.144368) 1.41546 Importance of politics -0.0088877 (0.0396057) - 0.22 0.0250789 (0.0356759) 1.025396
Importance of work 0.1206999* (0.0701958) 1.72 0.0864891 (0.0627214) 1.09034 Importance of religion 0.0258655 (0.043352) 0.60 0.0232034 (0.0407813) 1.023475
Average trust -0.1231207*** (0.0345878) - 3.56 -0.0877581*** (0.029694) 0.9159825 Tax Cheat -0.030095*** (0.0102504) - 2.94 -0.0167135** (0.0082993) 0.9834254 Feeling of happiness 0.8344278*** (0.0361163) 23.10 0.821348*** (0.0300852) 2.273562 Political scale 0.0824951*** (0.0104007) 7.93 0.0820771*** (0.0083627) 1.08554 Freedom of choice and
control 0.2752466
*** (0.0118379) 23.25 0.2927426*** (0.0092928) 1.340098
Level of democracy 0.1080911*** (0.0105183) 10.28 0.1002323*** (0.0084301) 1.105428
Constant -0.3071952 (0.2788503) - 1.10 — —
Mean VIF = 4.85 —
F (19, 10369) = 184.30*** LR chi2 (19) = 3768.28***
R-squared = 0.2862 Pseudo R-squared = 0.0860
Democratic environment (Level of democracy) is statistically significant with a positive sign for Full and Flawed democracies but in the case of Hybrid democracies, it is not. The coefficient is 0.12 for Flawed democracies that is the highest and followed by Full (0.07) and Hybrid (0.01) democracies. It
looks from the odds that democratic environment
most affects transitionary economy’s life satisfaction or SWB and as we know that Flawed democracies
are the economies which are very near to get all set when it comes to democratic values and basic civil
liberties are respected there. On the other hand,
Table 8: Results of proportional odds model for grouped nations (ordinal logistic regression)
Variables Model 5 (N = 1317) Model 6 (N= 7011) Model 7 (N= 2061)
B Odds B Odds B Odds
Full Democracy Flawed Democracy Hybrid Democracy
Age -0.04792***
(0.018802) 0.95321 -0.02558
***
(0.008545) 0.974744 (0.019326)-0.014506 0.98559 Age2 0.00065***
(0.000185) 1.00065 0.00032
***
(0.000089) 1.00032 (0.000223)0.000148 1.00015 Female 0.21468** (0.103830) 1.239469 0.16541*** (0.04275) 1.179879 -0.12712
(0.082630) 0.88062 Married 0.43787***
(0.129064) 1.549403 0.19880 ***
(0.056141) 1.219941 (0.117910)-0.22854 0.79569 Number of
Children 0.01186 (0.041041) 1.011929 (0.0159576)0.02422 1.024516 (0.028091)0.01883 1.01901 Education 0.01119 (0.027523) 1.01126 0.091209***
(0.010242) 1.095499 (0.019323)0.0263419 1.026692 Income level 0.06554***
(0.025375) 1.06774 0.080233
***
(0.010090) 1.083539 (0.018674)0.0696328 1.072114 Unemployed -0.16366 (0.320710) 0.849030 -0.0314519
(0.090664) 0.969037 -0.0489363 (0.228166) 0.952241 Health status 0.39359***
(0.076234) 1.48229 (0.029272)0.0134272 1.013518 (0.059278)0.2785659 1.321234 Importance of
family 0.72554 (0.53688) 2.06585 0.41354
***
(0.157345) 1.512166 (0.475505)-1.376907 0.252357 Importance of
politics -0.08255 (0.104624) 0.92076 -0.00597 (0.043098) 0.994043 (0.085744)0.1935562 1.213558 Importance of
work -0.4042
*** (0.144145) 0.66750 0.20413**
(0.081594) 1.226458 (0.154457)0.3392081 1.403835 Importance of
religion -0.10510 (0.111609) 0.90023 (0.049279)-0.077735 0.925209 (0.172180)0.4062115 1.50112 Average trust 0.19851* (0.105322) 1.21958 -0.040532
(0.037944) 0.960278 -0.0024584 (0.063465) 0.997544 Tax Cheat -0.02968 (0.030967) 0.97076 0.023221**
(0.009438) 1.023492 -0.0970571 (0.027789) 0.907504 Feeling of
happiness 1.32191
***
(0.107635) 3.75058 0.754028
***
(0.036015) 2.125544 (0.067899)0.8581604 2.358817 Political scale 0.01405 (0.025061) 1.014153 0.085533***
(0.010278) 1.089297 (0.020250)-0.023531 0.976743 Freedom of
choice and control
0.54008***
(0.035538) 1.716146 0.263298
***
(0.010958) 1.301214 (0.021897)0.205727 1.22842
Level of
democracy 0.07456
***
(0.028291) 1.077418 0.121818 ***
(0.010506) 1.129548 (0.017293)0.012109 1.01218 LR chi2 (19) = 867.2*** LR chi2(19) = 2438.6*** LR chi2 (19) = 629.8***
Pseudo R squared
= 0.1729 Pseudo R squared = 0.0811 Pseudo R squared = 0.0774 Note: Standard errors are in parentheses, N stands for sample size and * p < 0.10, ** p<0.05, *** p < 0.01.
the insignificant coefficient for Hybrid democracies is justified as these economies face consequential
irregularities in the democratic functioning of the economy.
Freedom and control accounts much more than the
level of democracy and the sign of coefficients is positive for all democracies. Here, it can be seen that freedom and control variable is significantly affecting SWB for Full and Flawed democracies but for Hybrid democracies, this variable is too insignificant. The coefficient is very high for Full democracies (0.54) followed by Flawed (0.26) and Hybrid democracies (0.21). It can be observed that as we move from Full democracies to Hybrid one the coefficient for freedom and control tends to decrease
which supports our hypothesis that freedom and
control become more important as we move to Full
democracies which are more developed. Above
findings have also been supported by Pitliket al. (2015) and argued freedom and control of lives is one of the most important determinants of life satisfaction.
Following a particular political ideology e.g. Left or Right is found to be insignificant in affecting the SWB for Full and Hybrid democracies. For Flawed democracies, moving from Left to Right increases the odds of increased SWB. Looking into the signs of coefficients for Full and Flawed democracies moving from Left to Right leads to more SWB but in case of Hybrid democracies it (sign) is negative suggesting being with Left ideology increases SWB for them.
The real puzzle comes when it comes to interpreting the variables of individual values. The pooled group is so heterogeneous that the signs and magnitude of variables keep on changing with the level of democracy for these Asian & Australasian countries. The most controversial is the variable Average trust
on institutions and Tax Cheat. Increased trust on
national institutions increases the odds of being
satisfied with life on a one to ten scales for Full
democracies (p-value< 0.10) but this increasing trust on institutions results in decreasing odds
for Flawed and Hybrid democracies (however the coefficients are not significant). This indicates
towards the situation where people expect a lot from these institutions but institutions fail to give it back
to people in a positive way. Tax cheating attitude results into the decreased level of SWB for Full and Hybrid democracies that corresponds to previous
studies (however the effects are insignificant) but this attitude is very unique for Flawed democracies which results into increased SWB with increased justifiable attitude for tax cheating.
More importance to politics and religion is associated with decreased odds of SWB for Full and Flawed democracies; however, for Hybrid democracies,
more importance to politics and religion results
into increasing odds of SWB but the relationship is not significant (the coefficients are not significant for all). Importance to family and work are good predictors of SWB. More importance to family increased the odds for both Full (p-value> 0.10) and
Flawed (p-value< 0.01) democracies but decrease
the odds Hybrid (p-value> 0.10). Giving more importance to work results in decreasing odds of
SWB for Full democracies (p-value< 0.01) but the
effect of giving more importance to work on SWB is positive for Flawed (p-value< 0.05) and Hybrid
(p-value> 0.10) democracies. Lastly, the feeling of
happiness is the strongest predictor and every
scale increase result in increased odds of SWB for all three democracies. The effect is strongest for Full (p-value< 0.01) democracies followed by
Flawed (p-value< 0.01) and Hybrid (p-value> 0.10) democracies.
Level of education, income,and health status are still found to very good predictors of SWB but the effects become weaker when considering different country groups separately. Mostly for hybrid democracies the effects of education, income and good health
vanishes and becomes very weak resulting in
insignificant coefficients. However, health is being found most important for Full democracies and education is found to be very important for Flawed one, while income is found to be very important for
both the economies.
CONCLUSION
To analyze the role of democratic values, ethics
and individual values in deciding life satisfaction
level or SWB of individuals from selected Asian and Australasian nations, the study presents first, ANOVA results, which points out towards the existing mean differences of level of life satisfaction among different democracies and these differences
of satisfaction levels found to be statistically significant. Tukey post-hoc results confirm that
are significantly different from the Full and Hybrid democracies in terms of the level of life satisfaction, however, there are no such existing differences in SWB between Full and Hybrid Democracies. Secondly, OLS regression presents that democratic value, freedom of choice and control significantly affects the SWB of an individual. Being in a more
democratic country or society where freedom of choice and control over one’s life are virtues is statistically significantly associated with high
levels of SWB. Tax cheating attitude and justifying the same results in decreasing SWB, moreover, importance to politics is attributed to lower levels of SWB.
Compared to the OLS model, the Partial Odds model (ordinal logistic) model provides a fit that confirms the OLS results, pointing out the importance of democracy, freedom and moral in deciding the level of life satisfaction or SWB of an individual from Asia and Australasia. Increasing trust on national
institutions is found to be positively associated
with SWB in literature but from the sample of the study, this relationship no longer exists in case of Asian and Australasian nations. More trust results in decreased odds of SWB for the sample.
Lastly, our separate PO models clearly estimate and points out that democratic values affect SWB most significantly and found to be the strongest predictor of SWB, however, this relation is insignificant with positive signs for Hybrid democracies. Importance
to politics and religion results in decreased odds
of SWB for Full and Flawed democracies but
here too the relationship is opposite in case of
Hybrid democracies resulting in increased SWB
for every scale increase in importance to politics
and religion. Finally, tax cheating attitude is found to be negatively accounting for SWB in case of Full and Hybrid democracies where trust on national institutions (particularly in Full democracies) is a virtue and results in increased odds of SWB, this relation is very opposite in case of Flawed
democracies where cheat on tax is associated with
increased odds of SWB and increased trust in national institutions results in decreasing SWB.
The institutional set-up of an economy has an important role in shaping the satisfaction level of
their citizens. Focusing first on democratic values, particularly, participation in political decision
making, freedom of choice (having different
alternatives) and control over ones’ life and making the policy procedures transparent makes people
satisfied and results in increased SWB. A nation
that can form its educational system which focuses on both values and freedom for creativity can get
the benefits in every front. It has been recognized that SWB is not merely associated with physical or material capital (e.g. Income, wealth, occupation
etc.) but it also depends on how democratically the
government is run by its representatives. Therefore,
it is very important for contemporary governments to engage common people in policy decision
making, give freedom for creativity and controlling
their own life as they want and revitalize the
education system to have a better future generation
who takes care of these values and feel happy being obedient.
ACKNOWLEDGMENTS
The views expressed in this paper are those of the
author and do not reflect the views of the institution to which the author is affiliated with. I thank my
colleagues who provided insights and expertise
which greatly assisted the research, although any
errors are my own and should not tarnish the reputation of esteemed persons from my institution.
REFERENCES
Angelini, V., Bertoni, M. & Corazzini, L. 2017. Unpacking the determinants of life satisfaction: a survey experiment. Journal of the Royal Statistical Society, 180(1): 225-246. Anheier, H.K., Stares, S., & Grenier, P. 2004. Social Capital
and Life Satisfaction. In W.A. Arts & L. Halman (Eds.), European Values at the Turn of the Millennium (pp. 81-108). Boston: Brill Academic Publishers, Inc.
Bjornscov, C. 2005. The Multiple Facets of Social Capital. European Journal of Political Economy, 22(1): 22-40. Caldeira, T. & Holston, J. 1999. Democracy and Violence in
Brazil. Comparative Studies in Society and History, 41(4): 691-729.
D’Ambrosio, C. & Frick, J. 2004. Subjective Well-Being and Relative Deprivation: An Empirical Link. IZA Discussion Paper No. 1351 (Institute for the Study of Labour, Bonn). The Economist Intelligence Unit. 2016. Democracy Index
2016: Revenge of the “deplorables” Retrieved from http://felipesahagun.es/wp-content/uploads/2017/01/ Democracy-Index-2016.pdfon April 23, 2018.
Diener, E., & Suh, E.M. 1999. National differences in subjective well-being. In D. Kahneman, E. Diener, & N. Schwarz (Eds.), Well-being: The foundations of hedonic psychology (pp. 434-450). New York, NY, US: Russell Sage Foundation.
Dorn, D., Fischer, JAV., Kirchgässner, G. & Sousa-Poza, A. 2007. Is it Culture or Democracy? The Impact of Democracy and Culture on Happiness. Social Indicators Research, 82(3): 505-526.
Frey, B.S. & Stutzer, A. 2000. Happiness Prospers in Democracy. Journal of Happiness Studies, 1(1): 79-102. Frey, B.S. & Stutzer, A. 2002. What Can Economists Learn
from Happiness Research? Journal of Economic Literature, 40(2): 402-435.
Hayo, B. 2004. Happiness in Eastern Europe (Working Paper 12/2004), Marburg: Phillips Universität Marburg. Retrieved from http://econwpa.repec.org/eps/pe/ papers/0410/0410002.pdf
Headey, B. & Wooden, M. 2004. The Effects of Wealth and Income on Subjective Well-Being and Ill-Being. The Economic Record, 80: 24-24.
Headey, B., Muffels, R. & Wooden, M. 2004. Money Doesn’t Buy Happiness… Or Does It? A Reconsideration Based on the Combined Effects of Wealth, Income and Consumption. Discussion Paper No. 1218 (Institute for the Study of Labor, Bonn).
Helliwell, J.F. 2003. How’s life? Combining individual and national variables to explain subjective well-being. Economic Modelling, 20: 331–360.
Helliwell, J.F. & Putnam, R.D. 2004. The social context of well-being. Philosophical Transactions of the Royal Society B: Biological Sciences, 359(1449): 1435–1446.
Huntington, S.P. 1991. Democracy’s third wave. Journal of Democracy, 2(2): 12-34.
Inglehart, R. 1988. The Renaissance of Political Culture, American Political Science Review, 82(4): 1203-1230. Inglehart, R., Foa, R., Peterson, C. & Welzel, C. 2008.
Development, Freedom, and Rising Happiness: A Global Perspective (1981–2007). Perspectives on Psychological Science, 3(4): 264–285.
Inglehart, R. & Ponarin, E.D. 2013. Happiness and Democracy 1972-2008. Journal of Siberian Federal University, 6(8): 1097-1106.
Jagodzinski, W. 2010. Economic, Social, and Cultural Determinants of Life Satisfaction: Are there Differences Between Asia and Europe? Social Indicators Research, 97(1): 85-104.
Kawachi, I., Subramanian, S. & Kim, D. 2008. Social Capital and Health. In I. Kawachi, S. Subramanian, D. Kim (Eds.). Social Capital and Health (pp. 1-26). Springer, New York, NY.
Lane, R.E. 2000. The Loss of Happiness in Market Democracies. London: Yale University Press.
Loubser, R. & Steenekamp, C. 2012. Democracy, Wellbeing and Happiness: A Ten Nation Study (World Values Survey, Working Paper No. 8) Retrieved from https:// www.sun.ac.za/english/faculty/arts/wvs-paperseries/ Documents/08%20Democracy%20wellbeing%20and%20 happiness.pdf
Maassa, R., Kloecknerc, C.A., Lindstromd, B. & Lillefjella, M. 2016. The impact of neighborhood social capital on life satisfaction and self-rated health: A possible pathway for health promotion? Health & Place, 42: 120–128.
Magalhães, P.C. 2016. Economic Evaluations, Procedural Fairness, and Satisfaction with Democracy. Political Research Quarterly, 69(3): 522–534.
McBride, M. 2001. Relative-income effects on subjective well-being in the cross-section. Journal of Economic Behavior & Organization, 45(3): 251-278.
Ng, Y. 2002. Economic Policies in the Light of Happiness Studies with Reference to Singapore. The Singapore Economic Review, 47(2): 199-212.
Ngoo, Y.T., Tey, N.P. & Tan, E.C. 2015. Determinants of Life Satisfaction in Asia. Social Indicators Research, 124(1): 141-156.
Owen, A., Videras, J. & Willemsen, C. 2008. Democracy, Participation, and life Satisfaction. Social Science Quarterly, 89(4): 987-1005.
Pitlik, H., Redín, D.M. & Rode, M. 2015. Economic Freedom, Individual Perceptions of Life Control, and Life Satisfaction. Early release of chapter from James Gwartney, Robert Lawson, and Joshua Hall, Economic Freedom of the World: 2015 Annual Report (Fraser Institute), forthcoming. Retrieved from https://www. fraserinstitute.org/sites/default/files/economic-freedom-individual-perceptions-of-life-control-life-satisfaction.pdf Stutzer, A. & Frey, B.S. 2003. Institutions Matter for Procedural
Utility: An Econometric Study of the Impact of Political Participation Possibilities. In R. Mudambi, P. Navarra, & G. Sobbrio (Eds.), Economic Welfare, International Business and Global Institutional Change (pp 81-99). Cheltenham: Edward Elgar.
Takahashi, K., Thuy, N.T.M., Poudel, K.C., Sakisaka, K., Jimba, M., & Yasuoka, J. 2011. Social capital and life satisfaction: A cross-sectional study on persons with musculoskeletal impairments in Hanoi, Vietnam. BMC Public Health, 11(206).
Fig. 6: Kernel density estimate of residuals for full OLS Model 3
Fig. 7: Pnorm plot (normal distribution) of residuals for full OLS Model 3