1 JOURNAL OF SPATIAL INFORMATION SCIENCE
Number N (YYYY), pp. xx–yy doi:10.5311/JOSIS.YYYY.II.NNN
RESEARCH ARTICLE
The use of equivalent rectangles to
describe flat objects geometry
Joanna Bac-Bronowicz
1, Andrzej Kwinta
21Faculty of Civil Engineering, Wroclaw University of Science and Technology, Poland
2Faculty of Environmental Engineering and Land Surveying, Agricultural University of
Krakow, Poland
__________________________________________________________________________________
Abstract: Real objects in vertical projection oftentimes have a complex geometry. Their irregular shape causes issues when conducting analyses which take into consideration their geometry. The article presents the idea of replacing real objects with equivalent rectangles (ER). The paper also defines the criteria of ER as well as ER parameters and ways of their calculation. The presented solution has been illustrated with four examples. In three of them the most important parameter of object's geometry is its area. The first case depicts the application of ER in the description of underground mining caverns in terms of determining post-mining deformations of the ground surface. In the second study ER was applied to the analysis of geometry of agricultural parcels in the selected part of a rural settlement. The third example presents the application of ER to the description of buildings geometry. And finally the fourth example shows difference between duration of calculations for different rectangles used to describe objects.
Keywords: Equivalent rectangle, geometry analysis, underground mining caverns, agricultural parcels, buildings geometry
1
Introduction
While conducting analyses and calculations concerning various branches of economy we often use the depictions of real existing objects [28,33]. Such objects, depending on the purpose and requirements necessary for calculations, need to be described as precisely and accurately as possible. Taking into consideration the complexity of objects and requirements of calculation models, we simplify real objects and replace them with figures (geometric
Please do not cite
dimensional figures in such a way that they precisely resemble a measured object. For instance the use of strips method for parcel area calculation [30].
The other issue is a replacement of complex real objects with a simplified ones (described mathematically). The cases as abovementioned are for example the subject of the map generalisation in cartography [6]. Depending on the type and shape of an object, various algorithms are applied to simplify the object geometry [29]. There are different approaches to area structures (e.g. parcels, lakes) and to line structures (e.g. rivers, roads, borders) [44]. The simplification criteria are being matched differently taking into account the most important attributes of a given object [14,45].
In certain cases, the simplification of an object is not needed for its visualisation, but it is necessary to determine its geometry [23]. Determination of the real object shape is not a simple task [5], as it requires specification of parameters. Stating that a given object is elongated and determining the ratio of its length and width is not unequivocal for real objects, unless the object is a simple geometric shape. Often, the location of an object in the adopted coordinate system or the direction of the main axis of the object are also crucial for such cases.
Another issue, occurring in industries, is the arrangement of polygons in a rectangle [1]. This problem concerns the optimization of the distribution of a fixed set of elements (their displacement and rotation) inside the smallest rectangle. For example, when cutting out parts from the metal sheet in order to minimize production waste.
One of the approaches to determining a structure geometry is to transform an object into a simple geometrical shape which parameters can be easily calculated. In many cases, the simplest solution is to replace an object with a corresponding rectangle, as for this figure we are able to unambiguously determine axis directions as wells as geometric centre, length, width and elongation. For a majority of real objects, it is impossible to replace them directly with rectangles. In these cases, specific criteria of transforming objects have to be followed. The criteria for selecting a rectangle (e.g. surrounding with the smallest area) for each objects should be consistent and objective, what would ensure that obtained results are repeatable.
The paper presents the method of replacing an area structure with an equivalent rectangle (ER). That is, a rectangle, with the same surface area as the object, among others. Such an approach makes possible to determine geometric parameters of objects, what is necessary for various spatial analyses and calculations. The application of this solution is presented with four different practical examples. In the first one the analysed solution was used to simplify the geometry of forecasted post-mining caverns and the influence of such a simplification on determining land surface deformations. In the second case, the analysis concerns the shapes of agricultural parcels, transformation of which is important in equipment-agricultural work and optimization of agricultural production. The third example presents the replacement of the building's shape with different rectangles and the comparison of the real shape of the object and the ER in different map scales. The last one is focused on differences in the duration of calculations for various types of rectangles.
2
Determination of object shape parameters
Due to numerous natural and anthropogenic factors, shapes and dimensions of various two-dimensional real objects (or their vertical projections) are irregular [23]. Such disadvantageous geometric shapes hinders conducting various analyses, that is why it is necessary to find shapes which may replace researched objects [5]. The most important aspect of the above issue is simplification of geometry while maintaining the most important geometric attributes of a given object. For two-dimensional objects the simplest shape which might be used as a replacement in most cases is a rectangle.
The available literature provides numerous studies of whether a given object is a rectangle and, in case it is not, how deformed it is [40]. What is more, there are various parameters connected with the assessment of the degree of rectangularity of an object [36,46].
Replacing every polygon by rectangle is connected with selecting the appropriate optimization solution for different analyses. There is no the universal optimization solution. Diverse criteria should be developed for various applications in different sciences. We can choose one from the following criteria to describe the geometry of an object:
surrounding rectangle with the smallest area, Minimum Bounding Rectangle (SR, MBR) [8,43],
inscribing rectangle with the largest area, Maximum Empty Rectangle (LR, MER) [32,42],
equivalent rectangle with the same area (ER) [25,41].
The geometry of each object can be described with three elements:
location,
shape,
dimension.
Various objects will be described differently, but these three elements along with the coordinates of the border points uniquely describe the object.
In further considerations, we will especially focus on the equivalent rectangles (ER) method. This rectangles are suitable for 2D structures for which their area is the most important factor. Real shapes of actual area structures, which are often very complex, may be replaced by hypothetical rectangles. If a given rectangle meets established geometric criteria, it can be qualified as an equivalent rectangle (ER). An equivalent rectangle (ER) should meet a choice of requirements concerning its geometry in reference to real objects:
centres of gravity of both figures should align,
longitudinal and transverse axes of both figures should align,
surface area of rectangle should be equal to surface areas of the object.
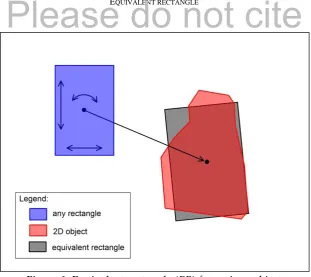
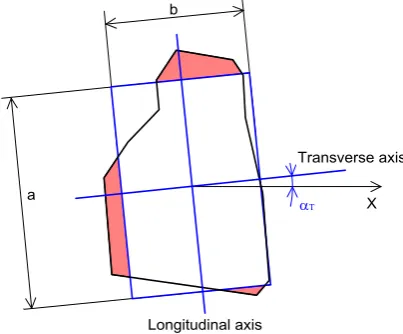
If the abovementioned requirements are met, a rectangle which contour closely commeasures with the outline of an object, should be obtained. Figure 1 depicts the idea of an equivalent rectangle.
Please do not cite
Figure 1: Equivalent rectangle (ER) for a given object
The idea of ER is based on a series of transformations of a rectangle in such a way that it meets the defined criteria. The possible transformations are presented on Figure 1; these are the changes of shape (proportions of sides), size (enlargement, reduction) and location (rotation, translation). In order to make such transformations and obtain an ER it is necessary to conduct a series of calculations. To determine basic geometric elements of objects, we use the moments of inertia of two-dimensional geometric figures [38]. As a result of calculations conducted in several steps for an object the following parameters may be obtained:
1. area,
2. geometric centre,
3. directions of transverse and longitudinal axes, 4. elongation coefficient,
5. lengths of rectangle sides.
Not all of abovementioned parameters are needed in each and every analysis.
Figure 2 presents an object placed in an adopted coordinate system. It also depicts the object’s geometric elements, which would be used in the following steps of calculations.
Figure 2: Establishing the parameters of flat object
STEP 1
We are calculating area of object:
P
P
dP
(1)Where P is the object area and dP is the object's element of integration.
In this step we use one of analytical methods to calculate area, for example Gauss’s area calculation formula.
STEP 2
Assuming that an object is a homogenous structure, the formulas for the coordinates of a centre of gravity S(xS,yS) are as follows (2):
P S P S xdP x P ydP y P
(2)STEP 3
We need to assign the moments of inertia (Jx, Jy, Jxy) of an object in relation to the axis of
the adopted coordinate system, which equals respectively: 2 2 x P y P xy P
J y dP
J x dP
J xydP
(3)Using the Steiner’s theorem [37] it is possible to determine the central inertia moments (J0x,
J0y, J0xy) (Fig. 2), that can be calculated with below formulas: 2
0
2 0
0
x x S
y y S
xy xy S S
J J Px
J J Py
J J Px y
(4)
The main axes of an object aligns with the axes of main moments of inertia, therefore the angles created between the longitudinal (L) and transverse (T) axes of an object and the X
axis satisfy the following equations:
0 0 0 2 2 90 xy L x y T L J tg J J (5)
Figure 2 presents only one of the angles. In case of the above equation, it should be mentioned that when the central inertia moments (J0x, J0y) are equal, the denominator equals 0
and this needs to be taken into consideration while making calculations. Such instances occur especially with regular objects (e.g. circle, square).
In order to determine the length of sides of an equivalent rectangle is it necessary to calculate central moments basing on (4) and then the main moments (J1, J2) of a parcel:
Please do not cite
2
0 0 0 0 2
2 0
2 2
x y x y
xy
J J J J
J J
STEP 4
We are determining the ratio of object's main moments, which characterizes the elongation (e) of the object and, at the same time, it is the ratio of lengths of ER sides:
1
2
J e
J
(7)
STEP 5
For every rectangle with sides a and b (Fig. 3), we can create the following system of equations:
P ab
a e
b
(8)
By resolving the system, we calculate the length of the sides:
a Pe
P b
e
(9)
According to the requirements of ER geometry presented at the beginning of the chapter, ER
obtained on the basis of the dependencies (2), (5) and (9) is an optimal rectangle describing a given object (Fig. 3).
Figure 3: Outline of spacing of ER against the object
The optimal rectangle in this case means that the area of the object which does not align with ER (in Figure 3 marked with red colour) in the function of ER dimensions (a, b) and its angle of inclination to the X axis of coordinate system (L) amounts to the minimum.
As a result of the above calculations it was possible to determine the following attributes which describe the object geometry:
area of both the P object and rectangle (1),
coordinates of centre of gravity of the object – xs, ys (2). elongation angle L (5),
elongation coefficient e (7),
lengths of rectangle sides (9).
The abovementioned theoretical considerations might be easily applied in a computer programme, or used as a procedure in GIS or CAD system. The only one computational difficulty is the calculation of integrals in equations (1)-(3). All six integrals can be calculated simultaneously (surface integrals of the analysed object), as a result the outcomes can be obtained very quickly.
Calculation steps 1-4 are the same for the different rectangles. Finding the smallest surrounding rectangle (SR) is a trivial issue as it requires to calculate minimal and maximal coordinates of an object in the coordinate system where the object's elongation is aligned with the X axis. In the case of determining the largest internal rectangle (LR), it is necessary to apply the iterative method of calculation. Difference in duration of calculations for different rectangles (ER, SR and LR) will be presented in the fourth example.
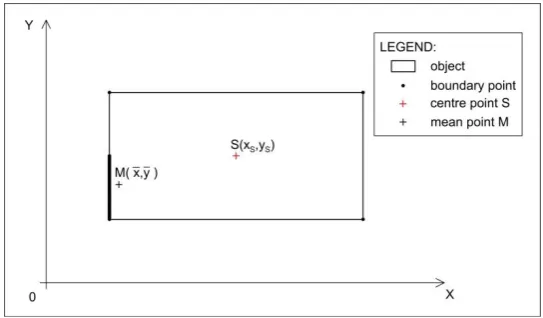
Sometimes there might be errors in the geometry analysis of objects. For example, the geometric center of the object S x
S,yS
is identified with the mean value of the boundary pointsM x y
,
:1
1
1
1
n i i
n i i
x
x
n
y
y
n
(10)This is only sometimes true, but for many real objects these are two different points.
Figure 4: Boundary mean point and centre point of object
In order to illustrate the differences, Figure 4 shows a rectangle that has more than 4 vertices (in the Figure it has 54 points). You can see in this example how significant the differences can be: black cross mean boundary point (10) and red cross geometric centre point (2). The consequences for the geometry of the object are serious. We must be very careful what we count and how we define the geometric elements of the object.
The following chapters present different applications of ERs in various branches of sciences.
Please do not cite
This example is not a typical determination of the objects geometry, but it is rather focused on replacing the real geometry with the ERs.
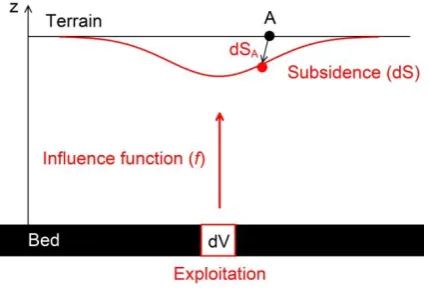
The underground mining extraction is causing the occurrence of hollow spaces in rock mass, which migrate upwards and result in the emergence of relocations and deformations on the ground surface [35]. Depending on the mining and geological conditions of mineral bed, the optimal form of mining extraction is selected. The forecasting of terrain deformations caused by ongoing mining operations is a vitally important issue, crucial to appropriately design mining exploitation [24]. Theoretical calculations of deformation index are conducted on the basis of computational models [10]. Currently the geometric-integral and geo-mechanical models are being the most commonly used methods for the theoretical calculations [4]. On the other hand, in the Figure 5 there is presented the operational principle of a group of theoretical models based on the influence function [12,27].
Figure 5: The influence function
Through the influence function f, the elemental exploitation dV (cause) in point A generates the elemental subsidence dS (effect):
;
A
dS
f X k dV
(11)where:
dSA – the elementary subsidence of point A,
;
f X k
– f is the influence function, X is the set of geometric data, k is the set of model parameters,dV – the elementary exploitation volume.
By adding elementary influences from all elements of exploitation with the use of integral [39], you can calculate the subsidence. Total subsidence of point A is:
;
A P
S
f X k gdP
(12)because
dV=gdP – element volume is product of thickness (g) and area (dP).
The accuracy of the calculation results leans firstly on the correct description of the exploitation geometry (especially its volume, because we calculate influences with the surface integral) and secondly on the adopted parameters of theoretical model which are adequate to particular geological and mining conditions.
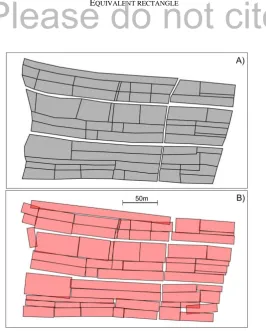
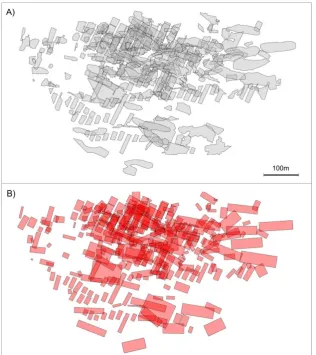
Depending on the type of mineral and applied mining system, post-mining voids might have regular (wall system) or irregular (cavern system) shapes [17]. Figure 6 presents a set of mining caverns marked with grey colour in one of underground salt mines. There are 301 mining caverns located from 60 to 300 meters deep selected. The caverns have various sizes of bases (from 6m2 to 6,000m2, average of 624m2) and are described using a different number
of vertexes (from 4 to 56, median of 19). The calculations of deformation factors are considerably time-consuming, especially for a big number of points on a surface (e.g. more than 100,000 points) and for numerous time horizons (e.g. salt rockmass deformations have been formed even up to 100 years). Deformations are calculated for each cavern for each point and in each time horizon. This calculation endure really a lot of time. Such calculations might be accelerated through the simplification of exploitation caverns geometry, however it has to be done in a way which does not impact the obtained values of deformation.
Marked in light red colour in Figure 6 are equivalent rectangles (ER), which were generated basing on mining caverns geometry.
Figure 6: Outline of distribution of A) mining caverns and B) designated ERs
Using MODEZ 4.0 mining deformation prediction system [18], which bases on the modified Knothe's theory (the geometric-integral theory), the prediction of terrain subsidence within the area of exploitation was established for the mining caverns in their real shape, as well as for cuboids basing on ERs, which have replaced the caverns.
Please do not cite
Figure 7: Results of subsidence prediction - A) terrain subsidence [m]; B) subsidence difference [mm]
Figure 7 presents the results of subsidence calculations (A). The results obtained in both calculations differed less than 15 mm (B), which is not significant in this case (maximal subsidence is 2146 mm). Nevertheless, the time necessary to conduct calculations has diminished considerably. In this example (301 caverns, 4000 points, 2 time horizons) original cavern data calculation took 45 minutes, with ER calculation took 29 minutes.
Therefore, it can be stated that the change of the shape of cavern bases into ER does not cause important changes in predicted deformation indicators, whilst the time used to conduct the calculations decrease noticeably. Hence, such a simplification can be introduced for this group of cases. However, it should be remembered that each case should be approached individually. Before applying this solution, appropriate analyzes should be performed.
4. Agricultural parcels – case study
Proper configuration and placement of parcels in an agricultural holding is one of the primary criteria enabling effective production [16]. Throughout the years, the form of an agricultural holding depended on numerous factors, which greatly influenced the final form of field layout in a rural settlement. Both land transfers as well as the division of inherited land led to an increase in the number of new parcels with declining spatial parameters [11]. The abnormalities in the ground spatial structure, which are increasing over time, negatively influenced theirs cultivation process and resulted in the need for undertaking appropriate land consolidation works aimed at the improvement of ground structure [15,21,26,31]. The above problem is widely known all around the world.
In this chapter, we designate additional geometric parameter of the parcel. For agricultural parcels, the distortion factor of shape (DFS) is very important.
We shall define the following auxiliary function of the objective:
,
1, n ,
0, n , n x y P
x y ER n
x y ER
(13)
The area of an object not covered by the ER might be determined in the following way:
P
P P n dP
(14)According to the above notation, we obtain the “optimal” ER when:
, , L
minimumP a b
(15)
When this condition is met, it is possible to calculate the distortion factor of shape (DFS):
100%
P DFS
P
(16)
The available literature mentions a similar parameter [40,41].
In order to optimize agricultural activity within a farmstead, it is necessary to determine a number of parameters encompassing full characteristic of an agricultural holding, including the geometry of parcels among others. A number of parameters referring to faulty spatial structures were developed [20]. Among the parameters describing parcel's geometry, the crucial ones from the perspective of agricultural productivity are the size and the shape of parcel. Particularly important is its elongation and the elongation direction in relation to the terrain gradient and sunlight direction.
An example of ER application to the agriculture concerns the description of the parcels geometry for a part of a rural settlement located in southern Poland. Basing on the evidence data, 62 land parcels were selected (with a total area of approx. 40.36 hectares); the parcels are marked with grey colour in Figure 8. Using a special software, which complies with the solutions presented in the second chapter, we were able to calculate ERs for particular parcels. Figure 8 presents the analysed area (the upper part of the figure) with equivalent rectangles marked with light red colour.
Please do not cite
Figure 8: Outline of parcels placement and their designated equivalent rectangles
Basing on ER it is easy to conduct the analysis of shapes of particular parcels. Using the adopted parameters, it is possible to specify whether in a given region it is necessary to consolidate grounds, or if it is required to transform the structure in such a way that would increase the efficiency of husbandry. Table 1 presents the extreme and average values of parameters of land parcels.
Parameter Vertexes P (1) P (14) DFS (16) L(5) a (9) b (9) e (7) [m2] [m2] [%] [deg] [m] [m]
Min 4 42.55 0.24 0.1 0.7 13.89 2.90 1.1
Mean (Median*) 6* 651.04 28.74 3.8 158.4 49.21 13.18 4.5 Max 24 2189.21 392.05 23.7 179.9 199.64 30.31 18.2
Table 1: Parameters of parcels included in the analysis
Basing on the data included in Table 1 it can be stated that, in the analysed part of a village, the layout of parcels is satisfactory; the average distortion factor amounts to 3.8% and the ratio of the longer and shorter side amounted to 4.5 on average. Obviously there are parcels which should be transformed, e.g. a parcel with an area of 42.55m2, or a parcel with 24
vertexes. In this case, the applied solution allows to indicate individual parcels which should be analyzed separately.
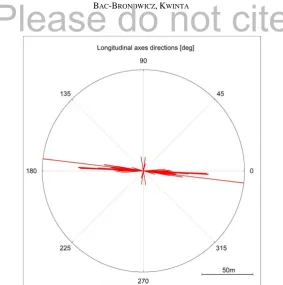
Another interesting application of the presented solution may be the analysis of the directions of parcels elongation (e). The following Figure 9 presents the layout of longitudinal axis directions (longer side of a rectangle) in a form of a pie chart.
Figure 9: Layout of elongation directions of analysed parcels
As depicted in Figure 9, the elongation direction of the majority of parcels is from east to west, and only several parcels have different directions (4 parcels), what is more, it is worth noticing that such parcels are of small sizes (the length of the longer side below 30 meters). If you include in the analysis terrain elevation data (DMT), you can define the risk of land erosion.
Replacement of parcels with ER enables a quick spatial analysis of rural settlements, it can also help in the assessment whether the spatial layout is faulty and if the intervention of a planner is required [25]. We do not use this solution straightforward. In the real terrain, we do not automatically convert parcels into rectangles. In this case ER is only instrument to get geometric data for further analyses and detailed works.
5. Structures – case study
The data included in geo-information systems is obtained in the different ways [3,7], basing on direct geodetic measurements or on multispectral satellite or on airborne images [19,34]. The data is also obtained from historical data, cartographic (paper) data or different digital resources [2,13].
Also in reference to structures is it necessary to determine geometric parameters, which is not an easy task due to application of highly diverse architectural solutions. In case of complicated shapes of buildings, or structures which in vertical projection are not simply connected figures, the result of analysis might be misleading. In such a case the object should be divided into modules (e.g. like in case of object dilatation). Figure 10 present a historical building from the 14th century – St. Elizabeth’s Church located near the Wroclaw Market
Square in Poland with calculated rectangles (minimal, maximal and equivalent). The church is a 10-span structure with three naves and a tower located in the south-west corner. The
Please do not cite
Figure 10: Contour of St. Elizabeth’s Church, Wroclaw and designated rectangles
During the process of the ER designation, basic parameters of the object were calculated (area, length of walls, geometric centre, angle of longitudinal and transverse axis rotation). Since the object is irregular (e.g. attached tower) the designated longitudinal axis (black thin line visible in Figure 10) does not align with the axis of the main nave. Similarly like for agricultural objects, we can determine the distortion parameter DPS (16). For the designated
ER the DPS parameter amounts to 6.9%. Hence it can be stated that the ER is properly fit to the object.
For comparison, LR and SR rectangles were also determined. For all designated rectangles (ER, SR,LR) the basic assumption was that the axes and centroid overlap with the axis and centroid of the object. When analyzing the results shown in Figure 10, it should be noted that the designated smallest surrounding rectangle (SR) marked in green meets the assumptions, but it is not the smallest possible rectangle. A similar observation applies to the largest inner rectangle (LR) marked in blue in Figure 10. The axes of this rectangle and its centroid are the same as for the object, but this is not (generally) the largest inner rectangle. The dimensions of the designated rectangles and their surfaces are listed below in Table 2.
Object Length
[m]
Width [m]
Area [m2]
ER- equivalent rectangle 66.90 37.98 2540.86
SR - smallest rectangle 74.90 50.24 3762.98
LR – largest rectangle 58.85 28.70 1689.00 Table 2: Dimensions of the designated rectangles
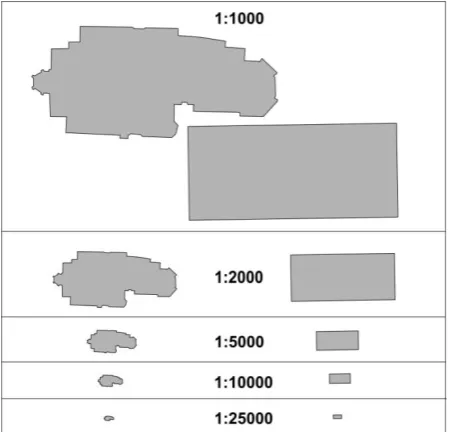
Another crucial element connected with the structures is their presentation on cartographic projections. The issue of cartographic generalization of flat and line structures has been deeply analysed in literature [9,29]. In certain cases, when high accuracy of data is not required, it is possible to introduce substantial simplifications of structures. Figure 11
presents the comparison of the real shape of a structure (St. Mary’s Basilica in Krakow) with its designated ER for various scales of depiction.
Figure 11: Comparison of the shape of structure and the ER depending on the scale of mapping
Depending on the scale of mapping, the real object might be depicted directly (scale denominators lower than 10,000) or in a simplified way using ER (scale denominators higher than 10,000). The object can be simplified also depending on the purpose of the projection. When calculating ER, we determine geometric centre and angle of rotation of object axis in relation to the adopted coordinate system. Such data can be used when replacing the real object with a cartographic symbol.
6. Rectangle comparsion
The last example has been presented in order to compare different rectangles used to describe the objects geometry. The analysis is conducted for an equivalent (ER), the smallest surrounding (SR) and the largest inner (LR) rectangles. For this purpose special software which generates rectangles has been prepared. Moreover the timer for computing the duration of calculations has been introduced for this software. For all three types of rectangles the beginning of calculations is the same – chapter 2. formulas (1)-(5). The following stage of calculations for all rectangles is the introduction of local coordinate system with its origin in the object centre of gravity and with the axis directed in line with its vectors of main inertia moments.
The calculation of the equivalent rectangle (ER) consists of using formulas (6)-(9). Next, when the lengths of its sides and its centre are determined, the coordinates of ER vertices can be calculated.
The calculation of the smallest surrounding rectangle (SR) is connected with finding the biggest coordinates of the object in the local coordinate system, which coordinates constitute the half of SR sides. Then the coordinates of the SR vertices can be determined.
Please do not cite
distances constitutes the half of the LR diagonal. Next the rectangle of the biggest area, which sides do not cross the object's sides (but the tangency is allowed), is being searched between these biggest and smallest values by using the iterative method.
The comparative analysis of the calculation duration has been conducted for four objects. As the objects, the islands located throughout the World have been chosen: Fuerteventura, Jamaica, Sri Lanka and Taiwan. For each of the objects all three types of rectangles have been calculated. The outcomes of calculations of geometric parameters and the time of calculation have been presented below in the Table 3. On the other hand in the Table 4. the rectangles' sizes and the differences between areas of islands and areas of rectangles in percentages have been indicated.
Isla Vertexes
Isla geometry Time of calculation [msek]
P
[km2]
e L
[deg]
ER SR LR
Fuerteventura 200 1.66 2.91 57.2 0.166 4.88 6609.0
Sri Lanka 333 65.78 1.80 99.8 0.174 8.13 11216.0
Taiwan 435 35.95 2.66 71.0 0.167 10.28 15047.0
Jamaica 540 10.91 3.10 170.0 0.170 12.88 18456.0
Table 3: The geometric parameters of islands and the time of calcualations.
Isla
Equivalent
Rectangle Smallest Rectangle Largest Rectangle
a
[km]
b
[km]
DPS
[%]
a
[km]
b
[km]
P
[%]
a
[km]
b
[km]
P
[%]
Fuerteventura 69.6 23.9 23.8 112.6 40.0 170.9 40.0 15.3 -63.1
Sri Lanka 344.2 191.1 11.2 466.2 243.9 72.9 269.2 125.5 -48.6
Taiwan 309.5 116.2 11.2 397.9 153.8 70.2 241.7 83.2 -44.0
Jamaica 183.9 59.3 17.7 243.0 94.0 109.4 93.3 45.5 -61.1
Table 4: Sizes of different kind of rectangles
The results of calculations have been presented graphically below in the Figure 12.
Figure 12: Objects and determined rectangles ER, SR and LR
Looking at the calculations results obtained in this example, the shortest time to perform computation has been registered for the ER, for the SR this time has been around 50 times longer and for the LR around 10,000 times longer. As can be seen in the Table 3, for the ER, the time of calculations is more or less constant even for the objects with more vertices. On the other hand, for the SR and the LR, the number of vertices has a significant impact on duration of calculations and as the number of vertices is increasing, the time of computation is also increasing.
6. Summary
In reference to real area structures it is often necessary to identify their geometric attributes. They come in complex shapes, which often are difficult to be described unequivocally. Therefore, it is necessary to introduce certain simplifications which allow to determine the geometry of such objects.
The significant attributes of two-dimensional area structures are: their area, length of edges, distribution and shape. Obtaining some of that information is easy basing directly on the geometry of an object, defined by the coordinates of its vertexes. However, certain attributes are not directly available and it is necessary to conduct proper calculations. In many fields of science, replacing the real object with a rectangle is used. You can search for
Please do not cite
various minimization criteria because the criteria depend on the selected calculation goal. It is different with replacing a real object with an equivalent rectangle (ER). In such a case it is crucial to determine the necessary criteria for such an ER, in order for it to accurately present the geometry of a real object. What are required for both the object and the ER in most cases, these are the alignment of geometric centres and directions of moments of inertia, as well as coverage of the same area. The ER created in such a way may be used for analyses of object geometry. Obviously not every ER correctly depicts structure geometry. In such cases, the decisive factor is a distortion factor of shape in relation to the rectangle DFS (13). It is worth mentioning that for high values of this factor, created ER does not correspond with the shape of the object and, in such case, it is necessary to divide the object into parts which are simplified to suitable ERs.
The replacement of real objects with the ERs can be used in the calculation practice. The object's area is crucial parameter in analyses within the various fields of science. The paper presents three different cases in which objects were replaced by equivalent rectangles, and one case in which the calculation time of different rectangles was analyzed.
The first case concerns the simplification of the shape of underground mining exploitation caverns and assessment of the impact of such simplification on the predicted land subsidence. As a result of calculations for ERs and caverns, it was proved that the obtained results were similar. For predicting deformations, both the rockmass properties and the mining geometry are equally important. Therefore, it is valuable to note that in some cases simplifications of cavern shapes can be used in theoretical calculations. However, similar tests must be carried out for other mining and geological conditions of mining exploitation.
Next, the authors analysed the possibility of replacement of agricultural parcels with
ERs. In this case geometric parameters of parcels are crucial and their deviation from the rectangle shape.
By changing parcels into ERs it was possible to obtain geometric parameters enabling the analysis of the structure of parcels. This helps making the decision concerning the necessity of parcel consolidation or other works (e.g. identification of erosion threat). Information obtained by designating ER may serve as basis for activities related to the assessment of formation of rural ground layouts.
The third case study presents the possibility of ER application in depiction of structure geometry. This is especially significant for historic buildings lacking architectural documentation.
In this case there are also shown differences between original object geometry and ER on maps with different scales. When applying ER in order to depict buildings geometry it is necessary to consider the DFS parameter, which determines whether for a given object it is possible to be depicted as a rectangle. High values of this parameter prevent from replacing the object with a rectangle and it is advised to divide the object into parts which can be depicted as separate equivalent rectangles.
The last case presents the time needed for conducting the calculations for different rectangles. On the basis of four islands, the calculations of the equivalent, the largest inner and the smallest surrounding rectangles have been performed. The islands have different sizes and shapes as well as big number of border points. The performed calculations
indicated that they have been conducted the fastest for the ER, whereas the computations for the SR are several dozen times slower and for the LR they can be even over 10,000 times slower (depending on the criteria of stopping the iterative procedure). Obviously for objects of different shapes these discrepancies can vary, but the ER calculations are always the fastest.
All calculations conducted in the paper were made with a use of software specially created for the project. Further development of the software is planned in the future.
References
[1] ALT, H., DE BERG, M., AND KNAUER, C. Approximating minimum-area rectangular and convex containers for packing convex polygons. Journal of Computational Geometry, vol. 8, no. 1. pp.1-10 (2017).
[2] BAC-BRONOWICZ, J., AND WOJCIECHOWSKA, G. Stan prac nad rozwojem bazy danych architektonicznego dziedzictwa przemysłowego Wrocławia. Annals of Geomatics, vol. 14, no. 5. pp. 537-548 (2016). (in Polish).
[3] BAC-BRONOWICZ, J., DYGASZEWICZ, J., GRZEMPOWSKI, P., AND NOWAK, R. Bazy danych referencyjnych jako źródła zasilania i aktualizacji warstw dotyczących budynków w Wielorozdzielczej Topograficznej Bazie Danych. Annals of Geomatics, vol. 8, no. 5. pp. 7-22 (2010). (in Polish).
[4] BAHUGUNA, P.P., SRIVASTAVA, A.M.C., AND SAXENA, N.C. A critical review of mine subsidence prediction methods. Mining Science and Technology, vol. 13. pp. 369-382. (1991).
[5] BUNGE W. Theoretical geography. Royal University of Lund, Dept. of Geography; Gleerup, (1966).
[6] BUTTENFIELD,B., AND MCMASTER,R. Map Generalization: Making Rules for Knowledge Representation. Longman, London. (1991).
[7] BIELECKA, E. Geographical data sets fitness of use evaluation. Geodetski Vestnik. vol. 59, No. 2, pp. 335-348. (2015).
[8] CHAUDHURI, D., KUSHWAHA, N. K. ,·SHARIF, I., AND SAMAL, A. Finding best-fitted rectangle for regions using a bisection method. Machine Vision and Applications, vol.23, no. 6, pp. 1263–1271. (2012).
[9] CHROBAK, T., SZOMBARA, S., KOZIOŁ, K., AND LUPA, M. A method for assessing generalized data accuracy with linear object resolution verification, Geocarto International, 32(3), pp. 238–256. (2017).
[10] CHUGH,Y.P.,HAO,Q.W., AND ZHU,F.S. State of the art. in mine subsidence prediction. In ‘‘Land Subsidence 1989’’ Publ. Balkema
[11] DEMETRIOU, D., STILLWELL, J., AND SEE, L. A new methodology for measuring land fragmentation. Computers, Environment and Urban Systems, Vol. 39. pp. 71 - 80. (2013).
Please do not cite
[13] GHAFFARIAN,S. Automatic building detection based on supervised classification using high resolution Google Earth images. The International Archives of Photogrammetry, Remote Sensing and Spatial Information Sciences, Vol. 40-3, pp. 101-106. (2014)
[14] Gibbs J. P. Urban research methods. New York. (1961),
[15] HANUS, P., PĘSKA-SIWIK,A., AND SZEWCZYK,R. Spatial analysis of the accuracy of the cadastral parcel boundaries. Computers and Electronics in Agriculture, no 144, pp. 9-15. (2018).
[16] HARTVIGSEN,M. Land reform and land fragmentation in Central and Eastern Europe.
Land Use Policy. Vol. 36, pp. 330-341. (2014).
[17] HEJMANOWSKI,R.,MALINOWSKA,A.,KWINTA,A., AND ULMANIEC,P. Rock-mass stability in salt mines – risk factors. In 12 Geokinematischer Tag, Freiberg. pp. 296-302, (2011). [18] HEJMANOWSKI, R., AND KWINTA, A. Modelowanie deformacji ciągłych powierzchni
terenu w warunkach zmiennego zalegania złoża. Gospodarka Surowcami Mineralnymi.
Vol. 26, issue 3. pp. 141-153, (2010). (in Polish).
[19] HUERTAS, A., AND NEVATIA, R. Detecting buildings in aerial images, Computer Vision, Graphics, and Image Processing, vol. 41, issue 2, pp. 131–152, (1988).
[20] JANUS, J., AND TASZAKOWSKI, J. The idea of ranking of setting priorities for land consolidation works. Geomatics, Landmanagement and Landscape, Publ. University of Agriculture in Krakow, No. 1, 2015, pp. 31-43. (2015).
[21] KING, R., AND BURTON, S Land fragmentation: notes on fundamental rural spatial problem. Progress in Human Geography, Vol. 5 (6), pp. 475–494. (1982).
[22] KOHL J.G. Der Verkehr und die Aussiedlungen der Menschen in ihrer Abhängigkeit von der Gestaltung der Erdoberfläche. Leipzig, (1850). (in German)
[23] KOSTURBIEC B. Analysis of concentration phenomena in settlement network. Polish
Academy of Sciences , Geographical Studies. Vol. 93.(1972). (in Polish).
[24] KRATZSCH,H. Mining Subsidence Engineering. Springer-Verlag Berlin Heidelberg New York. (1983).
[25] KWINTA,A., AND GNIADEK,J. The description of parcel geometry and its application in terms of land consolidation planning. Computers and Electronics in Agriculture, no 136, pp. 117-124. (2017).
[26] LEŃ, P. An algorithm for selecting groups of factors for prioritization of land consolidation in rural areas. Computers and Electronics in Agriculture, no 144, pp. 216-221. (2018).
[27] LI,H.Z., ZHAO, B.C., GUO,G.L., ZHA,J.F., AND BI, J.X. The influence of an abandoned goaf on surface subsidence in an adjacent working coal face: a prediction method.
Bulletin of Engineering Geology and the Environment. Vol. 77, Issue 1, pp 305–315, (2018)
[28] LIU, W.,ZHANG, X.,LI,S., AND YING, M. Reasoning about cardinal directions between extended objects. Artificial Intelligence. Vol. 174, Issues 12–13, pp. 951-983 . (2010).
[29] MACKANESS, W.A., RUAS, A., AND SARJAKOSKI, L.T. Generalisation of Geographic Information: Cartographic Modelling and Applications. Elsevier. (2011).
[30] MALING, D.H. Measurements from Maps: Principles and Methods of Cartometry. Butterworth-Heinemann, (2016)
[31] MANJUNATHA, A., ANIK, A.R., SPEELMAN, S., AND NUPPENAU, E. Impact of land fragmentation, farm size, land ownership and crop diversity on profit and efficiency of irrigated farms in India. Land Use Policy, Vol. 31, pp. 397–405. (2013).
[32] MOLANO, R., RODRÍGUEZ, P.G., CARO,A., AND DURÁN M.L. Finding the largest area rectangle of arbitrary orientation in a closed contour. Applied Mathematics and Computation, Vol.218 no.19, pp. 9866-9874. (2012).
[33] MÜLLER,J.C.,LAGRANGE,J.P., AND WEIBEL,R. GIS and generalization. Methodology and practice. Taylor and Francis.London. (1995).
[34] OK,A.O. Automated detection of buildings from single VHR multispectral images using shadow information and graph cuts. ISPRS Journal of Photogrammetry and Remote Sensing, Vol. 86, pp. 21-40, (2013)
[35] PENG,S.S. Coal mine ground control. John Wiley & Sons. (1986).
[36] PEURA,M., AND IIVARINEN,J. Efficiency of Simple Shape Descriptors. In: 3rd International Workshop on Visual Form, Capri, Italy. (1997)
[37] PILKEY, W.D. Formulas for Stress, Strain, and Structural Matrices, Publ. John Wiley & Sons, Inc., New York (1993).
[38] PROKOP, J., AND REEVES, A.P. A survey of moment-based techniques for unoccluded object representation and recognition. Computer Vision, Graphics and Image Processing.
Vol. 54, No 5, pp. 438-460. (1992).
[39] REN G., REDDISH D. J., AND WHITTAKER B. N. Mining subsidence and displacement prediction using influence function methods. Mining Science and Technology, vol. 5, issue 1. pp. 89–104. (1987)
[40] ROSIN,P.L. Measuring rectangularity. Machine Vision and Applications, vol. 11, no.4, pp. 191–196. (1999).
[41] ROSIN,P.L. Measuring shape: ellipticity, rectangularity, and triangularity. Machine Vision
and Applications - MVA , vol. 14, no. 3, pp. 172-184. (2003).
[42] SARKAR, A., BISWAS,A., DUTT,M., AND BHATTACHARYA, A. Finding a largest rectangle inside a digital object and rectangularization, Journal of Computer and System Sciences, vol. 95, pp.204-217. (2018).
[43] SMITH,J.R., AND CHANG,S.F. VisualSEEk: a fully automated content-based image query system, In Proceedings of the fourth ACM international conference on Multimedia, 18-22 November 1996, Boston, Massachusetts, USA. pp.87-98, (1996)
[44] WEIBEL, R. Generalization of spatial data: Principles and selected algorithms. In: van Kreveld M., Nievergelt J., Roos T., Widmayer P. (eds) Algorithmic Foundations of
Please do not cite
[45] WHITE, C.L., AND RENNER,G.T. Natural environment and human Society. New York, pp. 590-599. (1957).
[46] ZANDONADI, R.S., LUCK, J.D., STOMBAUGH, T.S., AND SHEARER, S.A. Evaluating field shape descriptors for estimating off-target application area in agricultural fields.
Computers and Electronics in Agriculture. vol. 96. pp216-226. (2013).
![Figure 7: Results of subsidence prediction - A) terrain subsidence [m]; B) subsidence difference [mm]](https://thumb-us.123doks.com/thumbv2/123dok_us/1157657.1617871/10.595.146.467.37.511/figure-results-subsidence-prediction-terrain-subsidence-subsidence-difference.webp)