R E S E A R C H
Open Access
A novel caching algorithm for VoD proxy
implementation and its evaluation including a
new set of metrics for efficiency analysis
Bruno S Neves
1,2*, Anderson S Venturini
2and Altamiro A Susin
1Abstract
Background: Video on demand (VoD) is a fast-growing digital service that requires a substantial amount of hardware resources for its implementation. To reduce the costs of running this service, an alternative is to use proxies that cache the most important portions of the video collection in order to meet the demand for this content in place of the primary server of the VoD system.
Methods: To improve the efficiency of the proxies, we proposed a novel caching algorithm that explores the positioning of the active clients to determine the density of clients inside a time window existing in front of each video chunk. The algorithm attributes a higher caching priority to the video chunks with greater aggregate density in the memory. To evaluate our approach, we compared it with others of similar nature using both traditional metrics like hit ratio, as well as physical metrics such as the use of processing resources. This complementary set of metrics is produced by our simulator that, as far as we know, is the first one of its kind to enable the evaluation of hardware consumption used to implement the VoD proxy.
Results: Results show that the novel algorithm can achieve a higher hit ratio while requiring a little more effort from the hardware. Additionally, it was identified that the processor constitutes the major bottleneck to this application when demand increases.
Conclusions: Among the recent emergence of caching strategies which consider the positioning of clients as criterion for caching, the strategy of prioritizing the chunks with greater density of previous clients showed to be a more efficient solution.
Keywords: Video; Proxy; Caching; Algorithm; Scalability; Hardware
Background
Recent estimates indicate that video traffic, including but not limited to digital TV, video on demand (VoD), and non-real-time transmissions, like media sharing, will account for 86 % of all global data traffic over the network by 2016, and video on demand will account for 54 % of this traffic [1]. The same source estimates that the VoD traf-fic will triple in the same period. This suggests that VoD streaming will require a more suitable support for its oper-ation; otherwise, the cost to expand the video traffic will be challenging.
*Correspondence: [email protected]
1Federal University of Rio Grande do Sul, Osvaldo Aranha Av., 103, 90035-190 Porto Alegre, Brazil
2Federal University of Pampa, Lane 45, 1650, Malafaia, 96413-170 Bagé, Brazil
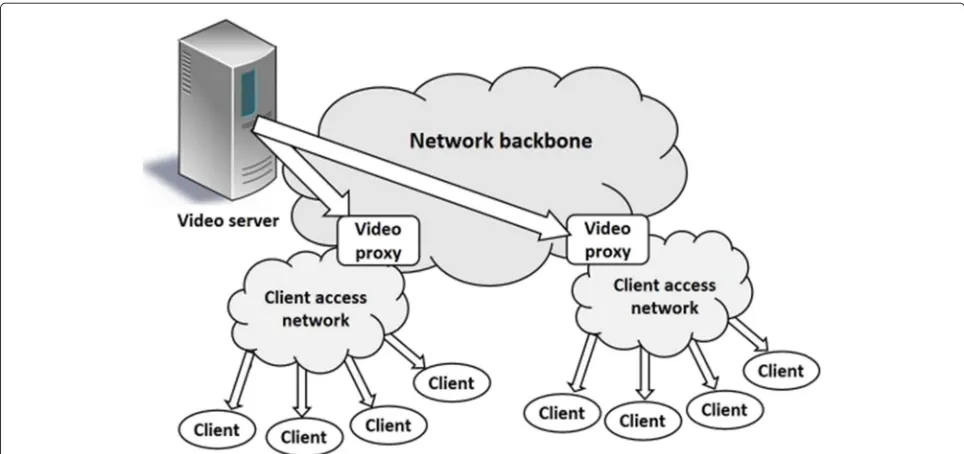
To reduce the consumption of network bandwidth while at the same time providing an improved quality of service, an alternative was created by utilizing proxies near the local networks of the clients. Each one of the proxies acts as a secondary server caching the most accessed informa-tion in order to provide this informainforma-tion to its clients in place of the main video server, as shown in Fig. 1. There-fore, the proxy efficiency is fundamental in determining the total cost and productivity (number of simultaneous clients served by the system) to the VoD service.
Based on this, the most important aspects for the effi-ciency of the VoD proxy is the caching algorithm [2, 3] (also referred to as cache replacement algorithm) used to determine the preferred content to be kept in the cache (memory of the proxy). The best content to store in the
Fig. 1Strategy for using VoD proxies. Proxies serve the VoD clients by reducing the load on the main server and the network backbone
cache is that that will allow the proxy to supply the great-est number of requgreat-ests generated by the clients of the VoD system.
A similar problem is addressed by replication algorithms [3] that create replicas of the content available on the main server and store them in surrogate servers. How-ever, contrary to caching algorithms, replication algo-rithms determine which objects should be replicated and in which servers the replicas must be carried out taking into account load balancing between the surrogate servers as the most important decision factor [4, 5].
We have outlined this difference between the two classes of algorithms to clearly define the scope of the research which focuses on the design and analysis of video caching algorithms employed in VoD proxies. Addition-ally, the main target of our study is a centralized approach1 where it is assumed that the decisions made by a caching algorithm running on a VoD proxy are not based on any kind of collaboration with other proxies in the system.
Many caching algorithms use the history of the access pattern of the clients as a reference to try to predict which portions of the collection will be needed in the future [6–11]. Thus, the most accessed video objects should be stored in the cache in order to easily serve future requests. However, as this prediction begins to fail, the proxy effi-ciency is decreased and the caching algorithm needs to update the frequency history in order to define a new target content to be stored for the next period.
An example of this caching approach is proposed by Li et al. [12] who presents a caching model based on two popularity control variables: the first variable counts the number of accesses to a video object in a short-term
interval (from current to past time) and the second vari-able counts this number in a long-term interval. If the number of accesses observed in any of these intervals exceeds the threshold value for its respective interval, the item is marked with a higher caching priority; otherwise, the item receives a lower caching priority.
The concern of Li et al. [12] in analyzing the relevance of video objects at different moments brings out a broader reflection around the dynamicity relative to the changes in the popularity of the video fragments. However, from our point of view, the main deficiency of the Li et al.’s approach [12] is the positioning of the analysis intervals used by their algorithm since both temporal windows are located from the present to the past. As a consequence, the algo-rithm is subjected to making imprecise caching decisions given that the same variations in the popularity analyzed by it can also cause the actual demand to be different from the one predicted by its estimation variables.
Ishikawa and Amorim [14] presented a caching algo-rithm named Collapsed Cooperative Video Caching (CCVC), inspired by the caching policies used in peer-to-peer networks, that works on two levels. On the first level, the algorithm selects a video with smaller popularity (lower number of active2clients) as a victim. On the sec-ond level, the algorithm decides which parts of the video selected on the first level should be discarded in order to free up space for allocation of the content received from the main server.
In addition, a key aspect of the approach used by Ishikawa and Amorim is to assign a higher caching prior-ity for video blocks allocated between two or more clients who watch the same video. Consequently, the video blocks brought to the memory to serve the older clients of the system tend to remain in the memory to be accessed by the more recent clients who watch the same video. This feature makes CCVC one of the first algorithms to take into account the active clients who have not yet accessed certain portions of a video as a factor in determining which contents should be cached.
More recently, Hong et al. [15] proposed an algorithm (named CC) that, compared with the CCVC, employs, in more clear way, a new paradigm (which we refer to as Look Ahead) to decide which content should be cached. The algorithm takes into account the current position-ing of the clients who are watchposition-ing a particular item of the collection as a way to determine the effective num-ber of hits in the future for each video segment of this item. Only clients who have not yet accessed a particular segment count for the number of future accesses to that segment.
Nevertheless, in our view, one flawed aspect of this approach relates to the fact that the lack of a limit with respect to the temporal distance between the watching positions of the clients and the segment causes the seg-ments at the end of the videos to have a greater number of future requests associated to them, thus remaining in the memory of the proxy although there may be segments at the beginning of the video with higher demand associated to them in the short term.
Finally, Wu et al. [16] proposed a system that estimates the time it takes to occur the access to each video segment. The most important aspect of this strategy is measuring the distance between each segment and the closest client that will access to this segment. When a client closer to a segment performs an access to it, the system automat-ically recalculates the distance between the segment and the next closest client.
This strategy, however, shares the same problem present in Hong’s approach, since by prioritizing the preservation in memory of the segments that will be accessed soon not necessarily the segments with higher demand will be pre-served, because clients’ concentration can be larger near
the segment whose distance to the closest client is also greater.
Methods
According to what was presented in the previous section, the Look Ahead algorithm type, such as [14–16], bases its caching decisions on actual client requests, therefore establishing a more solid baseline in determining which portions of each video must be kept in cache in order to provide greater efficiency to the proxy when the number of concurrent clients is high.
However, we discovered a way to improve the caching logic employed by the previous algorithms of this type, and based on it, we proposed a novel and more efficient caching strategy. Our strategy takes into account the den-sity of clients existing in a bounded region near each chunk thus preventing the clients that are distant of a given chunk to interfere in the calculation of the caching priority for that chunk.
To evaluate our algorithm, we developed a simulator that is not only able to analyze the efficiency using con-ventional metrics (such as the hit ratio), but also is able to evaluate the use of computational resources of the under-lying hardware. Therefore, the simulator enables us to determine how the hardware is able to restrict the sys-tem scalability taking into consideration scenarios where the workload is high. As far as we know, this ability makes our simulator the first one to enable the analysis of the proxy performance from an architectural point of view.
Briefly summarizing, this method is based on three main objectives:
1. The design of a novel and more scalable video caching algorithm for use in high workload scenarios of the VoD service.
2. The development of a simulator capable of identifying the bottlenecks of the subjacent architecture of the VoD proxy.
3. A deeper comparative evaluation of scalability provided by different caching algorithms.
The remainder of this section is organized as fol-lows: the “Proposed algorithm” subsection describes the caching algorithm we propose in this work, while the “Experimental environment” subsection presents the sim-ulator built to assess the performance of our algorithm.
Proposed algorithm
The differentials of our approach arise from the under-standing that, in high-demand scenarios, the proxy should make the best choice with respect to the use of its resources by considering only the actual demand (created exclusively by the clients who have already started their video section in that system) existing inside a short-term time window of a few seconds3 in the direction of the future. Otherwise, the use of these resources aiming at the service qualification for the longer-term demands (possi-ble clients) could reduce the proxy scalability to support the current demand.
According to this view, when the proxy works to serve potential long-term requests (as occurs when caching pre-fixes), the cache content exchange rate tends to be smaller since under these conditions the caching philosophy does not prioritize current load conditions. As a consequence, the bandwidth associated to all the proxy devices tends to be underutilized since the system performs no data flow or any other kind of computation to update the cache con-tent aiming to sustain the best scalability possible for the proxy and, thus, meet the current load.
Conversely, according to our proposal, under high work-load conditions, the caching algorithm should constantly be organizing the data allocation flow in order to maxi-mize the proxy productivity. For this purpose, it should evaluate and select what video chunks have the best demands, i.e., higher number of clients who will access them in short term, prioritizing the data allocation for this content.
By implementing a time window to determine the den-sity of clients (number of clients per time interval) in front of each video chunk, our algorithm is able to work more actively to monitor and update the system variables according to each load state, making most appropriate use of the available hardware.
The sub-subsections below describe the Current demAnd Rather Than futurE (CARTE) algorithm we developed to evaluate the impacts on the VoD proxy per-formance generated by the use of the design features previously mentioned. To review, they are as follows:
• Monitoring the density of clients in future short term.
• Reacting to the current load state conditions by performing memory content updates.
• Employing all available hardware bandwidths to increase the scalability of the proxy.
The “Video organization” sub-subsection shows how the algorithm logically divides the videos into smaller chunks and discusses the basics of the caching pri-ority binding for each kind of chunk. The “Caching logic” sub-subsection explains in more detail the caching decision logic employed by CARTE, presenting mathe-matical descriptions on how our algorithm works.
Video organization
The strategy employed by CARTE to divide the videos in smaller chunks, calledSequences, is inspired by the Link-ing Slots Management Policeused by the CCVC algorithm [14]. As we demonstrate below, the organization of video into sequences allows a more efficient use of the available memory resources in comparison to the widely used clas-sical division of the videos into segments of equal size. A similar reasoning could be utilized to compare the use of sequences to the use of variable length segments, such as those proposed in [17].
Figure 2 illustrates the video organization process used by CARTE where each square represents a video block and the horizontal lines of successive squares (there are three in the figure) correspond to the same video clip. Each row from top to bottom describes the state of the blocks belonging to the video clip 1 s further along in time. Squares containing a white circle represent the video blocks that are not present in the memory of the proxy at that current time. Each white square indicates that one or more clients are receiving the correspondent video block. Blocks that are being read cannot be discarded by the replacement algorithm when free memory becomes scarce. Hatched squares indicate a trail of blocks left in the memory by a client as it progresses every second (assum-ing constant bit rate (CBR) transmission) to the next video block. Hatched blocks represent the preferred content for discarding when the free memory is scarce.
When the reading position of a client limits a trail to the left, the algorithm increases the caching priority of the blocks belonging to the trail to an intermediate value (indicated by triangles within the square). Since these blocks tend to be utilized by the clients who are positioned
on the left of the trail, the algorithm prevents the network access to obtain this content again with the main server. Henceforth, we will refer to each group of blocks laterally limited by two or more clients, as asequence.
As shown in the scenario depicted in Fig. 2, several sequences can be formed along the service delivery time. As the demand increases, i.e., the number of clients to be served by the proxy becomes higher, the memory spaces used to allocate the video blocks for the clients (espe-cially the new ones) need to be obtained from a recycling process of the available sequences.
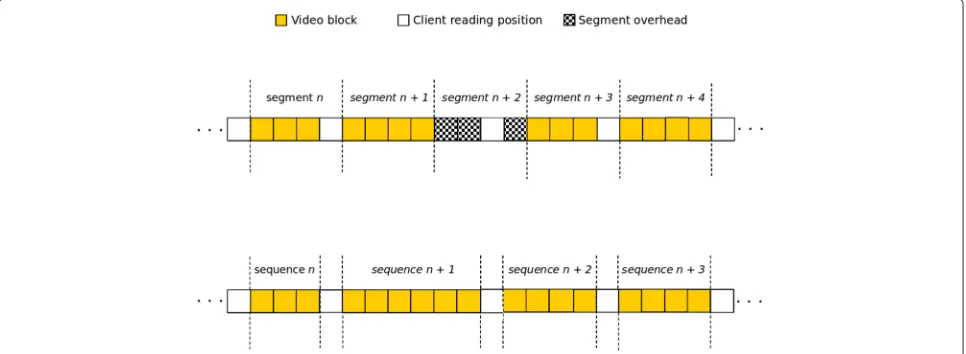
In terms of efficiency, the main advantage linked to the design philosophy using sequences is illustrated in Fig. 3. It compares the logical video organization through sequences with the video organization through segments of equal size. In the figure, the two streams of video blocks, on the top and on the bottom, correspond to the same video clip. The top of the figure shows how the video clip is organized using segments of the same size where each segment contains four video blocks. The bottom part of the figure shows how the same video clip is organized uti-lizing sequences created from the watching position of the clients.
In the video organization through fixed size segments, any segment that is being accessed by a client cannot be removed from the memory. Consequently, for the video clip shown in Fig. 3, there are only two segments, totaling eight video blocks, that could be removed from the mem-ory by a replacement algorithm. In contrast, in the video organization through sequences, only the video blocks that are currently being accessed by the clients cannot be removed from the memory by the replacement algorithm. As a result, all existing sequences in the video clip are eligi-ble to be discarded, totaling 17 video blocks (among those present in Fig. 3).
Another example is assuming that the replacement algo-rithm has assigned a higher discard priority to the interval between the last two clients (on the left side of Fig. 3, for both strategies). The entire interval can be removed from the memory only if the video organization mech-anism employs the sequences. If the video organization uses segments of the same size, the final part of the inter-val, which corresponds to the first two hatched blocks belonging to the segment n + 2, cannot be discarded despite its low probability in receiving an access in the future.
Thus, the sequence mechanism more precisely defines the areas of interest for the action of the replacement algorithm, enabling a better scalability of the proxy. For this reason, we chose to employ this scheme as a base for the implementation of our algorithm, described in a complementary manner in the next sub-subsection.
Caching logic
According to the video organization strategy described in the previous sub-subsection, the binding of priorities to memory spaces in our system considers that:
• Blocks that are currently being read by one or more clients cannot be discarded from memory.
• When free space is available, the memory employed to allocate the content coming from the main server should be obtained primarily from that portion of unused memory blocks.
• When free memory becomes scarce to allocate the content being streamed from the main server, the proxy tries to discard a trail of blocks left in the memory as a result of the service delivery made previously to a client. If there are no blocks in this condition, the algorithm selects a sequence for
discarding in order to free sufficient space to allocate the new content.
The victim sequence is chosen based on the caching pri-ority of the available sequences, which is calculated incre-mentally along the sequences formation by combining the following factors:
• Start position (SPs,v): corresponds to the current
position of the first block (leftmost) belonging to the sth sequence of the video v, named Sv.
• Sequence size (SZs,v): number of blocks belonging to
theSv.
• Density of clients (DCs,v): total number of clients
present in a window ofK blocks preceding Svwho
potentially will perform access to this sequence.
This way, the caching priority for each sequence (CPs,v)
is defined by Eq. 1, where the higher the value forCPs,v,
the greater the probability of the sequenceSvis cached in
the memory of the proxy.
CPs,v=(DCs,v/SZs,v)∗[SPs,v] (1)
where DCs,v=
TCv
i=1
Ci,v (2)
suchthat Ci,v=
1, WBs,v≤Pi,v<SPs,v
0, otherwise (3)
and WBs,v=SPs,v−K (4)
In Eq. 2,Ci,vis a binary variable that states if the access
position of the ith client of video v (Pi,v) is (1) or not
(0) confined within the time window of the sequenceSv. TCv informs the total number of clients that are
watch-ing the videovandWBs,v, present in Eqs. 3 and 4, informs
the current position of the left edge of the time window precedingSv.
As shown in Eq. 1, our algorithm prioritizes the caching of the sequences with the highest density in the short term (indicated by the number of existing clients within the window of K blocks that precedes each sequence) since this choice benefits a larger number of clients. To uniformly apply this design decision, the sequences in for-mation at the video prefix that does not have previousK blocks yet can not be discarded as the clients density for these sequences can not be defined if the time window is not completely constituted.
In addition, Eq. 1 shows that the algorithm also favors the preservation of smaller sequences in the memory, since this choice allows for better scalability due to lower consumption of memory resources.
What is more, the variableSPs,v, that appears in brackets
in Eq. 1, is used as the tiebreaker and it is only multiplied
by the result of the division when two or more sequences have the same value for CPs,v. Accordingly, when a tie
occurs, the sequences closer to the end of each video receive higher caching priorities, aiming to enable not only the existing clients within each window to perform access to these sequences but also all existing clients in the longer term.
Lastly, CARTE is able to support VCR operations such as “jump forward,” “jump back,” or “abort.” When these events occur, the algorithm updates the density of clients of the time windows affected by the operations performed by clients. So for instance, when a client aborts the exe-cution of a movie, the algorithm subtracts by one unit the density related to the window where the client was posi-tioned at the time he or she decided to abort the video transmission.
However, we emphasize that, aiming to adopt the same strategy employed by the authors of the algorithms we selected (using the criteria described in the “Results and discussion” section) to carry out a comparative analysis with the CARTE, we chose to execute the greatest part of our simulations without the occurrence of VCR events. In this way, we configured an impartial comparative environ-ment to assess the performance of our algorithm.
Experimental environment
As far as we know, in most publications in the field of developing proxies for VoD, the researchers have devel-oped their own simulators (as was done in [18]), or they have adapted existing network simulators (as in [19]) to perform their experiments in order to avoid the cost and complexity inherent to the development of real environ-ments for prototyping their systems.
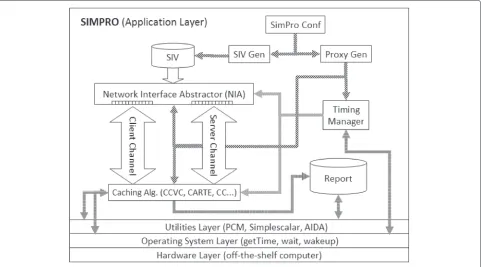
Synthesis and simulation flows
Figure 4 illustrates the steps of the simulation flow man-aged by SIMPRO. The flow starts by the generation of the simulation input vector (SIV) which describes the workload for the proxy simulation. The basic element for constructing the SIV is a request to create a video session. Each request specifies the arrival time, the video identifier, and the session duration (used to simulate scenarios with early departure of the clients).
The SIV file is automatically generated from a set of parameters configured by the designer viaSIMPRO Conf panel. In addition to the total simulation time, the param-eters used for configuring the workload are as follows: the maximum number of requests (client arrivals), the quan-tity, the size and the bit rate of the videos available for access, and the distribution model for the dispersing of requests over the collection.
The requests distribution model is based on the use of Poisson [20] to define the interval between the arrivals of clients. The greater the value of the Poison coefficient (λ) is, the greater the average time between the arrivals of the requests to the proxy will be. In addition, the Zipf distri-bution [21] was used to specify the way each client will be associated to one video in the collection. The greater the Zipf coefficient (θ), known as “skew,” the greater the con-centration of the requests over the most popular videos of the archive, with an exponential decay. In other words, if the value ofθ is closer to zero, the probability of access to the videos is more homogenous.
The next step in the simulation flow is to configure the proxy architecture that comprises of the following:
• Caching Algorithm: described and/or selected by the designer of the proxy.
• Timing Manager: designed to provide support for the synchronization of the proxy operations.
• Network Interface Abstractor (NIA) : used to store the SIV file and the video blocks that enter and exit the proxy.
During the simulation, at every second reported by the Timing Manager, the caching algorithm checks the NIA buffers for the presence of requests whose arrival time is equivalent to the current simulation time. For each like request, the algorithm creates a session handler and stores it in the buffer of active clients. Then, the algo-rithm reads each handler present in the clients buffer to discover the current reading position of the respective client. After that, it checks whether the requested con-tent is available in the video memory. If so, the algorithm transfers the correspondent video blocks from this mem-ory to the NIA buffers. Otherwise, it decides (based on its prioritization logic) if it should or should not transmit a video requisition to the main server (via Server Channel) to obtain this content.
Lastly, during the SIMPRO design, we took into consid-eration that, for the most popular videos, memory speed is a requirement as important as memory capacity, espe-cially when the proxy is serving hundreds (or thousands)
of concurrent clients whose requests are concentrated on a few, more popular videos on the collection. In these conditions, even if there is plenty of space in the disk to fully allocate these videos, the disk bandwidth would not be able to sustain the required throughput to serve the active clients who are watching these videos [22, 23]. On the other hand, as demonstrated by [24], the high band-width currently supported by both the I/O buses and the network interfaces causes none of these components to conform a bottleneck to the target application, even in scenarios of high workloads.
Thus, we were concerned with designing a simulator to evaluate the proxy efficiency with focus on the per-formance of the processor and the RAM, since these devices are inexorably the main elements capable of pro-viding, as well as limiting, the system scalability in face of the growing demand for the most popular videos on the system.
Basics of the measurement process
To clarify the performance evaluation of the proxy before the demand produced by a workload, we introduced the concept of round of service which consists in all the tasks undertaken by the proxy in order to serve each of its active clients with a predetermined amount of video4.
Accordingly, the main operations that the system needs to perform during execution of a round of service are as follows:
1. Check for the presence of the requested content in memory and, when necessary, send a content request to the main server.
2. Receive the data requested to the main server and execute the replacement algorithm to release space in the memory to store the new content.
3. Admit new clients and close the sessions of the clients that ended watching the required content. 4. Update the caching priorities of the video objects. 5. Deliver the respective content to each client.
Besides, assuming that the proxy sends the content to its clients using a constant transmission rate equal to the (also constant) coding rate of the video, a new video block, containing 1 s of video, should be delivered to each active client at every second. Thus, in a scenario where the deliv-ery of video blocks to the clients is always the last task per-formed in a round of service, we concluded that the proxy will have missed its deadline to serve part of its clients if a round of service takes a time longer than 1 s to finish. By using this condition as a reference, we defined the round of service as the unit of effort to evaluate the proxy perfor-mance and, consequently, all results produced by SIMPRO were primarily related to the performance of the system to execute one or more rounds of service.
Given this, as shown in Fig. 4, the last step of the simula-tion flow consists in generating the performance report of the proxy, which is done in accordance with the simulation mode selected by the user. Three simulation modes are currently supported by SIMPRO: (1) real time, (2) discrete time, and (3) functional.
In real-time mode, the simulator collects and temporar-ily stores in the RAM the execution time for each round of service. To enhance the data set produced by the real-time simulation with metrics like number of processor cycles and memory bandwidth consumed per round of service, the SIMPRO communicates with the physical level, using the Intel Performance Counter Monitor (IPCM) library [25]. IPCM utilizes dedicated hardware existing inside the processor to measure software performance without interfering on the execution time of the applications.
In discrete mode (slower simulation), SIMPRO inter-acts with Simplescalar [26] to produce additional infor-mation about the software–hardware interface, such as an instruction profile. This profile describes the instruc-tions most frequently used by the software, allowing the designer to create architecture customizations to increase the VoD proxy performance.
Another advantage provided by integration with Sim-plescalar is the capability to evaluate the application per-formance using different architectures. This is especially important considering that the IPCM is restricted for use with Intel processors. Thus, we can alternatively use dis-crete mode to evaluate the same metrics measured by IPCM when Intel processors are not the target for the evaluation or when the physical target processor is not available to execute the simulation in real-time mode.
Lastly, in the functional mode (fast simulation), our sim-ulator produces values for hit ratio5, number of block substitutions, and network bandwidth demanded in each round of service, as well as other more detailed infor-mation (if requested by user), such as system debugging data. In this mode, the proxy performs all its operations to preserve the coherent state of the system along the exe-cution of the rounds of service, except the data I/O to move video block to and from the RAM. As a result, the simulation time becomes significantly faster than the one obtained through real-time and discrete modes, allow-ing the designer to get a quick feedback in terms of the metrics most widely used to perform both behavioral and efficiency analysis of a VoD proxy.
Validation of the performance data
Table 1Workload parameters for functional validation. Data originally used in [27] for validation of the CCVC algorithm
Workload parameter Value
Zipf coefficient -θ(skew) 0.271
Poisson rate -λ(sec) 3
Number of videos 100
Cache size (percentage of the collection size) 10
Simulation duration (min) 60
Video transmission rate (Mbps) 1
Video length (min) 60 (= 450 MB)
CCVC authors are described in Table 1 and the origi-nal performance results (about the network consumption in the main server-to-proxy channel) used for compar-isons are presented in Fig. 5a (see the curve labeled as “Reference”). In the same figure, for the same loading conditions, we plotted the results produced by functional simulation performed by our simulator.
As shown in Fig. 5a, the results obtained through SIM-PRO simulations6 are almost identical to the original results with a maximum difference of 2 % (for time = 58 min7). This permits us to expect that the results produced by SIMPRO in functional mode are valid, although we are not able to validate the entire set of metrics measured by our simulator due to the unavailability of measurements performed with the same metrics by the CCVC authors.
In our analysis, we have used the functional mode to measure the hit ratio produced for all algorithms. The main reason for this choice is that this metric is less restrictive than channel consumption since the bandwidth associated to the proxy-main server link may be very limited in some operating scenarios.
Regarding the validation of the real-time and discrete-time modes of our simulator, it was necessary to create a set of benchmark results by collecting data performance of the VoD proxy during its execution in a more realistic context which we refer to as “networked implementation”.
For this implementation, we used two Dell PowerEdge M620 computers, both equipped with two Intel Xeon E5-2600 processors, 16 GB of DDR3 1066 MHz RAM and Broadcom 57810S-k dual-port 10 gigabit NIC, capable of performing TCP/IP operations directly in hardware (TOE technology). Both computers run SUSE Linux Enterprise Server (3.0 kernel), and they were connected to each other using a 10 gigabit optic fiber channel. All network traffic between these computers was implemented directly in the C source code using the sockets programming library.
To reproduce a typical VoD operation scenario, we con-figured one of the computers to run the VoD proxy using the CCVC algorithm and the workload presented in Table 1. The other computer was configured to perform simultaneously the behavior of the clients and the main server of VoD system. In this experiment, the video blocks received from the proxy were not decoded after the receipt. The validation was performed by measuring and com-paring the service time (time to perform one round of service) resulting from the execution of the networked implementation and the service time resulting from the execution using SIMPRO in both real-time and discrete-time modes. We used the IPCM software to measure the processing time produced by the networked implementa-tion, taking into account all delays caused by the RAM. To obtain the service time by means of the discrete mode of the SIMPRO, we measured the number of cycles by running the proxy on a PISA architecture, available on the Simplescalar toolset, which according to [28] has sev-eral similarities with the physical processor we used in these experiments. After that, the number of cycles was multiplied by the clock period of the target processor.
As shown in Fig. 5b, both the discrete- and real-time modes produce results very close to those produced by the networked implementation. The error produced by the real-time simulation was not larger than 5.8 % (for time = 26 min), while the error produced by discrete mode was not higher than 6.2 % (for time = 59 min). These errors are acceptable according to similar results presented in [29–31] for experiments of an equivalent nature.
(a) (b)
Considering that we configured our simulator to not consider the TCP/IP processing cost, based on the capa-bilities of the TCP Offload Engine (TOE [32]) network interfaces, we attributed these differences to the execution of some TPC/IP operations on the processor, since, unfor-tunately, the TOE technology available on the computers used in this experiment does not support the full layer set of the TPC/IP protocol.
Results and discussion
This section presents and discusses results of the perfor-mance comparison of the three video caching algorithms previously presented:
• CCVC and CC (both introduced in the “Background” section), since they are pioneers in the proposition of theLook Ahead caching paradigm.
• Our algorithm, named CARTE, described in the “Proposed algorithm” subsection of the “Methods” section.
As a strategy to obtain each result, 30 simulations were executed obtaining confidence of at least 95 % to an inter-val of confidence less than 1 % of measurement inter-value.
The following subsections are organized as follows: the “Workload and operating parameters for the evaluation of the proxy” subsection describes the workload and oper-ating parameters to run the simulations. The subsection entitled “Evaluation of the hit ratio and service time for the execution of the caching algorithms” analyzes the hit ratio and service time produced by the algorithms and the “Evaluation of the amount of computational resources used by each algorithm” subsection shows the evalua-tion of the computaevalua-tional resources consumed by each of them. The subsection named “Impacts produced by the early departure of clients” analyzes the performance of the algorithms when executed in scenarios with early depar-ture of clients with the aim of demonstrating that our algorithm also shows better performance under these load conditions. The “Analysis of the relation between the size of the time window and the workload” subsection presents a study of the impacts on the hit ratio caused by the vari-ation of the main design parameter of CARTE: the size of the time window used to define the space for the count of the clients who are in front of each video sequence. Finally, the “Procedures to configure CARTE” subsection shows the strategy currently being used to configure our algorithm adequately for each scenario.
Workload and operating parameters for the evaluation of the proxy
The results presented in this subsection were all obtained from simulations performed on a general purpose server organized with two Intel Xeon E5530 (2.4 GHz), 16 GB of
DDR3 1066 MHz RAM and SUSE Linux Enterprise Server (3.0 kernel).
The topology assumed for the experiments considers scenarios where all access requests for the content pro-vided by the VoD system are routed through the proxy. This way, using the current position of the active clients, each caching algorithm determines (based on its prioriti-zation logic) which video chunks must be preserved in the memory (if the chunks are already allocated in memory) or requested to the main server. Moreover, the requests for video chunks to the main server are done assuming an existence of a limited bandwidth in the link that connects the proxy to this server, as occurs in real scenarios.
Table 2 shows the configurations used for building the workloads and other operating conditions employed in our simulations. The set of acronyms presented in the table were used to substitute the full names of the working parameters along this section.
The experimental methodology consisted of selecting one-by-one, each of the working parameters for variation and evaluation, and fixing all other parameters using a default value. This way, we expected to clearly observe the influences caused by each parameter on the efficiency of the system. For this purpose, the third column on Table 2 shows the standard value to be used when the concerned parameter is not under variation. Otherwise, the fourth and fifth columns, respectively, present the range and the increment step to perform the parameter variation.
The interval for variation is obtained by proximity in re-lation to standard value. The motivations for the use of the standard values presented in Table 2 are described below:
• TR : the configuration adopted corresponds to the minimum bandwidth necessary to stream movies with HD quality [33].
• NB : in [8], it was demonstrated that the average requisite for NB, for similar workload conditions, is not superior to 700 streams. This value was used as standard configuration, except during the variation of the parameter IA, where the standard value of NB was reduced to 200 streams to prevent all algorithms from obtaining a high hit ratio (in response to the increase in IA) hindering in this way the observation of impacts caused by modification of this parameter.
• MS : according to the explanations made in the sub-subsection entitled “Synthesis and simulation flows” (“Methods” section), we set the standard value for MS parameter to the maximum quantity of RAM available on the computer utilized to perform the experiments, allowing the execution of simulations with the highest possible workloads.
Table 2Working parameters
Acronym Parameter name Standard value Range Step
TR Video transmission rate (Mbps) 5 – –
NB Max. proxy-server net. bandwidth (streams) 200; 700 200–700 50
MS Memory size (GB) 14 4–14 1
VL Video length (min) 90 (=3.4 GB) 90–240 (=3.4–9.15 GB) 30
NV Number of videos 100 50–150 10
ZC Zipf coefficient -θ(skew) 0.271 0–1 0.25
IA Average interval between arrivals -λ(sec) 3 1–10 1
SD Simulation duration (min) VL + 1500 rounds of service – –
TW Time window size (sec) – 1–300 1
SS Segment size (seconds of video) 1 (≈0.63 MB) – –
The third column shows the standard value to be used when the parameter considered is not under variation. Otherwise, the fourth and fifth columns present the range and the increment step, respectively, to perform the parameter variation
• NV : taking into account the information provided in the sub-subsection entitled “Synthesis and simulation flows” (“Methods” section), the standard
configuration was inspired by the quantity of new (and highly popular) videos introduced daily/weekly by the VoD providers7[34, 40, 41].
• ZC : the standard value for the this parameter has also been used for modeling the video popularity skew of video rental scenarios in [34, 42–46].
• IA : according to [47] and [16], the configuration used corresponds to a typical scenario of high workload for VoD proxies for similar video lengths.
• SD : we expected during the extra interval of 1500 rounds of services both the entry and exit of clients in the system. So, to produce each basic result, we measured the average performance during this time interval since, in this way, each presented result represents the performance obtained for a full operation of the VoD proxy.
• TW : for each scenario, we evaluated the best configuration for our algorithm by varying the size of the time window in a range of 1 to 300 s. This way, along comparisons with the other algorithms, we informed above each result presented for CARTE the configuration of TW that produced the best
performance for such scenario.
• SS : in all of the experiments, the size of the video segments used for CC algorithm was equivalent to one video block of 1 s of video. This choice was made in order to prevent the CC algorithm from
experiencing a potential drop in its hit ratio due to the waste of memory that may be caused by the use of larger segment sizes, as explained in the “Video organization” sub-subsection of the “Methods” section.
Following the same strategy employed by the authors of the algorithms we selected to carry out a comparative
analysis with the CARTE, we chose to use experimen-tal scenarios (except those mentioned in the “Impacts produced by the early departure of clients” subsection) where the clients require the video from the beginning to the end. Therefore, we intended to configure a fair com-parative environment to assess the performance of our algorithm.
Evaluation of the hit ratio and service time for the execution of the caching algorithms
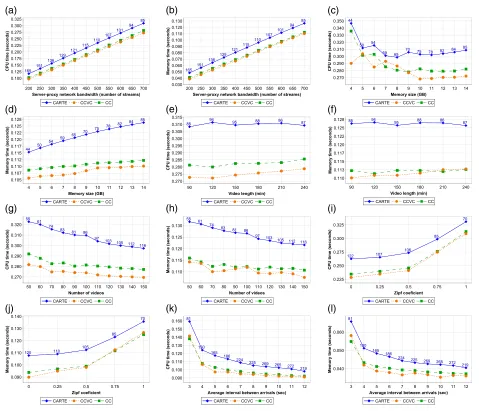
According to the workload and operating conditions described in the previous subsection entitled “Workload and operating parameters for the evaluation of the proxy”, the graphics in Fig. 6a–j describe the impacts produced by the variation of the working parameters on the average hit ratio (graphics a, c, e, g, and i) and service time (graphics b, d, f, h, and j) produced by the analyzed algorithms.
A first and general conclusion about the data presented is that, at the cost of a slightly higher service time (due to the more complex replacement mechanism), the hit ratio produced by CARTE is higher than that provided by CCVC and CC.
As demonstrated by Fig. 6a, c, i, and k, the increase in NB, MS, ZC, and IA also produced the increase on the hit ratio for all algorithms. Respectively, this occurs because of the following:
• When taking into consideration the limitations imposed by the storage capacity of the memory, the increase on NB enables the proxy to carry out a greater volume of substitutions on the cache, thereby also allowing a greater number of clients to have their demands met.
• The higher the value for MS, the greater chances of the stored content to remain in the memory to be accessed by other clients.
(a) (b) (c)
(d) (e) (f)
(g) (h) (i)
(j) (k) (l)
Fig. 6 a–lPerformance of caching algorithms. Results for hit ratio and service time
consequence, the memory requirements to support the active clients are reduced and a higher number of blocks belonging to the requested videos will remain in the memory to be accessed again by newer clients.
• A larger value for IA, for a fixed video length, makes the number of active clients of the proxy to decrease. Accordingly, both memory and network
requirements to meet the demand are lowered causing the system performance to increase.
Still with regard to Fig. 6a, c, and i, it is important to highlight two aspects taking into account the performance of our algorithm. Firstly, the greater the availability of resources (memory capacity and network bandwidth) is in relation to the demand, the higher the hit ratio pro-vided by CARTE in comparison to that one propro-vided by
the other two algorithms is. Secondly, CARTE achieves a comparatively higher hit ratio even in scenarios where the popularity of the videos leans towards equality (i.e., when ZC assumes its lowest values). From this, we concluded that our approach is not only in fact more scalable but also is capable of leveraging the performance of the proxy even in the worst-case scenarios when the video access prob-ability cannot be easily predicted, such as it occurs, for example, at certain periods for the most popular items of a collection [48].
between the hit ratio of CARTE and of CCVS at 8.1 % while the difference for CC is 11.8 %. The higher per-formance provided by our algorithm results both from allocating the smaller sequences in the memory, which results in a better use of the storage resources, as well as considering at a local level the differences that exist between the densities of clients formed along the arrivals of the clients. The latter factor contrasts with the behav-ior of the CCVC and the CC, which only look at clients as a whole who watch a particular video to decide which portions of the contents should be kept in the memory.
Contrary to what occurs in graphics a, c, i, and k of Fig. 6, graphics e and g of this figure demonstrate that the increase applied to the working parameters produce the decrease of the hit ratio for all algorithms. This opposite effect occurs because of the following:
• For each increase on VL, while the new clients request the access to the prefix of each video, the older clients continue moving towards the more distant end of the video, taking longer to conclude their session. This causes the number of active clients to increase and to become dispersed over a larger video space, resulting in higher memory and network requirements, dropping the hit ratio.
• Increasing the number of videos causes the clients to be spread over a larger collection. Consequently, since ZC remains constant along the experiment, these clients are directed to portions of the collection that have not been accessed yet by other clients or that have been accessed for a long enough period of time to cause it to be removed from the memory.
By analyzing the information available on the right side of Fig. 6, it is possible to see that in graphics b, h, and j the service time for each algorithm, in general, follows the growth produced on hit ratio. This occurs because each algorithm needs to employ an effort to transfer video blocks from the local memory to the network interface in proportion with the number of clients to be served. However, in the scenarios represented by the graphics d, f, and l of Fig. 6, the service time does not follow the growth of the hit ratio. This occurs because of the following:
• The larger service time obtained for the smaller memory sizes is resulting of a greater processing to continuously change the content available in the cache, aiming to minimally store the video blocks that are a step forward in the execution line of the clients.
• If VL is small, the number of active clients is also small. However, when VL is small, the availability of resources compared to the number of active clients is greater and the hit ratio is higher. Following an inverse reasoning, as VL increases, the hit ratio
decreases, but the number of active clients increases. Thus, the number of clients actually served by the proxy tends to remain roughly constant along the variation of VL and, as a result, the service time also remains nearly stable during this period.
• As IA increases and VL remains constant in the experiment, the number of active clients is reduced, causing the drop of the service time.
The average differences in the number of hits and sim-ulation time between CARTE and CCVC for all simula-tion scenarios were 12.9 and 11.3 %, respectively. For the same metrics, the differences obtained when the working parameters assumed their standard values were of 14.6 and 11.6 %, respectively. Lastly, the maximum difference in the number of hits between these algorithms, obtained during the variation of the parameter NV (Fig. 6g) when NV was set to the value of 70, was 17.3 %, for a corre-sponding difference in the service time of 12.8 %.
There are two reasons for the better hit ratio obtained by the CARTE. First, as mentioned before, CCVC employs a Least Frequently Used (LFU) algorithm in the begin-ning stage of the replacement process to define from which video the sequences will be discarded. Therefore, unlike the policy executed by the CARTE, which assumes that the sequence to be replaced can come from any cached video, the strategy used by CCVC reduces the space of alternatives for the action of the replacement algorithm, since the selection of a victim sequence must respect the scale of popularity (access frequencies) of the videos.
Secondly, once the video of smaller popularity has been chosen, CCVC selects the sequence closer to the end of the video for disposal since in this way (according to the view of the CCVC authors) the proxy needs to employ its resources for a shorter time to recover back the removed content with the main server to serve the clients who are moving toward the video sequence removed from mem-ory. However, since the sequences move jointly with the movement of the clients, even the sequences that have a greater quantity of previous clients in the short-term tend to be disposed when they begin to get close to the end of the video. As a result, the efficiency of the CCVC algorithm tends to decrease due to this priority inver-sion during the final stage of video transmisinver-sion to the clients.
NV when this parameter was set to the value of 70, was 18.9 %, for a corresponding difference in the service time of 10.4 %.
As mentioned in the “Background” section, the origin of the lower hit ratio related to the CC system relies on the tendency of excessive prioritization of segments posi-tioned at the end of the video. This occurs because this algorithm calculates the total number of active clients who have not yet requested access to a given video segment as a way of estimating the number of hits which will be performed in the future for this segment. Consequently, the algorithm gives preference to storage of the long-term demands, instead of favoring the short-term ones, causing a drop in its performance when the momentary load con-ditions points to the storage of the initial or intermediate portions of the videos.
Evaluation of the amount of computational resources used by each algorithm
Figure 7 depicts, for the same system and load con-figurations used in the construction of Fig. 6, how the physical resources of the target architecture are used. This set of data was obtained through sim-ulations performed in real-time mode supported by SIMPRO.
Using the same operating specifications, we collected an instruction profile which is also presented in this subsec-tion. To obtain this supplementary data, we ran simula-tions using the discrete mode of our simulator. For this purpose, we instantiate a PISA architecture following the same strategy we used to perform the SIMPRO validation (described in the “Validation of the performance data” sub-subsection).
(a) (b) (c)
(d) (e) (f)
(j) (k) (l)
(g) (h) (i)
In Fig. 7, the graphics on the left (a, c, e, g, and i) describe the time consumed exclusively by the execution of instruc-tions on the processor without delays produced by the memory system. The graphics on the right (b, d, f, h, and j) describe the time required to perform data transfers to and from the memory. This memory time considers the full delay necessary to perform all memory transfers that includes, besides the I/O flow of video blocks, the traffic resulting from the access to the program variables and the data structures used to support the proxy operations.
In most graphics available in Fig. 7, the CPU and the memory follow, although not in the same proportion, similar behavioral trends. This occurs because the effort performed by the proxy is dominantly determined by the number of clients served by the system. However, under certain circumstances such as that represented by Fig. 7c, d, the behaviors of the times of the CPU and the memory may differ.
This difference occurs because as the memory size decreases, the algorithms execute a greater processing (resulting in a larger CPU time) to continuously promote the exchange of the video blocks available in the memory aiming to allocate the next content that will be accessed by the clients. However, as the memory is reduced, the hit ratio also decreases, resulting in a lower volume of clients served by the proxy and, consequently, a shorter memory time to transfer the required amount of video blocks from the memory to the network.
Furthermore, as shown on the full set of results avail-able on Fig. 7, the processor consumes on average about two to three times the time required by the memory to execute the application. The difference between the time consumed by these components demonstrates that the processing core tends to be the main bottleneck for the service provision when the demand increases relative to the amount of resources available.
The analysis of the data produced by the simulation in the discrete mode has revealed that, on average, the arith-metic instructions account for the majority of the exe-cuted instructions by 63.2 %, whereas memory access and control flow account for 28.32 and 8.38 %, respectively. These results, in conjunction with those produced by the simulation in real-time mode, suggest that the develop-ment of a dedicated hardware to support the basic proxy operations tends to contribute to a significant increase in the efficiency of this application while reducing the costs for implementing a video on demand system.
Taking into account the comparative analysis of the resources consumed by each algorithm, the results demonstrated that our strategy demanded on average 11.4 % more processor time than CCVC and 8.7 % more than CC, for a difference in memory time of 12 and 9.7 %, respectively. When the working parameters were set to their standard values, the processor time spent by
our algorithm was 11.8 % higher than the one consumed by CCVC and 8.9 % higher than the one spent by CC, also consuming 12.8 and 11.1 % respectively more time to perform the necessary memory accesses.
Moreover, the differences found in terms of processor time in relation to CCVC and CC, considering the sce-narios where CARTE obtained the largest differences in hit ratio to these algorithms, were 12.6 and 10.1 %, respec-tively. Considering these scenarios, the difference found in memory time for comparisons between CARTE and CC was 12.4 %. Comparing CARTE and CCVC, the differ-ence found for this metric was 14.7 %. The origin of these differences is based on three main aspects:
Firstly, the processing time tends to maintain an approx-imate proportion with the number of clients served by the system. Consequently, the gaps between the hit ratios produced by the algorithms contribute predominantly to the achievement of the differences observed between the consumption of resources.
Secondly, the processor time produced by the CC algo-rithm is also a consequence of the higher management cost attached to the video organization into segments of equal size. While this strategy enables the CC algo-rithm to obtain its highest hit ratio (according to the description made in the subsection named “Workload and operating parameters for the evaluation of the proxy”), it also contributes to an increase in the processing time of this algorithm. This occurs because, unlike the CARTE that binds a unique caching priority to multiple video blocks video encompassed into each sequence, the CC system assigns one priority to each video block allocated in the memory, thus requiring more processor time for this work. The mechanism for binding priorities used by CC has not produced a sufficient increase in the use of resources on the point of exceeding the consumption pro-duced by CARTE (which mainly results from its higher hit ratio), but it does cause the CC to utilize more resources than CCVC, although the hit ratio produced by the CC is lower than that produced by CCVC in most scenarios analyzed.
Regarding the behavior of the CC algorithm, although there is a tendency for the segments closer to the end of each video to receive a higher caching priority in relation to the segments closer to the beginning, the algorithm tends to enable a greater competition for the spaces avail-able in cache when compared to CCVC. This is because at certain moments the load conditions may suggest that some segments near the beginning of a video of greater popularity have higher precedence over the segments closer to the end of a less popular video. In this context, the CC algorithm creates conditions for the execution of a larger volume of content replacements, consuming to this end a corresponding amount of resources.
In contrast, our algorithm was designed to allow any video chunk belonging to the collection (regardless of the position occupied within each respective video) to receive a higher caching priority, basing its caching decisions exclusively on the current load conditions inside each time window. As a result, the algorithm tends to react more frequently to the variations that occur in the distribu-tion of the clients along the execudistribu-tion, thereby performing a higher volume of content updates on the cache with proportional impacts on the resources consumption.
Impacts produced by the early departure of clients
To model the behavior produced by the proactive session closing by VoD clients, we used the abandonment curve shown in Fig. 8, which was created from the data produced during the accesses to a commercial VoD proxy [34].
To analyze the impacts of the early exit of clients, we have reassessed the performance of the caching algo-rithms in the scenarios of Fig. 6c, f, as the memory size and the length of the videos are the parameters most closely related with the abandonment phenomenon [34].
Under the effect of session abandonment, the average and maximum differences between the hit ratio of CARTE and of CCVC were 8.6 and 11.8 %, respectively. These results represent a decrease of 2.2 and 3.4 %, respectively, in comparison with the scenarios without abandonment.
Fig. 8Abandonment curve of VoD clients. Percentage of cumulative closing of sessions to each moment of video exhibition
The difference obtained between these two systems when default configurations were utilized was 11.8 %. This result represents a decrease of 3.4 % in relation to the difference obtained without abandonment.
This data shows that the CCVC can improve its perfor-mance compared to CARTE by discarding the sequences close to the end of the video8. However, CARTE produces a greater hit ratio because under the occurrence of aban-donment CCVC does not discard sequences that belong to the videos of greater popularity where the session aban-donment also happens. Consequently, when the clients abort a popular video, the sequences at the end of the video, kept in the memory by CCVC, need to wait more time until the next clients (who did not abandon the video) carry out access to them. As shown in Fig. 9a, this effect caused by the early departure of clients over the CCVC performance is even greater when the length of the video increases in relation to the session length of the clients. In contrast, CARTE only keeps the sequences in the memory when there are enough clients within their win-dows to justify their allocation. In this way, the algorithm tends to favor the allocation of sequences closer to the beginning of each video that has greater concentration of previous clients due to the gradual reduction of the num-ber of active clients as they move forward to the end of the video.
In regard to the comparison with CC, the average and maximum differences between the hit ratios were 15 and 20.7 %, respectively. These results represent an increase of 3.6 and 4.7 %, respectively, in comparison with the scenarios without abandonment. The difference obtained between these two systems when default config-urations were utilized was 19.9 %. This result represents an increase of 3.9 % in relation to the difference obtained without abandonment.
This happens because CC tends to prioritize the caching of the final portions of each video which are less accessed due to the early exit of clients. This occurs because the higher concentration of clients at the beginning of the video causes the increase of the caching priorities of the video blocks at the end of the video. So, as the video length increases in relation to the session length of clients, the numbers of blocks with greater caching priority after the exit points of the clients also increases. Consequently, these blocks dominate the spaces in cache resulting in an inefficiency of the CC algorithm.
(a) (b)
Fig. 9 a,bPerformance under session abandonment. Hit ratios for variation of the video length (a) and memory size (b)
way, the accuracy of the algorithm to distinguish the dif-ferent densities along each video tends to increase as the size of the time window becomes smaller. For this rea-son, the use of smaller time windows in the scenarios with abandoning caused CARTE to produce the best results.
The results in Fig. 9b show that, under the occurrence of abandonment, CARTE scales its performance better than the two reference algorithms when the size of the cache increases. This demonstrates that the caching logic of our algorithm is capable of exploring additional memory with greater efficiency by caching the sequences with higher concentrations of previous clients along the videos.
Finally, the service time produced by CARTE in the scenarios with session abandonment showed an average reduction of 7.8 % in relation to the analogues scenar-ios where the early departure of clients did not happen. This reduction came from a smaller number of simultane-ous clients served by the proxy due to the abandonment phenomenon. Similarly, the reduction of the number of clients showed to be a major factor in increasing the aver-age hit ratios produced by CARTE and CCVC by 1.5 and 3.7 %, respectively, when compared to the results obtained to the same scenarios where abandonment did not hap-pen. CC did not follow this growth showing a decrease in its average efficiency by 2.1 %.
Analysis of the relation between the size of the time window and the workload
As suggested in the “Evaluation of the amount of com-putational resources used by each algorithm” subsection, the configuration adopted for the TW parameter of the CARTE is capable to create direct impacts on the hit ratio, as well as on the number of substitutions performed by this algorithm. As previously demonstrated, these two fac-tors create repercussions on the consumption of resources of the underlying architecture. Consequently, the key aspect to reach the maximum efficiency of our algorithm is to identify the best fit for the TW.
For this reason, this subsection presents a study of the correlation between the TW and the workload for
the proxy, aiming to demonstrate how the operating conditions could influence the choice taken by the VoD designer to permit the achievement of the best system response. To this end, we demonstrated the effects pro-duced by the variation of the size of TW, under different scenarios, on the main metric of efficiency for a caching algorithm, the hit ratio. With this, we hope to build guide-lines to perform the adjustment of our algorithm in order to extract its maximum performance for every case.
That said, Fig. 10a presents the existing correlation between IA and TW. The variation on the IA causes a change in the concentration (density) of clients per video. When IA assumes a lower value, the concentration of clients becomes higher and TW needs to be configured with a small value to better define the caching priority for each sequence. On the other hand, in scenarios where clients are more dispersed (high IA), it is necessary to use a larger TW to deal with the memory content more efficiently.
This occurs because when clients are more concen-trated, the use of a large time window tends to encompass not only a great number of clients but also a high quan-tity of sequences within each window, making the same clients account for different sequences simultaneously. Therefore, the sequences closer to the end of the video tend to have more previous clients encompassed in TW space and consequently receive higher caching priorities. In contrast, the sequences close to the beginning of each video receive lower caching priorities, although these sequences might have a greater demand associated to them in the short term. When this occurs, the behavior of the CARTE algorithm tends to be closer to that of the CC algorithm.
3 sec 4 sec 5 sec 6 sec 7 sec 8 sec 9 sec 10 sec 11 sec
12 sec
0 20 40 60 80 100 120 140 160 180 200 220 240 260 280 300 Time Window (seconds)
9 18 27 36 45 54 63 72
Hit ratio (%)
(a)
0.0 0.25 0.5 0.75 1.0
0 20 40 60 80 100 120 140 160 180 200 220 240 260 280 300 Time Window (seconds)
49 56 63 70 77 84 91
Hit ratio (%)
(b)
50 videos 60 videos 70 videos 80 videos 90 videos 100 videos
110 videos 120 videos 130 videos 140 videos 150 videos 0 20 40 60 80 100 120 140 160 180 200 220 240 260 280 300
Time Window (seconds) 51
54 57 60 63 66 69 72
Hit ratio (%)
(c)
200 streams 250 streams 300 streams 350 streams 400 streams 450 streams 500 streams 550 streams 600 streams 650 streams 0 25 50 75 100 125 150 175 200 225 250 275 300
Time Window (seconds) 21
28 35 42 49 56 63 70
Hit ratio (%)
(d)
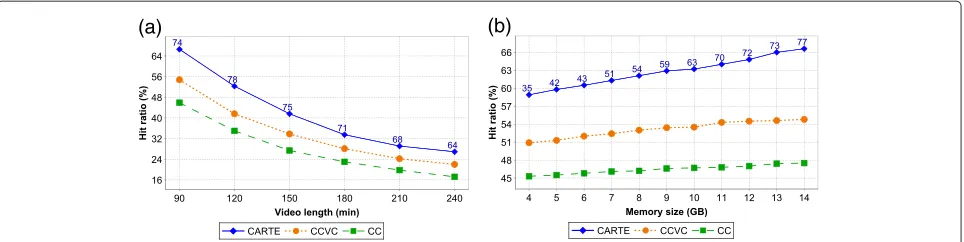
4 GB 5 GB 6 GB 7 GB 8 GB 9 GB 10 GB 11 GB 12 GB 13 GB 14 GB
0 25 50 75 100 125 150 175 200 225 250 275 300 Time Window (seconds)
50 52 54 56 58 60 62 64 66
Hit ratio (%)
(e)
90 min 120 min 150 min 180 min 210 min 240 min 0 20 40 60 80 100 120 140 160 180 200 220 240 260 280 300
Time Window (seconds) 21
28 35 42 49 56 63 70
Hit ratio (%)
(f)
Fig. 10Hit ratio produced by the variation of the size of the time window. In each graphic, TW varies in conjunction with one of the load parameters: IA (a), ZC (b), NV (c), NB (d), MS (e), and VL (f)
and the density of the clients within each time window of the victimized videos become similar, causing the benefit of maintaining one or other sequence in the memory to be almost the same.
Figure 10b shows the influence caused by the variation of the ZC on the choice of the configuration for TW. Considering that the NV and IA were kept constant in this experiment, each increase produced in ZC caused the transfer of a significant volume of clients from less pop-ular videos to the most poppop-ular videos. For this reason, a
few clients remained in the most popular videos, resulting in a smaller number of sequences to discard from these videos.