R E S E A R C H
Open Access
Techniques for comparing and
recommending conferences
Grettel Monteagudo García
1, Bernardo Pereira Nunes
1,2, Giseli Rabello Lopes
3, Marco Antonio Casanova
1*and Luiz André P. Paes Leme
4Abstract
This article defines, implements, and evaluates techniques to automatically compare and recommend conferences. The techniques for comparing conferences use familiar similarity measures and a new measure based on co-authorship communities, called co-authorship network community similarity index. The experiments reported in the article indicate that the technique based on the new measure performs better than the other techniques for comparing conferences, which is therefore the first contribution of the article. Then, the article focuses on three families of techniques for conference recommendation. The first family adopts collaborative filtering based on the conference similarity measures investigated in the first part of the article. The second family includes two techniques based on the idea of finding, for a given author, the strongest related authors in the co-authorship network and recommending the conferences that his co-authors usually publish in. The first member of this family is based on the Weighted Semantic Connectivity Score—WSCS, which is accurate but quite costly to compute for large co-authorship networks. The second member of this family is based on a new score, called the Modified Weighted Semantic Connectivity Score—MWSCS, which is much faster to compute and as accurate as the WSCS. The third family includes the Cluster-WSCS-based and the Cluster-MWSCS-based conference recommendation techniques, which adopt conference clusters generated using a subgraph of the co-authorship network. The experiments indicate as the best performing conference recommendation technique the Cluster-WSCS-based technique. This is the second contribution of the article. Finally, the article includes experiments that use data extracted from the DBLP repository and a web-based application that enables users to interactively analyze and compare a set of conferences.
Keywords:Conference comparison, Conference recommendation, Co-authorship networks, Social network analysis, Recommender systems, Linked data
Introduction
Conferences provide an important channel for the
exchange of information and experiences among
researchers. The academic community organizes a large number of conferences, in the most diverse areas, gener-ating a rich set of bibliographic data. Researchers explore such data to discover topics of interest, find related research groups, and estimate the impact of authors and publications [1–6]. Choosing a good confer-ence or journal in which to publish an article is in fact very important to researchers. The choice is usually
based on the researchers’ knowledge of the publication
venues in their research area or on matching the
conference topics with their paper subject. Indeed, the identification of relevant publication venues presents no problems when the researcher is working in his area. It is less obvious, though, when the researcher moves to a new area.
In this article, we define, implement, and evaluate techniques to automatically compare and recommend conferences that help address the questions of selecting and evaluating the importance of conferences. From a broad perspective, techniques for comparing conferences induce clusters of similar conferences, when applied to a conference catalog. Therefore, when one finds one or more familiar conferences in a cluster, he may consider that the other conferences in the cluster are similar to those he is familiar with. Techniques for recommending conferences, on the other hand, select conferences
* Correspondence:[email protected]
1Pontifical Catholic University of Rio de Janeiro, Rio de Janeiro, RJ, Brazil Full list of author information is available at the end of the article
according to a given criteria and rank them in order of importance. Thus, when one finds a conference closer to the top of the ranked list, he may consider that the given conference is more important than those lower down in the list, within the bounds of the given criteria.
The techniques for comparing conferences adopt familiar similarity measures, such as the Jaccard similar-ity coefficient, the Pearson correlation similarsimilar-ity and the Cosine similarity, and a new similarity measure, called the co-authorship network community similarity index. The experiments reported in the article indicate that the best performing technique for comparing conferences is that based on the new similarity measure, which is therefore the first contribution of the article.
The article proceeds to define three families of confer-ence recommendation techniques. The first family of techniques adopts collaborative filtering based on the conference similarity measures investigated in the first part of the article. The second family includes two tech-niques based on the idea of finding, for a given author, the strongest related authors in the co-authorship network and recommending the conferences that his co-authors usually publish in. The first member of this
family is based on the Weighted Semantic Connectivity
Score—WSCS, an index for measuring the relatedness of actors. However, since this index proved to be accurate but quite costly for large co-authorship networks, the article introduces a second technique based on a new
score, called theModified Weighted Semantic
Connectiv-ity Score—MWSCS, which is much faster to compute
and as accurate as the WSCS. The third family of
conference recommendation techniques includes the Cluster-WSCS-based and the Cluster-MWSCS-based techniques, which adopt conference clusters generated using a subgraph of the co-authorship network, in-stead of the full co-authorship network. The experi-ments suggest that the WSCS-based, MWSCS-based, and Cluster-WSCS-based techniques perform better than the benchmark and better than the techniques based on similarity measures. Furthermore, between these three techniques, the experiments permit us to
conclude that the Cluster-WSCS-based technique
should be preferred because it is more efficient and have no statistically significant differences when com-pared to the WSCS-based and MWSCS-based tech-niques. This is the second contribution of the article.
The experiments mentioned in the previous para-graphs use data extracted from a triplified version of the dblp computer science bibliography (DBLP) repository, which stores Computer Science bibliographic data for more than 4500 conferences and 1500 journals (as of early 2016). The experiments were performed using a web-based application that enables users to interactively analyze and compare a set of conferences.
The remainder of this article is structured as follows.
The “Related work” section summarizes similar work.
The “Techniques” section introduces the conference
comparison and the conference recommendation tech-niques. The“Results and discussion”section presents an
application that implements the techniques and
describes their evaluation. Finally, the “Conclusions” section summarizes the main contributions of this article.
Related work
Henry et al. [1] analyzed a group of the four major con-ferences in the field of human-computer interaction (HCI). The authors discovered many global and local patterns using only article metadata, such as authors, keywords, and year. Blanchard [2] presented a 10-year analysis of the paper production in intelligent tutoring systems (ITS) and Artificial Intelligence in Education (AIED) conferences and showed that Western, Educated, Industrialized, Rich, and Democratic bias observed in psychology may be influencing AIED research. Chen, Zhang, and Vogeley [3] proposed an extension of the contemporary co-citation network analysis to identify co-citation clusters of cited references. Intuitively, the authors synthesize thematic contexts in which these clusters are cited and trace how the research focus evolved over time. Gasparini, Kimura, and Pimenta [4] presented a visual exploration of the field of human-computer interaction in Brazil from a 15-year analysis of paper production in the Brazilian Symposium on Human Factors in Computing Systems (IHC). Recently, Barbosa et al. [5] published an analysis of the same conference series. Chen, Song, and Zhu [6] opened a wide range of opportunities for research agendas and trends in Entity Relationship conferences.
Zervas et al. [7] applied social network analysis (SNA) metrics to analyze the co-authorship network of the Educational Technology & Society (ETS) Journal. Procó-pio, Laender, and Moro [8] did a similar analysis for the databases field. Cheong and Corbitt [9, 10] analyzed the Pacific Asia Conference on Information Systems and the Australasian Conference on Information Systems.
Recently, Lopes et al. [11, 12] carried out an extensive analysis of the WEBIST conferences, involving authors, publications, conference impact, topics coverage, com-munity analysis, and other aspects. The analysis starts with simple statistics, such as the number of papers per conference edition and then moves on to analyze the co-authorship network, estimating the number of commu-nities, for example. The paper also includes an analysis of author indices, such as the h-index, topics and confer-ence areas, and paper citations.
All the above references focus on metrics typical of social network analysis mostly to compare differ-ent instances of the same publication venue and do not cover recommendation issues. Contrasting with the above references, in this article, we propose, im-plement, and evaluate several techniques to compare conferences in general and not a specific conference series. The current implementation works with the triplified version of the DBLP repository, which
covers the vast majority of Computer Science
conferences.
We now turn to conference recommendation, a prob-lem that attracted attention due to the increase in the number of conferences in recent years.
Medvet et al. [14] considered a venue recommendation system based on the idea of matching the topics of a paper, extracted from the title and abstract, with those of possible publication venues for the paper. We adopted a simpler approach to obtain the topics of a conference from the set of keywords and titles of the papers pub-lished in the conference and their frequency, after elim-inating synonymous keywords.
Pham et al. [15] proposed a clustering approach based on user social information to derive venue recommendation based on collaboration filtering and trust-based recommendation. The authors used data from DBLP and Epinion to show that the proposed
clustering technique-based collaboration filtering
performs better than traditional collaboration filter-ing algorithms. In this article, we also explore collaborative filtering and conference clustering to
define families of conference recommendation
techniques.
Chen et al. [16] proposed a method for recommending academic venues based on the PageRank metric. However, unlike the original PageRank method, which induces a relationship network model of these venues, the authors proposed a method that considers the effects of authors’preference for each venue. Thus, the PageR-ank metric is computed on a mixed network where nodes are academic venues and authors and edges are the co-authoring and publishing relationships (author-vehicle). The score of the nodes is then defined as the combination of the effects of co-authoring and publica-tion. The propagation of punctuation across the network also suffers a variation from the original PageRank. Each adjacent node propagates its effects proportionally to the similarity with its neighbor. If two authors are similar, the score is more intensely propagated, that is, authors with similar interests influence the score of a venue more strongly.
Boukhris et al. [17] proposed a recommendation
technique for academic venues for a particular target
researcher, TR. The technique prioritizes the venues
most used by the researchers that cite a TR. The citation intensities are adjusted with factors that intend to meas-ure the interest of a researcher by the work of TR so that the venues of the researchers most strongly in-terested in the work of TR will have greater rele-vance. To solve the problem of target researchers with few citations, the recommendation process uses co-authors and colleagues from the same institution as TR. A final step in the recommendation process allows filtering the ranking results according to re-quirements reported by users.
Yang and Davison [18] proposed an interesting ap-proach for venue recommendation based on stylometric features. They argue that the writing style and paper for-mat may serve as features for collaborative filtering-based methods. Their results show that the combination of content features with stylometric features (lexical, structural, and syntactical) performs better than when stylometric or content-based features are applied separ-ately. Although the accuracy reported is rather low, linguistic style and paper format remain as interesting features to consider.
Huynh and Hoang [19] proposed a simple network model based on social network structure that may serve to represent connections that goes beyond
classical “who knows whom” connections. Thus, for
instance, in their network model, the relationships between researchers can be based on co-authorship measures and authors similarity. Their work can benefit from ours by borrowing the metrics proposed here.
Asabere et al. [20] and Hornick et al. [21] addressed the problem of recommending conference sessions to attendees. Similar to the venue recommendation prob-lem, recommendation techniques such as content and
collaborative-based methods are used to match
attendees and session presentations. The use of geoloca-tion informageoloca-tion [20] and personal informageoloca-tion provided at conferences [21] as features may also be incorporated to improve venue recommendation. For instance, confer-ence and researcher locations can be used as features when budget restrictions apply.
Luong et al. [22] proposed and compared three rec-ommendation methods for conferences. The methods find the most appropriate conference for a set of co-authors who want to publish a paper together. The best performing recommendation method, which we
will refer simply as the most frequent conference, is
coauthor CONFi ¼
XN
m¼1
coauthors wi;m ð1Þ
whereN is the set of co-authors who want to publish a paper together, i is a conference that might be recom-mended for the setNof co-authors, and coauthors_wi,m is the weight of conferenceifor a co-authorm∈Nin the co-authorship network. This last function is defined as:
coauthorswi;m ¼
XCoA
k¼1
nfreq CONFi;m
þnfreq CONFi;kÞ wCoAk;m ð2Þ
where CoA is the set of co-authors of author m who have published at conference i,w_CoAk,m is the number of times authorm co-authored papers with another au-thor k in the co-authorship network, nfreq_CONFi,m is the probability of author m publishing in conference i, and likewise nfreq_CONFi,kis the probability of authork publishing in conference i. In this article, we adopted Luong’s most frequent conference technique as the benchmark and, therefore, included a somewhat more detailed account of their work.
In this article, we propose two conference recommen-dation techniques based on a social network analysis of the co-authorship network, but we adopt a measure of the strength of the connections between the authors in the network which is computed differently from the pre-vious methods. We first propose to estimate the related-ness of actors in a social network by using a semantic connectivity score [23], denoted SCS, which is in turn based on the Katz index [24]. This score takes into ac-count the number of paths between two nodes of the network and the accumulated weights of these paths. Then, we propose a second score that approximates the SCS score and uses the shortest path between two nodes. In addition to these two strategies, we also propose to construct a utility matrix and to implement recommendation techniques based on collaborative filtering using the utility matrix.
Techniques
In this section, we introduce the conference comparison and the conference recommendation techniques, which are the main trust of the article. We refer the reader to [25] for illustrative examples of the techniques.
Conference comparison techniques
As mentioned in the Introduction section, the tech-niques for comparing conferences induce clusters of similar conferences, when applied to a conference cata-log. They adopt familiar similarity measures, such as the Jaccard similarity coefficient, the Pearson correlation
similarity and the Cosine similarity, and a new similarity measure, called the co-authorship network community similarity index.
In what follows, we use the following notation:
Cis a set of conferences
Ais a set of authors
Pis a set of papers
pa :A→2Pis a function that assigns to each authori∈Athe set of papers pa(i)⊆Pthat author
ipublished (in any conference)
pc :C→2Pis a function that assigns to each conferencex∈Cthe set of papers pc(x)⊆Pthat were published inx
pac :A×C→2Pis a function that assigns to each authori∈Aand each conferencex∈Cthe set of papers pac(i,x)⊆Pthat authoripublished in conferencex
Ax and Ay are the set of authors that published
in conferences x and y, that is, Ax= {i∈A /
|pac(i,x)| > 0} and, likewise, Ay= {i∈A / |pac
(i,y)| > 0}
Ax,yis the set of authors that published in both
conferencesxandy, that is,Ax,y= {i∈A/ |pac
(i,x)| > 0∧|pac(i,y)| > 0}
Gx= (Nx,Ex), theco-authorship networkof
conference x, is an undirected and unweighted graph where i∈Nx indicates that author i
published in conference x and {i,j}∈Ex
represents that authors i and j co-authored one or more papers published in conference x
Similarity measures based on author information
In what follows, we adapt familiar similarity measures to conferences and authors and introduce a new measure calledcommunity similarity.
The Jaccard Similarity Coefficient for conferences x andyis defined as
jaccard simðx;yÞ ¼ Ax∩Ay
= Ax∪Ay
ð3Þ
The utility matrix expresses the preferences of an author for a conference to publish his research. More formally, the utility matrix [rx,i] is such that a line x
represents a conference and a column i represents an
author and is defined as:
rx;i¼
pacði;xÞ
j j
pað Þi
j j ð4Þ
Based on the utility matrix [rx,i], we define the
pearson simðx;yÞ ¼
X
i∈Ax;y rx;i−rx
⋅ ry;i−ry
ffiffiffiffiffiffiffiffiffiffiffiffiffiffiffiffiffiffiffiffiffiffiffiffiffiffiffiffiffiffiffiffiffiffiffiffiffiffiffiffiffiffiffiffiffiffiffiffiffiffiffiffiffiffiffiffiffiffiffiffiffiffiffiffiffiffiffiffiffiffiffi X
i∈Ax;y rx;i−rx
2
⋅Xi∈Ax
;y ry;i−ry
2
r
ð5Þ
where rx is the average of the elements of line xof the
utility matrix (and likewise for ry).
Again, based on the utility matrix [rx,i], we define the
Cosine Similarity between conferences x and y as
follows:
cos simðx;yÞ ¼
X
i∈Ax;y rx;i⋅ry;i
ffiffiffiffiffiffiffiffiffiffiffiffiffiffiffiffiffiffiffiffiffiffiffiffiffiffiffiffiffiffiffiffiffiffiffiffiffiffiffiffiffiffiffiffiffiffiffiffiffiffiffiffiffiffiffiffi X
i∈Ax;y rx;i 2
⋅Xi∈A
x;y ry;i 2
r ð6Þ
We introduce a new similarity measure between conferences based on communities defined over the co-authorship network of the conferences. Given the co-authorship network Gx= (Nx,Ex) of conference x,
we define an author community cx of x as the net of
nodes of a connected component of Gx. Let cx and cy
be author communities in the co-authorship networks
of conferences x and y, respectively. We say that cx
and cy are equivalent w.r.t. a similarity measure sim
and a threshold level α iff sim(cx,cy)≥α. For example,
sim may be defined using the Jaccard similarity coeffi-cient between pairs of conferences introduced above.
Let Cx and Cy be the sets of communities of
confer-encesxandy, respectively. LetEQ[sim,α](x,y) be the set of communities in the co-authorship network of
confer-ence x that have an equivalent community in the
co-authorship network of conference y (and symmetrically
EQ[sim,α](y,x)).
The Co-authorship Network Communities Similarity (based on a similarity measuresimand a threshold level
α) between conferencesxandyis then defined as:
csim sim½ ;αðx;yÞ ¼jEQ½sim;αðx;yÞj
min j j;Cx Cy
ð7Þ
Note that |Cx| > 0 and |Cy| > 0 since Gx and Gy must
have at least one node each and therefore at least one connected component each.
Similarity measure based on conference keywords
In the previous subsection, we proposed a utility matrix that expresses the preferences of an author for a confer-ence to publish his research. However, we can also express the association of a topic with a conference. Therefore, in this section, we describe an algorithm to obtain the conference topics and introduce a new utility matrix that represents this information.
To obtain the topics of the conference x, we first
extract, for each paper p∈pc(x), the set of keywords of
the paper, denoted by kwrds(p). Then, we define the
frequencyof a keywordkfor a conferencexas:
f kð ;xÞ ¼ jfp∈pc xð Þ=k∈kwrds pð Þgj ð8Þ
where the functionkwrds(p) tries to eliminate synonym-ous keywords. In our implementation, we used the API of the Big Huge Thesaurus1to retrieve the synonyms of a word, in English.
The extraction of keywords for a paper, that is, the computation ofkwrds(p),is based on a lexical analysis of paper metadata. This process follows five steps:
1. Obtain the text for keyword extraction; in our implementation, we used the title and the keyword list of the paper.
2. Tokenize the extracted text.
3. Eliminate stopwords (i.e., the most common words in a language).
4. Eliminate suffixes to obtain the word lexeme. 5. The resulting token list represents the keywords of
the paper.
We then define the set of keywords of a conference as follows:
ckwrds xð Þ ¼ ∪
p∈pc xð Þkwrds pð Þ ð9Þ
The database vocabulary is the union of all the rele-vant keywordsfor the conferences, that is:
K¼ ∪
x∈C
k∈ckwrds xð Þ=f kð ;xÞ>β
f g ð10Þ
where β is a frequency threshold, whose purpose is to eliminate keywords with low frequency.
From the process of obtaining the keywords of a con-ference, we can establish a new utility matrix that expresses the association of topics (keywords) with con-ferences. More formally, the utility matrix [sx,k] is such
that a line x represents a conference and a column k
represents a keyword and is defined as:
sx;k¼ 0f k;ð xÞ ;;iffotherwisef k;ð xÞ>β
ð11Þ
whereβis the frequency threshold.
The cardinality of the columns of the matrix [sx,k] is
the cardinality of the setK.
The problem of comparing conferences using topics is
addressed by defining the similarity functions jaccard_
We substituteAxandAybyKxandKy, whereKx
andKyare the sets of keywords that are relevant for
conferencesxandy, that is,Kx= {k∈K/sx,k> 0}
andKy= {k∈A/sy,k> 0}.
We substituteAx,ybyKx,y, whereKx,yis the set of
keywords relevant for both conferencesxandy, that is,Kx,y= {k∈K/sx,k> 0∧sy,k> 0}.
Conference recommendation techniques
Conference recommendation techniques based on classical similarity measures
As defined in [26], in a recommender system, there are two classes of entities—usersanditems. Users have pref-erences for certain items, which must be extracted from the data. The data itself is represented as a utility matrix giving, for each user-item pair, a value that represents
what is known about the degree of preference or rating
of that user for that item. An unknown rating implies that there is no explicit information about the user’s preference for the item. The goal of a recommendation system is to predict the unknown ratings in the utility matrix.
In our context, we recall from the “Conference
com-parison techniques” subsection that the utility matrix
[rx,i] is such thatrx,iexpresses the preference (i.e., rating)
of an authorifor a conference xto publish his research. To predict an unknown rating, we compute the similar-ity between conferences and detect their nearest neigh-bors or most similar conferences. With this information,
the rating of conference x for author i is defined as
follows:
CF xð ;iÞ¼
X
y∈Sx ry;i ⋅sim xð ;yÞ X
y∈Sxsim x;ð yÞ
ð12Þ
whereSxis the set of conferences most similar toxand
ry,iis the rating of conferenceyfor authori.
Therefore, we may immediately define a family of con-ference recommendation techniques based on the utility matrix and the classical similarity measures introduced
in the “Conference comparison techniques” subsection
that we callCF-Jaccard,CF-Pearson,CF-Cosine, and CF-Communities, according to the similarity measure adopted. The “Results and discussion” section analyses how they perform in detail.
Conference recommendation techniques based on the weighted authorship network
Recall from the “Conference comparison techniques”
subsection that pa: A→2P is the function that assigns to each author i∈A the set of papers pa(i)⊆P that author ipublished (in any conference). Theweighted
co-authorship network based on pa is the edge-weighted undirected graph G = (N,E,w), where i∈N represents an author, {i,j}∈E indicates thati and j are co-authors, that is, {i,j}∈Eiffpa(i)∩pa(j)≠ ∅, andw({i,j}) assigns a weight to the co-authorship relationship betweeniandj, and is defined as:
w i;ðf gj Þ ¼jpa ið Þ∩pa jð Þj pa ið Þ∪pa jð Þ
j j ð13Þ
Hence, the larger w({i,j}) is, the stronger the
co-authorship relationship will be if authors i and j
co-authored all papers they published, then w({i,j}) = 1; and if they have not co-authored any paper, then the edge {i,j} does not exist.
The second family of conference recommendation tech-niques explores the weighted co-authorship network and adopts two scores: the Weighted Semantic Connectivity
Score—WSCS and the Modified Weighted Semantic
Connectivity Score—MWSCS. Hence, these techniques
are called WSCS-basedandMWSCS-based
recommenda-tion techniques.
The Weighted Semantic Connectivity Score, WSCSe, is
defined by modifying the semantic connectivity score
SCSe [7] to take into account the weight of the paths
between two authors i and j, computed as the sum of
the weights of the edges in the path:
WSCSeð Þ ¼i;j
XT
w¼1
βw⋅
paths<<wi;j>>
ð14Þ
where paths <<wi;j>>is the number of paths of weight equal to w between i and j,T is the maximum weight of the paths, and 0 <β≤1 is a positive damping factor.
The conference recommendation technique based on WSCSeworks as follows. Given an author i, it starts by
computing WSCSe(i,j), the score between i and any
other author j in the weighted co-authorship network.
Then, it sorts authors in decreasing order of WSCSe,
since authors that are more related to authoriwill have a higher WSCSe(i,j) value. For better performance, the
technique considers only the first n authors in the list ordered by WSCSe. Call this setFi. For each author jin
Fi, the technique selects the conference c∈C with the
highest pac(j,c), denoted MaxCj. The rank of conference
xfor authoriis defined as follows:
rankðx;iÞ ¼ X
j∈Fi
g x;ð iÞ⋅WSCSeð Þi;j ð15Þ
whereg xð Þ ¼;j 1;iffx¼MaxCj
0; otherwise
Since computing the WSCSe score can be very slow
shortest paths from author i to other authors using Dijkstra’s algorithm. We then redefine the score as follows:
MWSCSeð Þ ¼i;j βw ð16Þ
wherewis a length of the shortest path from authorito authorj. The recommendation technique remains basic-ally the same, except that it uses the MWSCS score.
The results for the recommendation technique using
the MWSCSescore can be very different from those
ob-tained using the WSCSe score. Indeed, it is easy to see
that, by using the MWSCSescore, we lose the
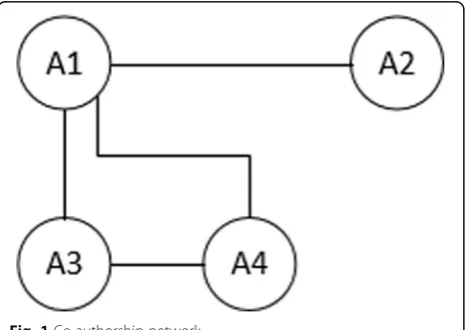
informa-tion about all paths between the authors, except the shortest. For example, in the co-authorship network of Fig. 1, the pairs of authors (A1, A3) and (A1, A2), using
Eq. 16, have the same MWSCSe, whereas the pair
(A1,A3) should have a larger value; indeed, the path (A1, A4, A3) is ignored in the calculation of the MWSCSe
score, using Eq. 16.
Conference recommendation techniques based on conference clusters
In the previous subsection, we presented two algorithms to recommend conferences using the co-authorship net-work. The first algorithm, based on the WSCSescore, is
computationally slower than the second, based on the MWSCSescore. Both algorithms are sensitive to the
net-work size and, therefore, slower for large netnet-works. In this section, we propose an algorithm to recommend conference that reduces the problem of recommending conferences using the co-authorship network to the problem of recommending conferences using a subgraph of the co-authorship network.
We may immediately define a third family of confer-ence recommendation techniques that contains two techniques, called WSCS-based and Cluster-MWSCS-based, if we use the WSCS and the MWSCS scores respectively to recommend conferences using a
subgraph of the co-authorship network, instead of the full co-authorship network.
Let u⊆C be a conference cluster. The co-authorship
network for u is the subgraph Gu = (Nu,Eu,w) of the
weighted co-authorship networkG= (N,E,w) such that:
Nu¼fi∈N=∃c cð ∈uandjpac ið Þ;cj>0Þg
Eu¼ff gi;j ∈E=∃c cð ∈uandðpc cð Þ∩pa ið Þ∩pa jð ÞÞ≠∅Þg
This family of recommendation techniques uses the following pre-processing algorithm:
1. Obtain the setUof conferences clusters using a similarity functions.
2. For each clusteru∈U, create the co-authorship network of the cluster.
3. For each clusteru∈U, obtain a vectorVu
representing clusteru.
4. For each authori∈A, obtain a vectorVi
representing authori.
To define the algorithm, we need a function clus-ter_score(i,u) :A×U→ ℕ that assigns to each author
i∈A and each cluster u∈U a relationship score based
on the similarity between vectors Vi and Vu.
Then, the general algorithm to recommend a confer-ence to an authoriis defined as:
1. Selectuisuch thatui¼ maxu∈Uðclusterscoreði;uÞÞ
2. Apply a conference recommendation algorithm (any of those proposed in the “Conference recommendation techniques based on classical similarity measures” subsection) using the co-authorship network of cluster ui.
Steps 3 and 4 of the general algorithm and the defin-ition of cluster_scoredepend on the choice of the
simi-larity function s used in step 1 of the pre-processing
algorithm. If we use one of the similarity functions intro-duced in the“Similarity measures based on author infor-mation” subsection, steps 3 and 4 and the cluster score are defined as:
Step 3 computes, for each clusteru∈U, the vector
Vurepresenting clusterusuch that
Vu½ ¼c 10 ; otherwise;iffc∈u
Step 4 computes, for each authori∈A, the vector
Virepresenting author defined exactly as the
column corresponding to authoriin the utility matrix [rx,i] introduced in the“Similarity measures
based on author information”subsection.
cluster_scoreis the similarity functionsselected in step 1 of the pre-processing algorithm.
However, if we use one of the similarity functions introduced in the“Similarity measure based on conference keywords”subsection, steps 3 and 4 and the cluster score are defined as:
Step 3 computes for each clusteru∈U, the vector
Vurepresenting clusterusuch that
Vu½ ¼k 1 ;iffk∈ ∪c∈u Kc
0 ; otherwise
Step 4 computes the keywords of the papers belonging to the author. The process is described in the
“Similarity measure based on conference keywords”
subsection for the case of the conference keywords.
cluster_scoreis the Jaccard similarity function
between vectorsVuandVa.
Results and discussion
Experimental environment
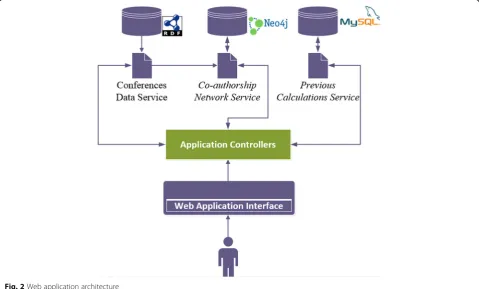
Figure 2 summarizes the architecture of the application
developed to run the experiments. TheConferences Data
Servicehandles queries to the triple store with conference
data. The Co-authorship Network Service receives data
from theConferences Data Serviceand handles queries to theNeo4jdatabase. When an analysis is executed, the sys-tem stores the results for future reuse; thePrevious Calcu-lation Service manages these functions. All experiments
that follow were executed in an Intel Core Quad 3.00GHz, with 6 GB RAM, running Windows 7.
Experiments with the conference similarity techniques
We evaluated the conference similarity techniques assum-ing that the most similar conferences should fall in the same category. We selected as benchmark the List of
Com-puter Science Conferences defined in Wikipedia,2 which
contains 248 academic computer science conferences, clas-sified in 13 categories. That is, the categories define a parti-tionPof the set of conferences. Then, we applied the same clustering algorithm to this set of conferences but using each of the conference similarity measures. Finally, we compared the clusters thus obtained withP. The best con-ference similarity measure would therefore be that which results in conference clusters that best matchP.
We adopted the hierarchical agglomerative clustering algorithm, which starts with each conference as a single-ton cluster and then successively merges (or agglomer-ates) pairs of clusters, using similarity measures, until achieving the desired number of clusters. To determine how similar clusters are, and agglomerate them, a link-age criterion was used. The smallest value of these links that remains at each step causes the fusion of the two clusters whose elements are involved.
Let d(a,b) denote the distance between two elements
a and b. Familiar linkage criteria between two sets of
elementsAandBare:
Complete-linkage: the distanceD(A,B) between two clustersAandBequals the distance between the two elements (one in each cluster) that are farthest away from each other:
D Að ;BÞ ¼ maxfd að ;bÞ=a∈A; b∈Bg ð17Þ
Single-linkage clustering: the distanceD(A,B) between two clustersAandBequals the distance between the two elements (one in each cluster) that are closest to each other:
D Að ;BÞ ¼ minfd að ;bÞ=a∈A; b∈Bg ð18Þ
Average linkage clustering: the distance D(A,B) between two clusters A and Bis taken as the average of the distances between all pairs of objects:
D A;ð BÞ ¼
X
a∈A
X
b∈Bd a;ð bÞ A
j j⋅j jB ð19Þ
Before explaining the measures used to compare how well different data clustering algorithms perform on a set of data, we need the following definitions. Given a
set of n elements S and two partitions X and Y of S,
where X is the correct partition andY is the computed
partition, we define:
TP(true positive) is the number of pairs of elements inSthat are in the same set inXand in the same set inY
TN(true negative) is the number of pairs of elements inSthat are in different sets inXand in different sets inY
FN(false negative) is the number of pairs of elements inSthat are in the same set inXand in different sets inY
FP(false positive) is the number of pairs of elements in
Sthat are in different sets inXand in the same set inY
The measures to evaluate the performance of the cluster-ing algorithms uscluster-ing the proposed similarity functions are:
Rand Index: measures the percentage of correct
decisions made by the algorithm:
RI¼ T PþT N
T PþT NþFPþFN ð20Þ
F-measure: balances the contribution of false
negatives by weighting the recall through a parameterβ> 0:
F¼ β
2þ1
P:R
β2
P
þR ð21Þ
whereP¼ T P
T PþFPandR¼T PT PþFN
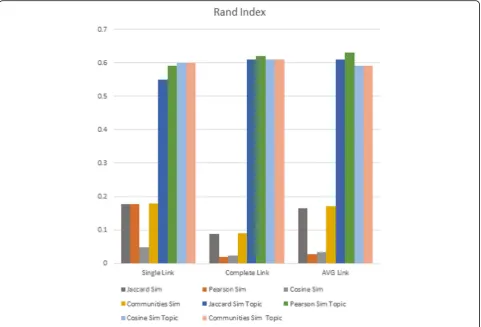
Figure 3 shows the Rand Index obtained by execut-ing the hierarchical agglomerative clusterexecut-ing algorithm with different linkages criteria, using the Jaccard, Pearson, Cosine, and Communities similarity mea-sures based on author information and conferences keywords. Note that, in general, the algorithm based on the communities similarity had the best perform-ance, followed by the Jaccard similarity for similarity measures based on author information. In this case, the Cosine similarity had the worst behavior. The similarity measures based on conference keywords are the best, among which the Pearson and Cosine simi-larity achieved the best results.
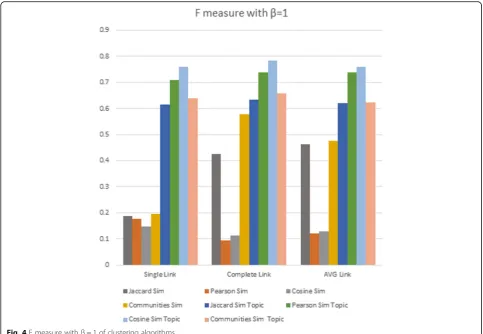
Figure 4 shows the F-measure obtained by executing the same algorithms. By analyzing Fig. 4, we observe that the best performances, for the group of similarity based on author information, were also obtained using the communities similarity and the Jaccard similarity mea-sures; the worst performance was obtained using the Pearson similarity measure and the algorithm using the Cosine similarity measure achieved the worst perform-ance only with the single-link linkage criterion. Again, all similarity measures based on conference keywords had better results than the group based on author infor-mation, among which the Cosine similarity stands out.
Therefore, these experiments suggest that the best per-forming algorithm is that which adopts the communities similarity measure.
Experiments with the conference recommendation techniques
Recall that we proposed three families of recommendation techniques. One family is based on similarity measure defined in the“Similarity measures based on author
infor-mation” subsection. These techniques are called
Cluster-WSCS-based and Cluster-MWSCS-Cluster-WSCS-based, we selected as clustering technique the agglomerative algorithm with complete link and cos_sim_tpc(x,y) by its stability in the results.
We evaluated the conference recommendation tech-niques using the same dataset as in the previous
subsec-tion, with the 248 academic computer science
conferences, and selected 243 random authors to predict their conferences ranking, for that we deleted all publi-cations of the author on the conferences that we want to
rank. We adopted Luong’s most frequent conference
technique as the benchmark (see the “Related work”
section).
Also recall that the mean average precision
mea-sures how good a recommendation ranking function
is. Intuitively, let a be an author and Ca be a ranked
list of conferences recommended for a. Let Sa be a
gold standard for a, that is, the set of conferences
considered to be the best ones to recommend for a.
Then, we have:
Prec@k(Ca), theprecision at position kofCa, is the
number of conferences inSathat occur inCauntil
positionk, divided byk
AveP(Ca), theaverage precision ofCa,is defined
as the sum ofPrec@k(Ca) for each positionkin
the rankingCain which a relevant conference for aoccurs, divided by the cardinality ofSa:
AvePð Þ ¼Ca
X
kPrec@kð ÞCa
Sa
j j ð22Þ
MAP, theMean Average Precisionof a rank score function over all the authors used in these experiments (represented by setA) is then defined as follows:
MAP¼average AvePf ð Þ=aCa ∈Ag ð23Þ
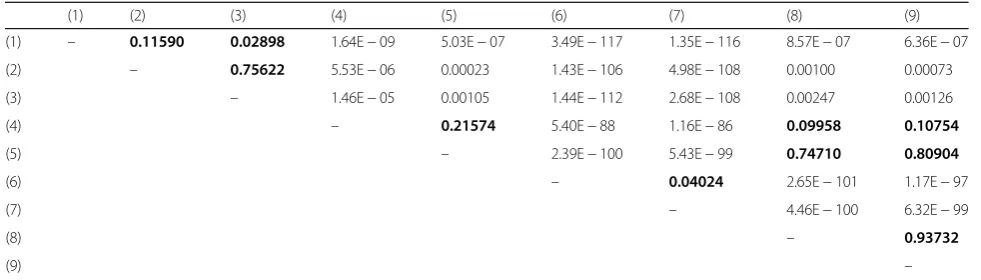
Moreover, in order to evaluate whether the differences between the results are statistically significant, a paired statistical Student’s t test [27, 28] was performed.
Ac-cording to Hull [29], the t test performs well even for
distributions which are not perfectly normal. A p value
is the probability that the results from the compared
data occurred by chance; thus, low p values are good.
We adopted the usual threshold ofα= 0.01 for statistical significance, i.e., less than 1% that the experimental
results happened by chance. When a paired t test
obtained a p value less than α, there is a significant
difference between the compared techniques.
Consider first the two conference recommendation techniques based on the co-authorship network, the WSCS-based and MWSCS-based recommendation tech-niques. To compare them, we performed experiments that measured their runtime, accuracy, and average pre-cision of the top 10 conferences of an author (thus, in this situation, the maximum |Sa| value used in the AveP
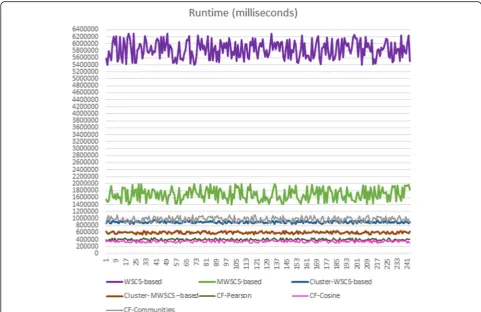
calculation is 10). Figure 5 shows the runtime results of the algorithms that implement these recommendation techniques. Note that the WSCS-based algorithm is by far the slowest, followed by the MWSCS-based. The remaining algorithms had similar runtimes.
Table 1 shows the accuracy and MAPof the 8
confer-ence recommendation techniques we proposed, plus the benchmark. Two of the proposed techniques (first two rows of Table 1) have very similar accuracy. In fact, of the 243 authors that we tested, the balance of the cor-rect predictions was 201 against 197. To better evaluate
the results, we applied a paired t test to investigate
whether there are statistically significant differences
between the MAP results of these conference
recommendation techniques. Table 2 shows thepvalues
obtained by all ttests performed, where the boldface re-sults represent differences which are not statistically significant.
Based on these results, the three techniques with the
best results—WSCS-based, MWSCS-based, and
Cluster-WSCS-based—do not have differences which are statisti-cally significant, based on their MAPresults. The results also indicate that these three techniques have betterMAP results than the benchmark (with statistically significant differences). The CF-Jaccard, CF-Communities, and the Cluster-MWSCS-based techniques have results very close to the benchmark (without statistically significant differ-ences when compared to the benchmark) but less than the three techniques with the best results—WSCS-based, the MWSCS-based, and Cluster-WSCS-based (with differ-ences statistically significant when compared to these three). The CF-Pearson and CF-Cosine techniques have poor accuracy (with statistically significant differences when compared to all other techniques).
Thus, between the three techniques with the best
results—WSCS-based, MWSCS-based, and
Cluster-WSCS-based—we may conclude that the
Cluster-WSCS-based technique should be preferred because it is
more efficient and maintains aMAPwith no statistically significant differences when compared to the WSCS-based and MWSCS-WSCS-based techniques.
Conclusions
In this article, we presented techniques to compare and recommend conferences. The techniques to compare conferences are based on some classical similarity mea-sures and on a new similarity measure based on the co-authorship network communities of two conferences.
The experiments suggest that the best performance is obtained using the new similarity measure.
We introduced three families of conference recom-mendation techniques, following the collaborative filter-ing strategy, and based on (1) the similarity measures proposed to compare conferences; (2) the relatedness of two authors in the co-authorship network, using the Weighted and the Modified Weighted Semantic Con-nectivity Scores; (3) conference clusters, using a sub-graph of the co-authorship network, instead of the full co-authorship network. The experiments suggest that the WSCS-based, MWSCS-based, and Cluster-WSCS-based techniques perform better than the benchmark and better than the techniques based on similarity mea-sures. Furthermore, between these three techniques, the Cluster-WSCS-based technique should be preferred
because it is more efficient and maintains a MAP with
no statistically significant differences when compared to the WSCS-based and MWSCS-based techniques.
These conclusions should be accepted under the limi-tations of the experiments, though, which we recall adopted a set of 248 academic computer science confer-ences as golden standard and used a random sample of 243 authors. Further experiments ought to be performed with other sets of conferences and authors, perhaps
Fig. 5Runtime (milliseconds) of the recommendation algorithms for the different 243 authors
Table 1Comparison of the accuracy and MAP of the recommendation techniques
Technique Accuracy (%) MAP (%)
(1) WSCS-based 82.72 80.93
(2) MWSCS-based 81.07 80.01
(3) Cluster-WSCS-based 80.66 79.83
(4) Cluster-MWSCS-based 77.78 76.82
(5) CF-Jaccard 78.19 77.73
(6) CF-Pearson 55.56 50.21
(7) CF-Cosine 56.79 51.89
(8) CF-Communities 79.02 77.93
obtained from sources different from DPLP. However, the question of defining a golden standard remains an issue.
In another direction, some of the techniques de-scribed in the paper might be applied to other do-mains that contain essentially three types of objects, analogous to “conferences,” “papers,” and “authors” and two relationships, similar to “authored” and “
pub-lished in.” One such domain would be that of “art
museums,” “artworks,” and “artists”, with the relation-ships “created” and “exhibit in”. However, note that
the notion of “co-authorship” would have no relevant
parallel in the art domain. Again, the question of finding an appropriate data source and defining a golden standard would be an issue, which could be addressed as in [30].
A preliminary version of these results, except the
tech-niques described in the “Similarity measure based on
conference keywords”and“Conference recommendation
techniques based on conference clusters” subsections,
and the t test described in the “Experiments with the
conference recommendation techniques” subsection,
were presented in [31].
As for future work, we plan to experiment with a similarity measure based on conference keywords ex-panded to include semantic relationships between the keyword, other than just synonymy. Also, we plan to explore other strategies for recommending confer-ences, such as the complexity level, writing style, etc. Finally, we plan to expand the experiments to other publications datasets and other application domains, as already mentioned, and to make the tool and the test datasets openly available.
Endnotes
1
https://words.bighugelabs.com/
2
https://en.wikipedia.org/wiki/List_of_computer_ science_conferences
Abbreviations
DBLP:dblp computer science bibliography; MSWCS: Modified Weighted Semantic Connectivity Score; SCS: Semantic Connectivity Score; SNA: Social network analysis; WSCS: Weighted Semantic Connectivity Score
Acknowledgements
This work was partly funded by CNPq under grants 444976/2014-0, 303332/ 2013-1, 442338/2014-7, and 248743/2013-9 and by FAPERJ under grant E-26/ 201.337/2014.
Authors’contributions
GMG defined the new similarity measures based on the co-authorship network, and implemented and evaluated all techniques, under the supervision of MAC, BPN, GRL, and LAPPL. All authors read and approved the final manuscript.
Competing interests
The authors declare that they have no competing interests.
Author details
1
Pontifical Catholic University of Rio de Janeiro, Rio de Janeiro, RJ, Brazil. 2Federal University of the State of Rio de Janeiro, Rio de Janeiro, RJ, Brazil. 3Federal University of Rio de Janeiro, Rio de Janeiro, RJ, Brazil.4Federal Fluminense University, Niterói, RJ, Brazil.
Received: 7 November 2016 Accepted: 15 February 2017
References
1. Henry N, Goodell H, Elmqvist N, Fekete J-D (2007) 20 Years of four HCI conferences: a visual exploration. Int’l J of Human-Comp Inter 23(3): 239–285
2. Blanchard EG (2012) On the WEIRD nature of ITS/AIED conferences. In: Proceedings of the 11th Int’l. Conf. on Intelligent Tutoring Systems, Chania, Greece, 14-18 June 2012., pp 280–285
3. Chen C, Zhang J, Vogeley MS (2009) Visual analysis of scientific discoveries and knowledge diffusion. In: Proceedings of the 12th Int’l. Conf. on Scientometrics and Informetrics—ISSI 2009, Rio de Janeiro, Brazil, 14-17 July 2009
4. Gasparini I, Kimura MH, Pimenta MS (2013) Visualizando 15 Anos de IHC. In: Proceedings of the 12th Brazilian Symposium on Human Factors in Computing Systems, Manaus, Brazil, 08-11 October 2013., pp 238–247 5. Barbosa SDJ, Silveira MS, Gasparini I (2016) What publications metadata tell
Us about the evolution of a scientific community: the case of the Brazilian human-computer interaction conference series. Scientometrics, First Online 6. Chen C, Song I-Y, Zhu W (2007) Trends in conceptual modeling: citation
analysis of the ER conference papers (1979-2005). In: Proceedings of the 11th Int’l. Conf. of the International Society for Scientometrics and Informatrics, Madrid, Spain, 25-27 June 2007., pp 189–200
Table 2pvalues of the Student’sttest for MAP results of the recommendation techniques
(1) (2) (3) (4) (5) (6) (7) (8) (9)
(1) – 0.11590 0.02898 1.64E−09 5.03E−07 3.49E−117 1.35E−116 8.57E−07 6.36E−07
(2) – 0.75622 5.53E−06 0.00023 1.43E−106 4.98E−108 0.00100 0.00073
(3) – 1.46E−05 0.00105 1.44E−112 2.68E−108 0.00247 0.00126
(4) – 0.21574 5.40E−88 1.16E−86 0.09958 0.10754
(5) – 2.39E−100 5.43E−99 0.74710 0.80904
(6) – 0.04024 2.65E−101 1.17E−97
(7) – 4.46E−100 6.32E−99
(8) – 0.93732
(9) –
The boldface results represent differences which are not statistically significant
Legend:(1)WSCS-based,(2)MWSCS-based,(3)Cluster-WSCS-based,(4)Cluster-MWSCS-based,(5)CF-Jaccard,(6)CF-Pearson,(7)CF-Cosine,(8)CF-Communities,
7. Zervas P, Tsitmidelli A, Sampson DG, Chen N-S, Kinshuk (2014) Studying Research collaboration patterns via Co-authorship analysis in the field of TeL: the case of educational technology & society journal. J Educ Techno Soc 17(4):1–16
8. Procópio PS, Laender AHF, Moro MM (2011) Análise da Rede de Coautoria do Simpósio Brasileiro de Bancos de Dados. In: Proceedings of the 26th Brazilian Symposium on Databases, Florianópolis, Brazil, 3-6 Oct. 2011 9. Cheong F, Corbitt BJ (2009) A social network analysis of the Co-authorship
network of the Australasian conference of information systems from 1990 to 2006. In: Proceedings of the 17th European Conf. on Info. Systems, Verona, Italy, 8-10 June 2009
10. Cheong F, Corbitt BJ (2009) A social network analysis of the Co-authorship network of the pacific Asia conference on information systems from 1993 to 2008. In: Proceedings of the Pacific Asia Conference on Information Systems 2009, Hyderabad, India, 10-12 July 2009, Paper 23
11. Lopes GR, Nunes BP, Leme LAPP, Nurmikko-Fuller T, Casanova MA (2015) Knowing the past to plan for the future—an in-depth analysis of the first 10 editions of the WEBIST conference. In: Proceedings of the 11th Int’l. Conf. on Web Information Systems and Technologies, Lisbon, Portugal, 20-22 May 2015., pp 431–442
12. Lopes GR, Nunes BP, Leme LAPP, Nurmikko-Fuller T, Casanova MA (2016) A comprehensive analysis of the first ten editions of the WEBIST conference. Lect. Notes in Business Information Processing 246:252–274
13. Batista MGR, Lóscio BF (2013) OpenSBBD: Usando Linked Data para Publicação de Dados Abertos sobre o SBBD. In: Proceedings of the 28th Brazilian Symposium on Databases, Recife, Brazil, 30 Sept. - 03 Oct. 2013 14. Medvet E, Bartoli A, Piccinin G (2014) Publication venue recommendation
based on paper abstract. In: Proceedings of the IEEE 26th International Conference on Tools with Artificial Intelligence, 10-12 Nov. 2014 15. Pham MC, Cao Y, Klamma R, Jarke M (2011) A clustering approach for
collaborative filtering recommendation using social network analysis. J Univers Comput Sci 17(4):583–604
16. Chen Z, Xia F, Jiang H, Liu H, Zhang J (2015) AVER: random walk based academic venue recommendation. In: Companion Proceedings of the 24th International Conference on World Wide Web., pp 579–584 17. Boukhris I, Ayachi R (2014) A novel personalized academic venue hybrid
recommender. In: Proceedings of the IEEE 15th International Symposium on Computational Intelligence and Informatics, 19-21 Nov. 2014 18. Yang Z, Davison BD (2012) Venue recommendation: submitting your paper
with style. In: Proceedings of the 11th International Conference on Machine Learning and Applications, 12-15 Dec. 2012., pp 12–15
19. Huynh T, Hoang K (2012) Modeling Collaborative knowledge of publishing activities for research recommendation. Computational collective intelligence. Technologies and applications. Volume 7653 of the series LNCS., pp 41–50
20. Asabere NY, Xia F, Wang W, Rodrigues JC, Basso F, Ma J (2014) Improving smart conference participation through socially aware recommendation. IEEE Trans Hum Mach Syst 44(5):689–700
21. Hornick M, Tamayo P (2012) Extending recommender systems for disjoint user/item sets: the conference recommendation problem. IEEE T Knowl Data En 24(8):1478–1490
22. Luong H, Huynh T, Gauch S, Do L, Hoang K (2012) Publication venue recommendation using author Network’s publication history. In: Proceedings of the 4th Asian Conf. on Intelligent Information and Database Systems - ACIIDS 2012, Kaohsiung, Taiwan, 19-21 March 2012., pp 426–435
23. Nunes BP, Kawase R, Fetahu B, Dietze S, Casanova MA, Maynard D (2013) Interlinking documents based on semantic graphs. Procedia Comput Sci 22: 231–240
24. Katz L (1953) A New Status index derived from sociometric analysis. Psychometrika 18(1):39–43
25. García GM (2016) Analyzing, comparing and recommending conferences. M. Sc. Dissertation. Department of Informatics, PUC-Rio, Rio de Janeiro, https:// doi.org/10.17771/PUCRio.acad.27295
26. Leskovec J, Rajaraman A, Ullman JD (2014) Mining of Massive Datasets. Cambridge University Press, Cambridge
27. Baeza-Yates RA, Ribeiro-Neto BA (2011) Modern information retrieval—the concepts and technology behind search, 2nd edn. Pearson Education Ltd., Harlow, England
28. Manning CD, Raghavan P, Schütze H (2008) Introduction to Information Retrieval. Cambridge University Press, New York
29. Hull D (1993) Using statistical testing in the evaluation of retrieval experiments. In: Proceedings of the 16th Annual International ACM SIGIR Conference on Research and Development in Information Retrieval, SIGIR’93. NY, USA, ACM, New York, pp 329–338
30. Ruback L, Casanova MA, Renso C, Lucchese C (2017) SELEcTor: discovering similar entities on LinkEd DaTa by ranking their features. In: Proceedings of the 11th IEEE International Conference on Semantic Computing, San Diego, USA, 30 Jan. - 2 Feb. 2, 2017
31. García GM, Nunes BP, Lopes GR, Casanova MA (2016) Comparing and recommending conferences. In: Proceedings of the 5th BraSNAM—Brazilian Workshop on Social Network Analysis and Mining, Porto Alegre, Brazil, 05 July 2016
Submit your manuscript to a
journal and benefi t from:
7Convenient online submission 7Rigorous peer review
7Immediate publication on acceptance 7Open access: articles freely available online 7High visibility within the fi eld
7Retaining the copyright to your article