R E S E A R C H A R T I C L E
Open Access
Evaluation of anatomical pelvic parameters
between normal, healthy men and women
using three-dimensional computed
tomography: a cross-sectional study of
sex-specific and age-specific differences
Norio Imai
1,2*, Hayato Suzuki
2, Asami Nozaki
2, Dai Miyasaka
2, Kazuki Tsuchiya
3, Tomoyuki Ito
4, Izumi Minato
5and
Naoto Endo
2Abstract
Background:Sagittal spinal balance and standing posture are affected by pelvic morphology, especially pelvic incidence (PI). However, it is not difficult to identify the hip center because of overlap of the pelvis, image contrast, and soft tissue artifacts. Measurements of PI are not always suitable in all patients, especially those with
osteoarthritis of the hip joint whose femoral head is nonspherical, subluxed, or dislocated. We measured PI, pelvic tilt (PT), and sacral slope (SS) as anatomical parameters using a novel three-dimensional measurement in order to compare the pelvic morphology between normal, healthy men and women.
Methods:In this cross-sectional study, we evaluated 108 Japanese subjects (55 men, 53 women) without low back
or knee pain. We used the three-dimensional pelvis model adjusted to the anterior pelvic plane and measured the pelvic parameters. The subjects were stratified by age (< 50 versus≥50 years) and sex. Intraobserver and
interobserver reliabilities were calculated with intraclass correlation coefficients.
Results:There was no significant difference in PI, anatomical-PT, and anatomical-SS between sexes. There was a strong correlation between PI and anatomical-SS in men and women (R= 0.790 and 0.715, respectively). Values of anatomical-PT were lower, and values of anatomical-SS were greater among older subjects than among younger subjects; the value of PI was similar between younger and older subjects. Intraobserver and interobserver mean absolute differences were about 2 mm and 2°, respectively; the intraclass correlation coefficient was > 0.87.
(Continued on next page)
© The Author(s). 2019Open AccessThis article is distributed under the terms of the Creative Commons Attribution 4.0 International License (http://creativecommons.org/licenses/by/4.0/), which permits unrestricted use, distribution, and reproduction in any medium, provided you give appropriate credit to the original author(s) and the source, provide a link to the Creative Commons license, and indicate if changes were made. The Creative Commons Public Domain Dedication waiver (http://creativecommons.org/publicdomain/zero/1.0/) applies to the data made available in this article, unless otherwise stated.
* Correspondence:[email protected];
1Division of Comprehensive Geriatrics in Community, Niigata University
Graduate School of Medical and Dental Sciences, 1-757, Asahimachi-do-ri, Chuou ku, Niigata City, Niigata Prefecture 951-8167, Japan
2Division of Orthopedic Surgery, Department of Regenerative and Transplant
Medicine, Niigata University Graduate School of Medical and Dental Sciences, Niigata, Japan
(Continued from previous page)
Conclusions:We found a strong correlation between PI and anatomical-SS in men and women. This novel
measurement concept may be useful to estimate PI from anatomical-SS because the measurements of PI are not always suitable in all patients, especially those with osteoarthritis of the hip joint whose femoral head is not spherical or whose femoral head is subluxed or dislocated. This is the first report to describe the relationship between PI, anatomical-PT, and anatomical-SS as morphologic parameters with a high interclass correlation coefficient for intraobserver and interobserver reliabilities.
Keywords:Pelvic incidence, Pelvic tilt, Sacral slope, Three-dimensional measurement, Measurement error, Pelvic morphological parameters, Sagittal spinal balance, Sagittal alignment, 3D bone model, Anatomical parameters
Background
Sagittal spinal balance and standing posture are affected by pelvic morphology, especially pelvic incidence (PI) [1,2]. Ab-normal sagittal alignment of the spine may lead to difficulty in maintaining proper balance, i.e.,“hip-spine syndrome”[3]. Sacral slope (SS) and pelvic tilt (PT) [1, 2] are commonly used pelvic parameters; they are considered positional pa-rameters because they are affected by the position of the sub-ject when they are examined with two-dimensional (2D) radiographic images. Conversely, PI is considered an anatom-ical parameter because it does not vary regardless of the sub-ject’s position [1,2].
The importance of PI was previously reported for regulating sagittal balance, which leads to optimal lordo-sis of the lumbar spine and thoracic kypholordo-sis [4]. More-over, several investigations have reported significant correlations between PI and 2D-PT and 2D-SS [5–8].
Pelvic parameters, even PI, measured by using 2D radiographic images are influenced by the rotation of the pelvis [9, 10]. Many studies have reported the disadvan-tage of the 2D measurement with regard to accuracy; measurement error was between 3 and 6° [11,12].
Vrtovec et al. [13] originally described that the three-dimensional (3D) measurement by using reconstructed images from computed tomography are not affected by the projection plane, rotation, and/or lateral tilt of the pelvis; additionally, it is not difficult to identify the hip center because of overlap of the pelvis, image contrast, and soft tissue artifacts [14–16]. Measurements of PI are not always suitable in all patients, especially those with osteoarthritis of the hip joint whose femoral head is nonspherical, subluxed, or dislocated.
Moreover, 2D-PT and 2D-SS change depending on the subject’s position; therefore, the relationship of these an-gles as anatomical anan-gles is unclear.
If the bone model of the pelvis is adjusted to the same reference plane of the pelvis, PI, PT, and SS are all consid-ered as anatomical parameters. There are no reports on the relationship between PI, anatomical-PT, and anatomical-SS. The purposes of this study were to evaluate pelvic mor-phological parameters using a 3D measurement obtained by computed tomography and compare them between
normal, healthy men and women and younger and older subjects. We also validated this 3D measurement by using intraobserver and interobserver reliabilities. We hypothe-sized that the relationship between PI, anatomical-PT, and anatomical-SS would be different between men and women because the morphological feature of the pelvis is different between men and women [17,18]. This 3D measurement may have a high reliability.
Methods
Subjects
For this cross-sectional study performed between August 1, 2010, and December 31, 2010, we recruited 108 healthy Japanese subjects (55 men and 53 women) without lum-bago or knee pain and without any abnormal findings of the hip, knee, and spine on radiographic examination.
Computed tomography scans from all participants were examined to reconstruct a 3D bone model [19–21]. This study was approved by the institutional research board of the university, and written informed consent was obtained from all participants. The study population was stratified by age (< 50 vs. ≥50 years) and sex (male subjects vs. female subjects).
Coordinate system of the pelvis
We used ZedHip® software (Lexi, Tokyo, Japan) to create a 3D digital bone model from computed tomography data that accurately reproduced the spatial relationship be-tween the pelvis and femur [19–21]. We adjusted the 3D pelvis model to the anterior pelvic plane [22]. The pelvic X-axis (Xpaxis),Ypaxis, andZpaxis were defined
accord-ing to definitions in previously reported protocols [15,23].
Measurements of the pelvic parameters
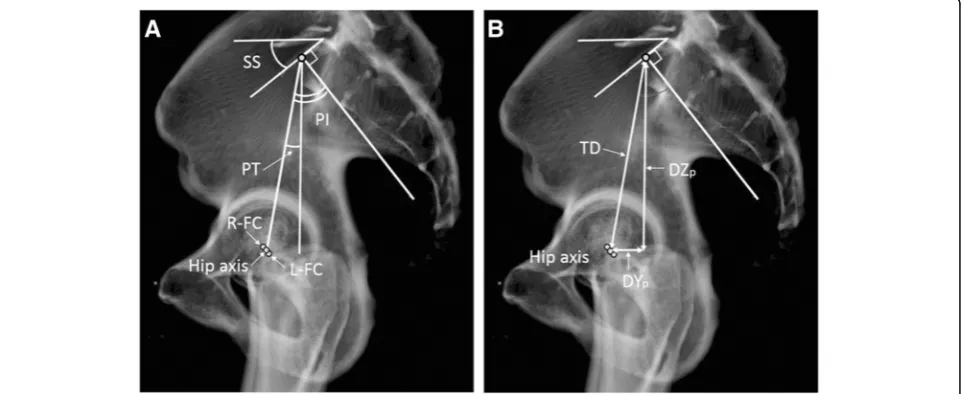
The PI angle was defined between the line perpendicular to the inclination of the superior end plate of S1 and the line connecting the center of the sacral end plate with the hip axis that connected the centers of both femoral heads, pro-jected in the sagittal plane (Fig.2a). Anatomical-PT was de-fined as the angle between the line connecting the midpoint of the sacral plate to the hip axis and the vertical line pro-jected in the sagittal plane (Fig.2a). Anatomical-SS was de-fined as the angle between the superior end plate of S1 and the horizontal line projected in the sagittal plane (Fig.2a).
The total distance between the center of the sacral end plate and hip axis projected in the sagittal plane was mea-sured, and distances with regard to each anteroposterior
direction,Ypcoordinate of the pelvis (DYp) and
craniocau-dal directionZpcoordinate of the pelvis (DZp) were
mea-sured same as our previous study [16], because total distance, DYp, and DZp potentially affected PI and
anatomical-PT (Fig.2b).
Statistical analysis
All parameters are reported as average ± 2 standard devi-ation. We used SPSS statistical software, version 24 (SPSS, Inc., Chicago, IL) to analyze the data. Differences between PI, anatomical-PT, anatomical-SS, and the dis-tance between the center of the sacral end plate and hip axis projected in the sagittal plane in the study groups Fig. 1Definition of the center of the sacral end plate of S1. The center of the sacral end plate of S1 (c) is defined as the point that divided the right and left halves in the coronal plane (a) and divided the front and rear halves in the sagittal plane (b)
were analyzed using the pairedttest. We used Pearson coef-ficients to determine the correlation coefcoef-ficients of the pelvic parameters. To evaluate variation, we calculated the mean absolute difference, variability (standard deviation), and intraobserver and interobserver reliabilities with intraclass correlation coefficients and a two-sided 95% confidence interval. We measured 1-week intervals for intraobserver re-liability at least twice. Apvalue < 0.05 was considered statis-tically significant. We compared the measurements of another observer to assess the interobserver reliability. We also performed a post hoc analysis to evaluate statistical power (type II (β) error). We defined the effect size (d) as 0.5 and type I (α) error as 0.05 according to thettest, and the effect size (d) as 0.3 and type I (α) error as 0.05 in the correlation analysis.
Results
Details of the 108 participants are as follows: 55 men (age 49.3 ± 30.1 [range 19–79] years, body height 166.0 ± 11.4 [range 153–179] cm, body weight 63.3 ± 16.6 [range 42–79] kg, body mass index 22.9 ± 4.5 [range 15.6–29.3] kg/m2) and 53 women (age 49.1 ± 29.6 [range 18–79] years, body height 151.9 ± 12.1 [range 135–164] cm, body weight 52.4 ± 14.6 [range 43–73] kg, body mass index 22.7 ± 5.6 [range 17.0–29.6] kg/m2
). The group of subjects younger than 50 years consisted of 26 men (28.1 ± 21.6 [range 19–49] years) and 28 women (31.2 ± 22.0 [range 18–46] years), whereas the group of subjects aged 50 years or older consisted of 29 men (64.5 ± 20.8 [range 53–79] years) and 25 women (63.8 ± 21.9 [range 53–79] years).
There was no significant difference in PI, anatomical-PT, anatomical-SS, the distance in the Yp coordinate, distance
in theZpcoordinate, and total distance between men and
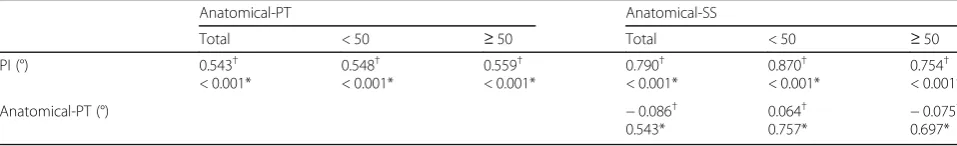
women (Table1). There was a strong correlation between PI and anatomical-SS in both men and women (R= 0.790 and 0.715, respectively) (Tables2and3).
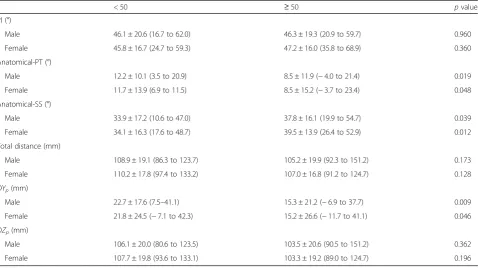
With regard to age-specific differences, the values of anatomical-PT were lower (pvalues, men 0.019, women 0.048) and values of anatomical-SS were greater among older men and women (p values, men 0.039, women 0.012), whereas the value of PI was similar between younger and older male and female subjects (p values, men 0.960, women 0.360) (Tables4). Moreover, the dis-tance in theYpcoordinate was significantly lower among
older male and female subjects (p values, men 0.009, women 0.046), whereas there were no significant differ-ences in the distance in the Zp coordinate (p values,
men 0.362, women 0.196) and total distance (p value, men 0.173, women 0.128) (Table4).
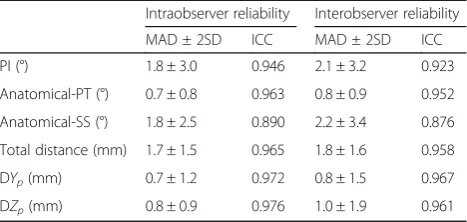
Regarding validation, the results showed that intraobser-ver mean absolute differences were 1.8 mm for total dis-tance and 1.8° for PI and anatomical-SS, and the minimal correlation coefficient was 0.890 for anatomical-SS (Table5). However, the interobserver mean absolute difference was slightly larger than the intraobserver mean absolute differ-ence (maximum mean absolute differdiffer-ences were 2.1 mm for total distance and 2.2° for anatomical-SS), and the min-imal correlation coefficient was 0.876 for anatomical-SS (Table5).
With regard to the post hoc analysis, power values were 0.825 according to thettest and 0.945 in the correlation
Table 1Difference in anatomical pelvic parameters between male and female subjects
Male subjects Female subjects pvalue PI (°) 46.2 ± 19.2 (16.7 to 62.0) 47.0 ± 16.3 (24.7 to 68.9) 0.653 Anatomical-PT (°) 10.3 ± 11.9 (−4.0 to 21.4) 10.0 ± 14.6 (−6.6 to 23.5) 0.803 Anatomical-SS (°) 35.9 ± 16.1 (10.6 to 54.7) 37.1 ± 15.5 17.6 to 52.9) 0.472 Total distance (mm) 107.0 ± 19.9 (86.3 to 151.2) 108.4 ± 17.0 (91.2 to 133.2) 0.942 DYp(mm) 18.8 ± 21.2 (−6.9 to 41.1) 18.3 ± 26.1 (−11.7 to 42.3) 0.836
DZp(mm) 104.7 ± 20.5 (80.6 to 151.2) 105.9 ± 18.8 (89.0 to 133.1) 0.539
Upper low: average ± 2 standard deviation, lower low: range
PIpelvic incidence,PTpelvic tilt,SSsacral slope,DYpdistance of theYpcoordinate,DZpdistance of theZpcoordinate
Table 2Correlation between PI, anatomical-PT, and anatomical-SS in male subjects
Anatomical-PT Anatomical-SS
Total < 50 ≥50 Total < 50 ≥50 PI (°) 0.543†
< 0.001*
0.548† < 0.001*
0.559† < 0.001*
0.790† < 0.001*
0.870† < 0.001*
0.754† < 0.001* Anatomical-PT (°) −0.086†
0.543*
0.064†
0.757* − 0.075† 0.697*
analysis of men and women, 0.572 according to thettest and 0.745 in the correlation analysis of men aged < 50 years and men aged≥50 years, and 0.559 according to the ttest and 0.730 in the correlation analysis of women aged < 50 years and women aged≥50 years, respectively.
Discussion
In our study, we found that pelvic parameters such as PI, anatomical-PT, and anatomical-SS were similar be-tween men and women. Therefore, the relative location of the center of the S1 superior end plate and hip axis was similar between male and female subjects; it was well known that there are several differences in the morphology and/or contour of the pelvis between men and women [17, 18]. Consequently, pelvic parameters are valid to use without any distinction of sex. Moreover, the distance in the Yp coordinate, distance in the Zp
coordinate, and total distance were also similar between men and women, whereas body height was approxi-mately 1.1 times larger in men than in women in this study. We preliminarily adjusted the total distance of men to conform with the body height of women; the ad-justed total distance of men was calculated as 97.9 using the following formula: 107.0 × (151.9/166.0), and the dif-ference of the total distance between men and women increased over 10 mm. Therefore, these distances were considered as relatively larger in women than in men with consideration of the difference in body height. This morphological difference may be due to the width of the birth canal in women.
There was a strong correlation between PI and anatomical-SS in both male and female subjects and younger and older groups. This novel concept may be useful to estimate PI from anatomical-SS because the
Table 3Correlation between PI, anatomical-PT, and anatomical-SS in female subjects
Anatomical-PT Anatomical-SS
Total < 50 ≥50 Total < 50 ≥50 PI (°) 0.516†
< 0.001*
0.510† < 0.010*
0.494† < 0.010*
0.715† < 0.001*
0.716† < 0.001*
0.676† < 0.010* Anatomical-PT (°) −0.403
0.003 − 0.340
0.112 − 0.392† 0.039*
PTpelvic tilt,SSsacral slope †Upper low: correlation coefficient *Lower low:pvalue
Table 4Difference in anatomical pelvic parameters between < 50 and≧50 years in age
< 50 ≥50 pvalue
PI (°)
Male 46.1 ± 20.6 (16.7 to 62.0) 46.3 ± 19.3 (20.9 to 59.7) 0.960 Female 45.8 ± 16.7 (24.7 to 59.3) 47.2 ± 16.0 (35.8 to 68.9) 0.360 Anatomical-PT (°)
Male 12.2 ± 10.1 (3.5 to 20.9) 8.5 ± 11.9 (−4.0 to 21.4) 0.019 Female 11.7 ± 13.9 (6.9 to 11.5) 8.5 ± 15.2 (−3.7 to 23.4) 0.048 Anatomical-SS (°)
Male 33.9 ± 17.2 (10.6 to 47.0) 37.8 ± 16.1 (19.9 to 54.7) 0.039 Female 34.1 ± 16.3 (17.6 to 48.7) 39.5 ± 13.9 (26.4 to 52.9) 0.012 Total distance (mm)
Male 108.9 ± 19.1 (86.3 to 123.7) 105.2 ± 19.9 (92.3 to 151.2) 0.173 Female 110.2 ± 17.8 (97.4 to 133.2) 107.0 ± 16.8 (91.2 to 124.7) 0.128 DYp(mm)
Male 22.7 ± 17.6 (7.5–41.1) 15.3 ± 21.2 (−6.9 to 37.7) 0.009 Female 21.8 ± 24.5 (−7.1 to 42.3) 15.2 ± 26.6 (−11.7 to 41.1) 0.046 DZp(mm)
Male 106.1 ± 20.0 (80.6 to 123.5) 103.5 ± 20.6 (90.5 to 151.2) 0.362 Female 107.7 ± 19.8 (93.6 to 133.1) 103.3 ± 19.2 (89.0 to 124.7) 0.196
Upper low: average ± 2 standard deviation, lower low: range
measurements of PI are not always suitable in all pa-tients, especially those with osteoarthritis of the hip joint whose femoral head is not spherical or whose femoral head is subluxed or dislocated. Based on our results, the formula could be calculated to estimate PI from anatomical-SS as follows: PI = 0.79 × anatomi-cal-SS + 17.76.
With regard to the values of PI, they were similar be-tween male and female subjects and younger and older subjects. For normal subjects, it is generally accepted that PI increases during childhood and then remains unchanged throughout adolescence and adulthood [6,24]. Our results were similar to those in previous studies [6,24]. However, several studies reported that PI was influenced by age and significantly larger in late adulthood [25, 26]. The differ-ences between our study and these studies are unclear. These previous studies and our study were cross-sectional, not longitudinal; therefore, further analysis should be done.
We speculated that the sacrum; the center of the S1 su-perior end plate was tilted anteriorly and translated anteri-orly simultaneously with aging; thus, anatomical-PT was lower and anatomical-SS was larger in older subjects than in younger patients in both sexes.
In 2D measurements, 2D-PT and 2D-SS are considered as positional parameters, and only PI is a morphological parameter. Many previous studies have measured PI using 2D sagittal radiographs in standing position [4,11,12,27]. They reported that the measurement error was between 3 and 6° [11, 12]. Regarding the measurement of PI using the 3D method, few studies have been reported, but Vrto-vec et al. [13] reported that mean PI was 47° in 370 nor-mal subjects, mean absolute difference was 2.5 ± 2.3°, and the correlation coefficient was 0.946. We also obtained a lower measurement error using this 3D method than using a previously reported 2D measurement [9, 12]. However, it is difficult to examine the computed tomog-raphy scans of all patients for several reasons such as the high cost and radiation exposure; therefore, further inves-tigation is required to validate these novel 3D measure-ments even in the previously reported 2D method. Our
results were considered to have high reliability, similar to those of Vrtovec et al. (Table1).
The current study has several limitations. First, only a few subjects were enrolled. Second, this study was a cross-sec-tional study; therefore, the differences between younger and older subjects may not always be true due to long-term changes. Further investigation of the relationship between these parameters may be required to explore the detailed changes of these parameters as they are altered by aging.
Conclusions
We found no differences in anatomical references, such as PI, anatomical-SS, and anatomical-PT, between men and women. However, there was a strong correlation be-tween PI and anatomical-SS among younger and older subjects in both sexes. This novel measurement concept may be useful to estimate PI from anatomical-SS be-cause the measurements of PI are not always suitable in all patients, especially those with osteoarthritis of the hip joint whose femoral head is not spherical or whose femoral head is subluxed or dislocated.
Abbreviations
2D:Two-dimensional; 3D: Three-dimensional; DYp: Distance of theYp coordinate; DZp: Distance of theZpcoordinate; ICC: Interclass correlation coefficient; MAD: Mean absolute difference; PI: Pelvic incidence; PT: Pelvic tilt; SD: Standard deviation; SS: Sacral slope
Acknowledgements
We would like to thankEditage(www.editage.com) for English language editing and publication support.
Funding
No external funding was received for this study.
Availability of data and materials
The datasets used and/or analyzed during the current study are available from the corresponding author on reasonable request.
Authors’contributions
Conceptualization and formulation are done by NI, DM, and TI. Investigation and data collection were done by all the authors. NI carried out the statistical analysis. The study was performed under the supervision of DM and NE. All authors read and approved the final manuscript.
Ethics approval and consent to participate
This study was approved by the institutional research board of Niigata University School of Medicine. All procedures performed in studies involving human participants were in accordance with the ethical standards of the institutional and/or national research committee and with the 1964 Helsinki declaration and its later amendments or comparable ethical standards. Informed consent was obtained from all individual participants included in the study.
Consent for publication
All patients gave their written consent to publish to report individual patient data.
Competing interests
The authors declare that they have no competing interests.
Publisher’s Note
Springer Nature remains neutral with regard to jurisdictional claims in published maps and institutional affiliations.
Table 5Intraobserver and interobserver reliabilities
Intraobserver reliability Interobserver reliability MAD ± 2SD ICC MAD ± 2SD ICC PI (°) 1.8 ± 3.0 0.946 2.1 ± 3.2 0.923 Anatomical-PT (°) 0.7 ± 0.8 0.963 0.8 ± 0.9 0.952 Anatomical-SS (°) 1.8 ± 2.5 0.890 2.2 ± 3.4 0.876 Total distance (mm) 1.7 ± 1.5 0.965 1.8 ± 1.6 0.958 DYp(mm) 0.7 ± 1.2 0.972 0.8 ± 1.5 0.967
DZp(mm) 0.8 ± 0.9 0.976 1.0 ± 1.9 0.961
PIpelvic incidence,PTpelvic tilt,SSsacral slope,DYpdistance of theYp
coordinate,DZpdistance of theZpcoordinate,MADmean absolute difference,
Author details
1Division of Comprehensive Geriatrics in Community, Niigata University
Graduate School of Medical and Dental Sciences, 1-757, Asahimachi-do-ri, Chuou ku, Niigata City, Niigata Prefecture 951-8167, Japan.2Division of Orthopedic Surgery, Department of Regenerative and Transplant Medicine, Niigata University Graduate School of Medical and Dental Sciences, Niigata, Japan.3Division of Advanced Materials Science and Technology, Niigata
University Graduate School of Science and Technology, Niigata, Japan.
4Division of Orthopedic Surgery, Saiseikai Niigata Daini Hospital, Niigata,
Japan.5Division of Orthopedic Surgery, Niigata Riko Hospital, Niigata, Japan.
Received: 2 January 2019 Accepted: 25 April 2019
References
1. Schwab F, Patel A, Ungar B, Farcy JP, Lafage V. Adult spinal deformity-postoperative standing imbalance: how much can you tolerate? An overview of key parameters in assessing alignment and planning corrective surgery. Spine. 2010;35:2224–31.
2. Roussouly P, Nnadi C. Sagittal plane deformity: an overview of interpretation and management. Eur Spine J. 2010;19:1824–36.
3. Offierski CM, MacNab I. Hip-spine syndrome. Spine. 1983;8:316–21. 4. Legaye J, Duval-Beaupère G, Hecquet J, Marty C. Pelvic incidence: a
fundamental pelvic parameter for three-dimensional regulation of spinal sagittal curves. Eur Spine J. 1998;7(2):99–103.
5. Labelle H, Roussouly P, Berthonnaud É, Transfeldt E, O’brien M, Chopin D, et al. Spondylolisthesis, pelvic incidence, and spinopelvic balance: a correlation study. Spine. 2004;29:2049–54.
6. Vaz G, Roussouly P, Berthonnaud E, Dimnet J. Sagittal morphology and equilibrium of pelvis and spine. Eur Spine J. 2002;11:80–7.
7. Roussouly P, Gollogly S, Berthonnaud E, Dimnet J. Classification of the normal variation in the sagittal alignment of the human lumbar spine and pelvis in the standing position. Spine. 2005;30:346–53.
8. Lafage V, Schwab F, Skalli W, Hawkinson N, Gagey PM, Ondra S, et al. Standing balance and sagittal plane spinal deformity: analysis of spinopelvic and gravity line parameters. Spine. 2008;33:1572–8.
9. Jin HM, Xu DL, Xuan J, Chen JX, Chen K, Goswami A, et al. Changes in pelvic incidence, pelvic tilt, and sacral slope in situations of pelvic rotation. Clin Spine Surg. 2017;30:E923–30.
10. Tyrakowski M, Wojtera-Tyrakowska D, Siemionow K. Influence of pelvic rotation on pelvic incidence, pelvic tilt, and sacral slope. Spine. 2014;39: E1276–83.
11. Lazennec JY, Ramare S, Arafati N, Laudet CG, Gorin M, Roger B, et al. Sagittal alignment in lumbosacral fusion: relations between radiological parameters and pain. Eur Spine J. 2000;9:47–55.
12. Boulay C, Tardieu C, Hecquet J, Benaim C, Mitulescu A, Marty C, et al. Anatomical reliability of two fundamental radiological and clinical pelvic parameters: incidence and thickness. Eur J Orthop Surg Traumatol. 2005;15: 197–204.
13. Vrtovec T, Janssen MM, PernušF, Castelein RM, Viergever MA. Analysis of pelvic incidence from 3-dimensional images of a normal population. Spine. 2012;37:E479–85.
14. Mangione P, Gomez D, Senegas J. Study of the course of the incidence angle during growth. Eur Spine J. 1997;6:163–7.
15. Imai N, Ito T, Suda K, Miyasaka D, Endo N. Pelvic flexion measurement from lateral projection radiographs is clinically reliable. Clin Orthop Relat Res. 2013;471:1271–6.
16. Imai N, Miyasaka D, Tsuchiya K, Suzuki H, Ito T, Minato I, et al. Evaluation of pelvic morphology in female patients with developmental dysplasia of the hip using three-dimensional computed tomography: a cross-sectional study. J Orthop Sci. 2018;23:788–92.
17. LaVelle M. Natural selection and developmental sexual variation in the human pelvis. Am J Phys Anthropol. 1995;98:59–72.
18. Duncan ST, Bogunovic L, Baca G, Schoenecker PL, Clohisy JC. Are there sex dependent differences in acetabular dysplasia characteristics? Clin Orthop Relat Res. 2015;473:1432–9.
19. Sato T, Koga Y, Omori G. Three-dimensional lower extremity alignment assessment system: application to evaluation of component position after total knee arthroplasty. J Arthroplasty. 2004;19:620–8.
20. Kobayashi K, Sakamoto M, Tanabe Y, Ariumi A, Sato T, Omori G, et al. Automated image registration for assessing three-dimensional alignment of
entire lower extremity and implant position using bi-plane radiography. J Biomech. 2009;42:2818–22.
21. Ariumi A, Sato T, Kobayashi K, Koga Y, Omori G, Minato I, et al. Three-dimensional lower extremity alignment in the weight-bearing standing position in healthy elderly subjects. J Orthop Sci. 2010;15:64–70. 22. Lewinnek GE, Lewis JL, Tarr RI, Compere CL, Zimmerman JR. Dislocations
after total hip-replacement arthroplasties. J Bone Joint Surg. 1978;60:217–20. 23. Imai N, Ito T, Takahashi Y, Horigome Y, Suda K, Miyasaka D, et al. In vivo
relationship between the clinical epicondylar axis and the anterior pelvic plane in normal subjects. J Biomed Sci Eng. 2013;6:863–8.
24. Hammerberg EM, Wood K. Sagittal profile of the elderly. J Spinal Disord Tech. 2003;16:44–50.
25. Bao H, Liabaud B, Varghese J, Lafage R, Diebo BG, Jalai C, et al. Lumbosacral stress and age may contribute to increased pelvic incidence: an analysis of 1625 adults. Eur Spine J. 2018;27:482–8.
26. Jean L. Influence of age and sagittal balance of the spine on the value of the pelvic incidence. Eur Spine J. 2014;23:1394–9.