R E S E A R C H
Open Access
Evolution of communities of software:
using tensor decompositions to compare
software ecosystems
Oliver A. Blanthorn
1*, Colin M. Caine
2and Eva M. Navarro-López
3*Correspondence:
[email protected] 1School of Computer Science, University of Manchester, Manchester, UK
Full list of author information is available at the end of the article
Abstract
Modern software development is often a collaborative effort involving many authors through the re-use and sharing of code through software libraries. Modern software “ecosystems” are complex socio-technical systems which can be represented as a multilayer dynamic network. Many of these libraries and software packages are open-source and developed in the open on sites such asGitHub, so there is a large amount of data available about these networks. Studying these networks could be of interest to anyone choosing or designing a programming language. In this work, we use tensor factorisation to explore the dynamics of communities of software, and then compare these dynamics between languages on a dataset of approximately 1 million software projects. We hope to be able to inform the debate on software dependencies that has been recently re-ignited by the malicious takeover of the npm package event-streamand other incidents through giving a clearer picture of the structure of software dependency networks, and by exploring how the choices of language designers—for example, in the size of standard libraries, or the standards to which packages are held before admission to a language ecosystem is granted—may have shaped their language ecosystems. We establish that adjusted mutual information is a valid metric by which to assess the number of communities in a tensor decomposition and find that there are striking differences between the communities found across different software ecosystems and that communities do experience large and interpretable changes in activity over time. The differences between the elm and R software ecosystems, which see some communities decline over time, and the more conventional software ecosystems of Python, Java and JavaScript, which do not see many declining communities, are particularly marked.
Keywords: Tensor factorisation, Multilayer temporal networks, Software dependency networks
Introduction
Contemporary software authors routinely depend on and re-use the software packages of authors with whom they have no contact. This uncoordinated process creates what have recently been called “software ecosystems” (Decan et al.2018): extensive networks of interdependent software components that are used and maintained by large communities of contributors all over the world. These ecosystems are complex multi-layered networks whose nodes and edges both evolve over time. Throughout this work, terminology such as ‘package’, ‘package manager’, ‘dependency’ follow the usual software engineering con-vention, as documented by Decan et al. (2018). With this work we would like to contribute
to the debate on software dependencies, which recently re-emerged due to the hijacking of theevent-streampackage after previous incidents (Baldwin2018; Schlueter2016; Durumeric et al.2014), by giving a clearer picture of the structure of software dependency networks. For this, we propose a novel framework to model and analyse the formation, long-term behaviour and change with time of communities of software packages, and compare these behaviours across several programming languages.
The evolution of software and package dependency networks has been extensively stud-ied by using network science techniques over the past 15 years. An early such work is (Myers2003), which has been followed by others (Pan et al.2011; Xu et al.2005; Zheng et al.2008). A recent survey on this topic is given by Savi´c et al. (2019). Methods and tools used for social networks have also been applied to analyse software evolution (Chatzige-orgiou and Melas2012), reinforcing the importance of the social component in evolving software networks. There has been recent success in applying standard network metrics to analyse how software ecosystems have evolved with time (Decan et al.2018).
Collaborative software networks—mainly in free and open-source software (FOSS) environments—can be considered as adaptive, evolving or temporal networks. Most of the published works highlight the fact that software networks exhibit scale-free network properties with a power-law-type node degree distribution (Cai and Yin2009; Lian Wen et al.2009; Louridas et al.2008) and a clear preferential attachment in the network growth process (Li et al.2013; Chaikalis and Chatzigeorgiou2015), confirming the heterogeneity and hierarchical characteristics of networks of software. Other key properties in software systems like maintainability and reliability (Chong and Lee2015), robustness (Gao et al. 2014), and modularity (Zanetti and Schweitzer2012) have been also analysed using the complex network paradigm.
The identification of communities in software dependency networks that evolve over time is one of the main motivations of our work. Community detection in temporal, evolving or adaptive networks has largely attracted network scientists’ attention due to its important implications in the analysis of dynamical processes in complex networks, such as spreading and cascading dynamics, stability, synchronisation and robustness. Differ-ent types of methods and algorithms have been used, for example: the Louvain algorithm (Aynaud and Guillaume2010), statistical null models (Bassett et al.2013; Sarzynska et al. 2016), algorithms which exploit the historic community structure of the network (He et al. 2017; He and Chen2015), Markov models (Rosvall et al.2014), semidefinite programming (Tantipathananandh and Berger-Wolf 2011), gravitational relationship between nodes (Yin et al. 2017), and temporal matrix factorisation (Yu et al. 2017), amongst others. Machine learning techniques (Savi´c et al.2019; Xin et al.2017), genetic algorithms (Folino and Pizzuti 2014), consensus clustering (Aynaud and Guillaume 2010) and tensor fac-torisation (Araujo et al.2014; Gauvin et al.2014) have only recently been used for the detection of communities in temporal networks.
networks where the authors of a package may have no idea where their work is being used. Additionally, the community detection methods used are static, so it is the metrics on the types of communities found at each version of Apache Ant which are compared rather than the qualities of any individual communities being tracked across time.
The novelty of our work is the detection of dynamic communities in temporal software dependency networks, the use of tensor decompositions on software ecosystems, and the use of adjusted mutual information (AMI) to assist in choosing the number of com-munities. Additionally, some of the networks we study are amongst the largest dynamic networks to which tensor factorisation has been applied, although there have been studies considering much larger static networks (Kang et al.2012).
Our work addresses three research questions corresponding to unsolved problems in collaborative large-scale software development and evolution over time:
• RQ1What are the differences between different software ecosystems?
• RQ2What do communities of commonly-used-together software packages look like? • RQ3How do these communities change with time?
By answering these questions, we identify communities of packages in the ecosystems of several languages. Namely: Elm; JavaScript; Rust; Python; R; and Java. These languages were chosen because data on their package ecosystems are readily available and they rep-resent a variety of uses and ages: low-level systems languages; scientific computing; and web development; with histories between 3 and 20 years long.
The rest of this manuscript is structured as follows. Firstly, in the “Methods” section, we detail the data, mathematical tools, software and hardware used to conduct this study. Next, the “Results and discussion” section presents our results and provides some discussion of why they might have arisen. Finally, the “Conclusions” section compares our results with prior work and provides a summary of this works’ limitations while elucidating further avenues of research.
Methods
What is a community?
Software packages associated with a single programming language and package manager form anecosystem, and acommunityis a collection of packages that tensor decomposi-tion has identified. Communities may be related by some theme and by co-occurrence of activity over time. They might be collections of numerical computing packages, or a community of packages that use a particular library, or a community of older packages that became obsolete. Packages may be in more than one community, which is modelled by vectors of continuous strengths of membership to each community as detailed in the “Tensor decompositions” section below. Communities may wax and wane over time.
Further detail on how we calculate communities and membership strengths thereof is given in the “Tensor decompositions” and “Choosing the number of communities,R” sections.
Shape of the data
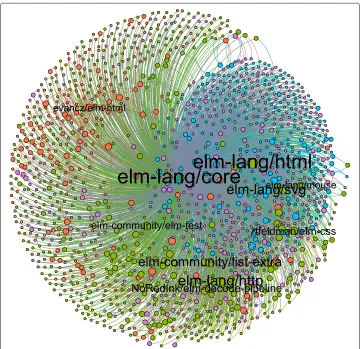
analysis. To simplify our analysis, we do not consider specific versions of dependent packages—each package depends on some other packages at each time, each of which is assumed to be the most up-to-date package available at that time. We only consider packages registered with these package managers and do not consider cross-platform (inter-language) dependencies. The data cover 1 million projects listed in package man-agers. This is sourced from Libraries.io (Katz2018). The network of Elm dependencies at the final time-step is shown in Fig.1.
Brief introduction to each ecosystem
Here, we will briefly introduce each language and ecosystem considered.
Elm (elm-lang.org) is a relatively small new language created in 2012 as a func-tional language for developing web applications. It is unusually focused on a single domain and unusually restrictive in what can be expressed in listed packages. The language authors explicitly discourage proliferation of packages in favour of a unified and carefully designed standard package for each task. It aims to eliminate runtime
Fig. 1Elm network. Elm network visualised usingGephi. Node and label size corresponds to out-degree. Each nodeiis coloured according to the strongest strength of community membership given byκias
described in the Methods section. Legend: light-green corresponds to the community we labelled as
elm-lang/core, purple toelm-lang/http, blue toelm-lang/html, and orange to
errors and many classes of logical errors through static analysis and careful language design.
Python is a very popular general-purpose interpreted programming language. It was first released in 1991. Its package manager, PyPI (https://pypi.org/), was released in 2002. Python is notable for having a large standard library; many features such as HTTP and GUI support that would be external packages in other languages are included by default. We therefore suspect that Python’s package ecosystem will look quite different to many of the other languages we consider. It is perhaps pertinent to note that some of the packages listed in PyPI are designed to be used by end-users, not developers.
JavaScript is another popular general-purpose interpreted programming language. It was first released in 1995 as part of the Netscape browser and was initially used for client-side scripts on web pages, but now has several server-side implementations, most notably Node.js. JavaScript has a very small standard library, with the exception of the DOM interface (Document Object Model—a representation of a web page), which is included. We therefore expect most JavaScript packages to have to depend on many other packages. JavaScript’s most common package manager is npm (npmjs.com), the Node.js package manager, which was released in 2010. The JavaScript ecosystem we describe in this paper is the public npm registry, which is thede factocanonical list of JavaScript packages. Despite its name, the registry is used for all types of JavaScript, not just server-side applications. Like PyPI, some of the packages listed in npm are designed to be used by end-users, not developers.
Rust is another relatively new systems programming language. Unlike many of the other ecosystems we have considered, it is statically compiled. One of its main aims is safe concurrent programming. We suspect that because of this conservative focus, packages written in Rust will have relatively few dependencies. Rust’s package manager is Cargo, which was released in 2014, and its registry iscrates.io. Like PyPI, some of the packages listed on crates.io are designed to be used by end-users, not developers.
R is an interpreted programming language for statistical computing. It was first released in 1993. Its standard library for statistical computing is large. Its package manager is the Comprehensive R Archive Network (CRANcran.r-project.org).
Java is a general-purpose typed compiled programming language, first released in 1995. Its standard library is large. Java has no official package manager, but the most widely used is Apache Maven (maven.apache.org), which was released in 2004.
Representing the data
We represent each language’s network as a tensor,Alang, where each
Aijt∈ {0, 1}
most recently available version of the software package at that time. The time is quantised into timesteps. We chose a resolution of one month on the basis that packages are long-lived and change dependencies rarely.
Tensor decompositions
A rank-NtensorXcan be approximated as
X≈
R
r=1
reduceNn=1(⊗,anr),
where reduceNn=1(,bn)returns the reduction of{bn|n∈ 1..N}by applying an arbitrary
associative binary operatorrepeatedly, i.e.
reduceNn=1(,bn)=b1b2b3. . .bN;
⊗is the tensor product; and eachanr∈Rdn+wherednis the dimension of thenth-mode
of the tensorX.
Eachanr for a specificnis called a factor, and maps its indices (in our case, software
packages or time) to strength of membership to the communityr. The total number of communities or components,R, is a fixed chosen parameter. Eachanr for a specificris
called a community or component. The concept of a temporal index having strengths of community membership may seem odd; it is perhaps more easily understood as the amount of community activity at a certain time (Gauvin et al.2014).
There are many algorithms for performing tensor decompositions of this kind. We selected a non-negative method with a public implementation that will allow us to later extend our analysis to large rank-N tensors: Alternating Proximal Gradient (APG-TF)1 (Xu and Yin2013), an efficient non-negative CANDECOMP/PARAFAC (CP) method. We consider the use of tensor decomposition (Kolda and Bader2009) more adequate for community detection in temporal networks than other static methods, such as the Lou-vain algorithm (Aynaud and Guillaume2010), because tensor decompositions explicitly integrate evolution over time and can scale very efficiently for large graphs.
For our specific application, we approximate our temporal adjacency matrix as
Aijt≈ R
r=1
κirhjrτtr, (1)
whereκriare the elements of a matrixK∈R+Np×Rthat describe the strengths of
com-munity membership of each node ibased on outgoing links,hrj are the elements of a
matrixH ∈ R+Np×Rwhich represent the strengths of community membership of each nodejbased on incoming links,τrtare the elements of a matrixT ∈R+Nt×Rthat describe
the activity levels of each communityrat each time stept, andNpandNtare the number
of packages considered and the number of timesteps chosen, respectively.
We will now describeH andK in more detail. We will use two facts about software dependency networks (Decan et al.2018):
• the number of outgoing links from each package (number of packages that depend on a package) follows a power-law;
• the number of incoming links to each package (number of packages that a package depends on) is fairly evenly distributed.
SinceHrepresents groups of nodes which are linked to by similar nodes, it is very sparse with only a few hub nodes having any community membership due to high strengths inH. Kis much more evenly distributed as it represents groups of nodes which link to similar nodes; most packages are strongly associated with at least one community.
If a community has significantly declined from its peak according to a plot ofτr, we will
define its lifetime as the full width at half maximum.
Choosing the number of communities,R
One of the major downsides to tensor decompositions is that one must choose the num-ber of communities,R. We take a multi-faceted approach to evaluating our choice ofRfor each ecosystem, which we detail in this section. The first component of our approach is to look at the normalised residual sum of squares or relative error, NRSSR, a measure of
reconstruction error (Papalexakis et al.2012). We use it to inform our choice ofRby look-ing for the number of components where the rate at which the residual sum of squares decreases as the number of components increases becomes linear, commonly known as an elbow. We define the normalised residual sum of squares as:
NRSSR(X)=
X−Rr=1reducenN=1(⊗,anr)F XF
, (2)
whereXFis the Frobenius norm ofX.
The second component of our approach is to run the decomposition multiple times for each likelyRto determine whether the decomposition is stable, that is, if multiple runs produce the same results. We look to see if nodes appear in the same communities as each other by considering the mean pairwise adjusted mutual information (AMI, Vinh et al.2009) between repeated runs for a singleR. We use hard clustering for this process by assigning nodes to communities from the maximum strength in each vectorκi.
We also check visually to see if the temporal activity of communities looks similar across multiple decompositions. If the decomposition is unstable, i.e. if multiple runs produce different results, it suggests that ground-truth communities are being merged or split up. Another check we perform is to look at the metadata associated with a sample of software projects from each community and make a qualitative judgement as to whether they are similar. For example, if a numerical computing package and a front-end web development package are in the same community, the number of communities is probably too small. Our final check is whether adding an extra component adds interesting new behaviour to the temporal community activity, or if it instead seems to break an existing community into noisy subcommunities. All of these approaches are quite subjective, so there is quite a large uncertainty in exactly how many communities is ideal for each language.
Adjusted mutual information
The adjusted mutual information between two partitions U and V where U =
{U1,U2,. . .}is a finite-length partition of some set of lengthN andV is another finite
partition of that set is
where the entropySis
S(U)= −
i |Ui|
N log
|Ui| N ,
the mutual information betweenUandVis
I(U;V)=
|U|
i=1
|V|
j=1
|Ui∩Vj|
N log
N|Ui∩Vj| |Ui||Vj| ,
andE[W] is the expectation of a random variableW. Here, it can be calculated using a hypergeometric model of all possible random clusterings (Vinh et al.2009). AMI mea-sures the amount of agreement between two partitions. It has an upper bound of 1. An AMI score of 0 corresponds to the amount of agreement one would expect if one of the partitions was totally random, and 1 corresponds to perfect agreement between the two clusters. The AMI score can be negative if there is more disagreement between the clus-ters than one would expect from random chance. It is hard to interpret the meaning of scores between 0 and 1, but it is important to bear in mind that anything greater than 0 is a good score in the sense that it is better than random guessing. AMI is quite sensitive to the number of clusters and awards higher scores to pairs of clusterings that agree on the same number of assignments but have a larger number of clusters, to the limit where if each element is given its own cluster the AMI must be 1. Since we are mostly using AMI to compare clusterings with each other and have far fewer clusters (or communities) than nodes, we believe the interpretability of the absolute value of the AMI is not impor-tant. We are concerned primarily with the relative changes in AMI as we move from one number of communities to another.
Labelling communities
His a sparse matrix that denotes the packages that are most depended on in each commu-nity. The package name associated with a communityris the name of the packageprthat
is maximal inhr, such thatprdoes not have a higherhrvalue in any other communityr.
That is,
pr=indmax([ mask(H)]r),
where indmax(x)of any vectorxreturns the index of its maximum value, and
[ mask(M)]ij= ⎧ ⎨ ⎩
mij ifmij=max(mi)
0 otherwise, (3)
wheremijandmiare the elements and column vectors of a matrixM.
Hardware and software used
Summary
We examine the pairwise average adjusted mutual information (AMI) score and NRSSR(X)as defined in Eq. (2) to identify a suitable number of communities for each
ecosystem. A high AMI would indicate that the communities created by the decomposi-tion are stable across repeated runs of the algorithm.
Troughs between peaks in our AMI plots would indicate that communities are being split inappropriately. We will interpret the first peak in AMI as the minimum valid number of communities for an ecosystem.
Each community will then be labelled according to Eq. (3).
Results and discussion
Table1shows that there are clear differences between the language ecosystems in all the statistics we calculate.
Degree distribution
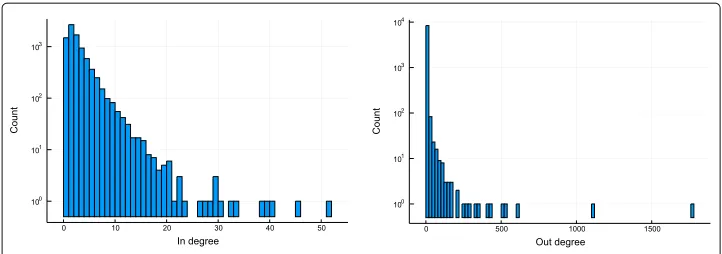
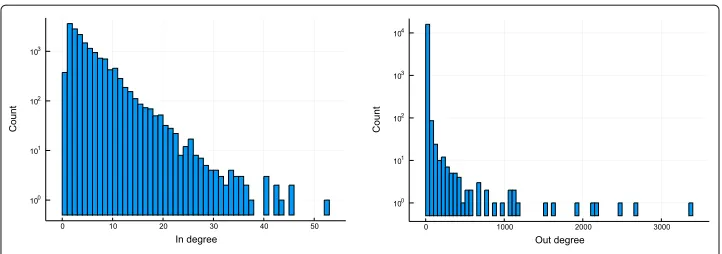
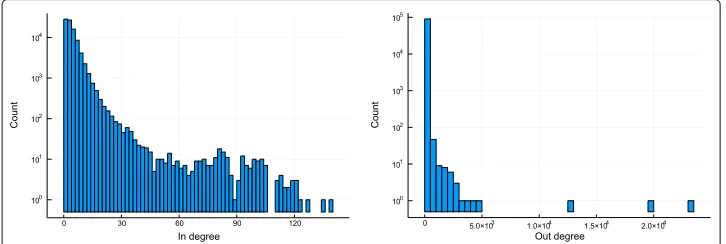
Python packages have a mean number of 2.4±2.9 direct dependencies where JavaScript packages have 9.9±22. Figures2,3,4,5,6and7show that the distributions of in and out degree look fairly similar in shape; broadly, all out degree distributions follow a power-law and the in degree distributions follow more Poissonian distributions.
The exception to this rule is npm, the JavaScript ecosystem, whose in-degree distribu-tion is bimodal: there are more packages with the highest numbers of dependencies than there are with middling numbers of dependencies. Upon further investigation, it turns out that the distribution is skewed by a few hundred joke/malicious packages2and some irregularly packaged packages that list all their recursive dependencies as their direct dependencies3. We chose not to omit these packages from the decomposition as we hoped
that tensor decomposition might discover them as a community.
We believe that the presence of a rich and well-used standard library—the functions included in the language without any other dependencies—reduces the mean degree of an ecosystem. Python (degree 2.4) has such a library, while JavaScript (degree 9.9) emphatically does not.
Elm (degree 2.6) features a small standard library compared to Python, but its library is very rich within its domain of web application development.
Rust (degree 4.4) features a small standard library by design (instead promoting and curating community packages). R (degree 5.3) features a fairly small standard library, and many users now prefer the communitytidyversecollection as a consistent community alternative.
Number of communities
Figures7,8,9,10and11show mean AMI and NRSS for each number of communities we evaluated for each ecosystem. We computed 10 decompositions for each trialled number of communities in each ecosystem.
Of all the techniques mentioned in the “Choosing the number of communities, R” section, identifying a suitable number of communities was easiest by looking for early
2Such asneat-230
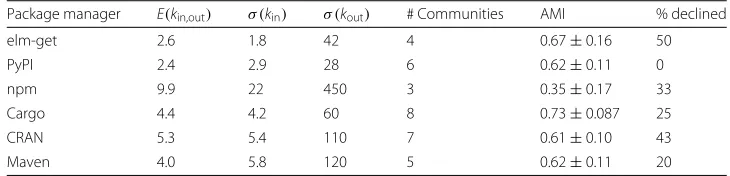
Table 1Summary statistics for each ecosystem
Package manager E(kin,out) σ (kin) σ (kout) # Communities AMI % declined
elm-get 2.6 1.8 42 4 0.67±0.16 50
PyPI 2.4 2.9 28 6 0.62±0.11 0
npm 9.9 22 450 3 0.35±0.17 33
Cargo 4.4 4.2 60 8 0.73±0.087 25
CRAN 5.3 5.4 110 7 0.61±0.10 43
Maven 4.0 5.8 120 5 0.62±0.11 20
Number of communities is the number we choose to plot and analyse. For elm-get, CRAN and PyPI, other numbers of communities also seemed reasonable. NRSS not reported because it did not contribute to analysis. Communities are considered to have declined if their activity at the end of the study period is substantially lower than their peak activity. All numbers are provided to two significant figures.krefers to the in and out degrees,σis the standard deviation, andEis the arithmetic mean.
peaks in the AMI plots, which correlated well with visual inspection of decomposition sta-bility and our manual checks on package names. The NRSS plots have no obvious elbows and contributed nothing to our analysis; we include them as a relevant negative result.
For Elm, CRAN, and PyPI, AMI indicates more than one “good” number of communi-ties to split the ecosystem into. We have chosen the smallest good number except when that number was two.
We observed interesting differences between ecosystems in this metric: Elm and R have relatively high AMIs at relatively low numbers of components while other languages such as JavaScript had low AMIs for all of the numbers of components we tried, suggesting that a more representative number of components might be much higher. This tells us something about the diversity of an ecosystem: the more communities it has, the more diverse it must be.
Activity over time
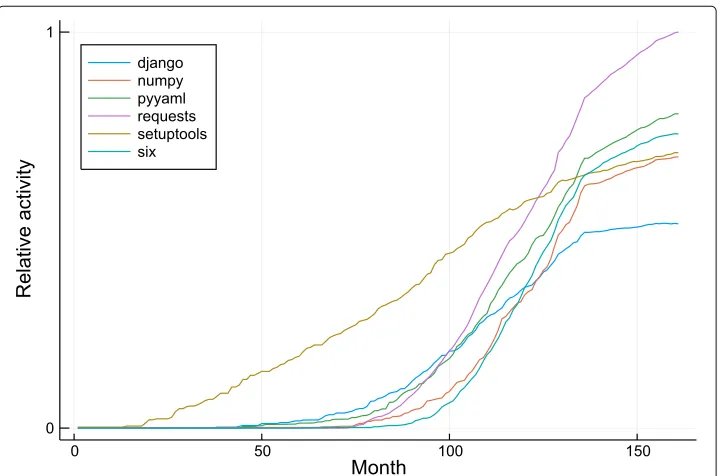
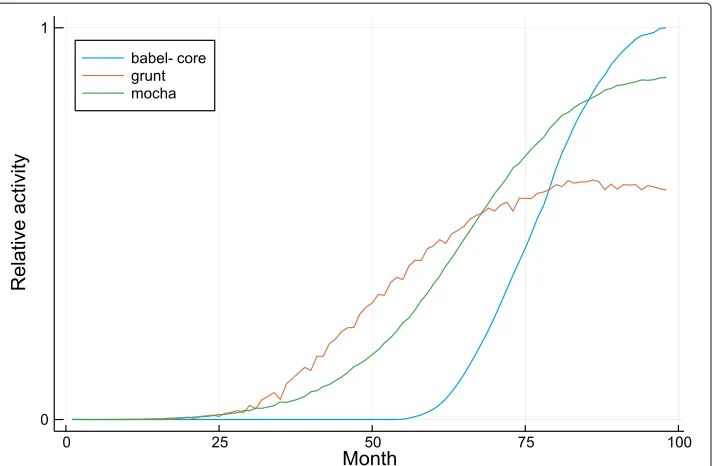
Figures12,13,14,15, and16show the relative activity of communities in each ecosystem over time for a representative decomposition; i.e. they are plots ofτrtfrom Eq. (1) against
time,t.
The labels are reasonably stable across decompositions when AMI is high and they appear to be informative in most ecosystems. The relative size and activity over time of the communities can often be matched with what we know about the their constituent packages and the ecosystem from other sources.
Fig. 3PyPI degree distributions. In and out degree distributions for the PyPI package ecosystem
The community activity plots show clear differences between the various ecosystems. Elm, R and Rust all contain communities that decline in activity over time. Some lan-guages such as Elm, R and Rust have “peaky” community activity where packages have been replaced by others. Java, Python and JavaScript do not exhibit such behaviour; sug-gesting that their communities are more stable. The “% declined” column in Table 1 summarises this behaviour.
Community composition
Comparing ecosystems, we observe that Python has communities centred around mak-ing websites (django), scientific computing (numpy), or interpreting configuration files (pyyaml). By contrast, Elm’s communities are all to do with building web applications, and R’s communities are mostly focused towards scientific computing. This suggests, uncontroversially, that Elm and R are less general purpose languages than Python.
In the following sections we examine and provide interpretations for the composition of communities within each ecosystem.
Ecosystem-specific results
Elm
Figure 12 shows community activity over time. evancz/html is the precursor of elm-lang/htmland we can see an early community of packages usingevancz/html that decays over time as the newer community usingelm-lang/htmlemerges. We can
Fig. 5Cargo degree distributions. In and out degree distributions for the Cargo package ecosystem
also see the swift rise of a community of HTTP-using packages. This is perhaps particu-larly pronounced in Elm because the language is unusually restrictive (there was no offi-cial way to write HTTP packages before the package which becameelm-lang/http) and young (there was a strong known demand for an obvious feature like HTTP support). Theevancz/htmldeprecation neatly shows that many earlier packages were aban-doned and did not make the jump to Elm 0.17 andelm-lang/html4. Those that do make the jump move community and those that do not remain in the package manager as abandonware.
Elm is a young and deliberately unconventional and experimental language, so it is to be expected that many packages will be abandoned as the community experiments with different approaches.
The rapid changes in activity indicate that the Elm ecosystem is not stable, that is, communities have experienced large relative changes in activity recently.
High AMI for communities two and four suggest that the Elm ecosystem is not diverse as it is well described by small numbers of communities.
Python
Figure13demonstrates how these communities change over time: it is interesting that there are no communities which have declined particularly. One community,django, a web application framework, seems to have stagnated. Google Trends data suggest that interest in it has reached a plateau compared to frameworks in other languages such as Reactfor JavaScript.
The growth of communities, as shown in Fig.13, seems to be monotonic. There do not appear to be any major deprecated packages, which is surprising, given the impending deprecation of Python version 2, which is incompatible with Python version 3. This could be due to the popular packagesix which provides compatibility helpers for Python 2 and 3.
JavaScript
The AMI plot for npm is given in Fig.9. We chose not to calculate the NRSS values due to computational constraints. The AMI for every number of communities we trialled is very low and although we use three communities in the time activity plot, Fig.14, we are not particularly confident that the communities picked are meaningful. It is plausible that some larger number of communities would fit the data better, however we trialled up to 50 communities with no success.
Fig. 6CRAN degree distributions. In and out degree distributions for the CRAN package ecosystem
Rust
The AMI and NRSS plots for Rust are shown in Fig.10. The AMI plot strongly indicates a first peak at 8 communities.
Figure 15 demonstrates how these communities change over time. Of
particu-lar note are the communities centered around rustc-serialize and serde.
rustc-serializehas been deprecated and officially replaced with theserde pack-age. The decline in activity of therustc-serializecommunity and rise of theserde community is quite distinct and clearly occurs at the same time.
The community labelled winapi is also easily interpretable. The K factor for this community is bimodal and the size of the higher strength cluster indicates that there are around 450 packages in this community. A brief review of these packages suggests that they are low-level cross-platform packages for interacting with the operating system. These packages were amongst the first written and predate the package manager, which explains their steep initial rise.
R
As shown in Fig.11, AMI suggests that decomposition into two, seven, or nine communi-ties is acceptable. That CRAN can be stably decomposed into two communicommuni-ties suggests that the ecosystem is not very diverse, which is as we would expect from a language focused on scientific and statistical computing.
Fig. 8Choosing the number of communities: PyPI. Left: the mean pairwise adjusted mutual information of the community-node membership across repeated decompositions. 1 is a perfectly stable assignment to communities; 0 is perfectly random. The shaded area corresponds to twice the standard error of the mean. Right: the mean normalised residual sum of squares error for repeated decompositions on the PyPI network against the number of components. The shaded area corresponds to twice the standard error of the mean above and below the line
It can be seen in Fig.16that when decomposed into seven communities, distinctive waves of activity over time exist. We believe these waves are driven by CRAN’s rolling release model which requires packages to be actively maintained or de-listed. This is a strong incentive for package authors to switch dependencies if e.g. one of two testing libraries is actively maintained. The de-listing also means that older, unused packages are removed from the dependency graph over time, unlike any of the other studied ecosystems.
Visible in Fig.16and an exemplar of this behaviour,RUnitis an older unmaintained testing library andtestthat is a more modern replacement. Unlike any other long-established language in this analysis, there is a clear and steep decline of the earlier library in favour of the competitor5.
Fig. 9npm adjusted mutual information against components. The pairwise adjusted mutual information of the community-node membership across repeated decompositions. 1 is a perfectly stable assignment to communities; 0 is perfectly random. The shaded area corresponds to twice the standard error of the mean above and below the line
Fig. 10 Choosing the number of communities: Cargo. Left: the mean pairwise adjusted mutual information of the community-node membership across repeated decompositions. 1 is a perfectly stable assignment to communities; 0 is perfectly random. The shaded area corresponds to twice the standard error of the mean. Right: the mean normalised residual sum of squares error for repeated decompositions on the Cargo network against the number of components. The shaded area corresponds to twice the standard error of the mean above and below the line
Despite R being an old language, some of its communities have grown at a rapid rate, specifically those relating toknitr, andtestthat. This suggests that, despite being an older language, R’s ecosystem is still subject to significant change.
Defining community lifetime as the full width at half maximum, we can see from Fig.16 that communities tend to stay active for approximately 4 to 8 years.
Java
The AMI plot, Fig.17, strongly indicates an unambiguous peak at 5 communities. AMI is very low for two communities and comparatively low for three and four, suggesting that Maven has a wider diversity of communities than CRAN or elm-get. These communities include a distinct Scala community, a kind of dialect of Java, centered around the Scala standard library.
Figure18demonstrates how these communities change over time. There is a general upwards trend and some noise that may be spurious. As noted in Decan et al. (2018), there may be issues with the Maven dataset that are affecting these results.
Conclusions
Fig. 11 Choosing the number of communities: CRAN. Left: the mean pairwise adjusted mutual information of the community-node membership across repeated decompositions. 1 is a perfectly stable assignment to communities; 0 is perfectly random. The shaded area corresponds to twice the standard error of the mean. Right: the mean normalised residual sum of squares error for repeated decompositions on the CRAN network against the number of components. The shaded area corresponds to twice the standard error of the mean above and below the line
by the decomposition in favour of later, larger communities. It would be interesting to investigate whether this effect is real.
Based on our analysis, we have the following answers to our research questions:
• RQ1What are the differences between different software ecosystems?
There are differences in the number of communities of software packages, the rate at which communities of software packages gain and lose popularity as measured by how often they are dependant on each other, and in the overall trajectory of the growth of these communities.
• RQ2What do communities of commonly-used-together software packages look like?
Similar to the languages as a whole, the communities have fairly homogeneous in-degree distributions but heterogeneous power-law out-degree distributions.
• RQ3How do these communities change with time?
Fig. 13 PyPI community activity. Relative activity of each community in each month. The communities are named by important packages as detailed in the “Methods” section
The general rule is “up and to the right”: all of the ecosystems we considered increased in activity as time went on, in agreement with Decan et al. (2018). This is unsurprising as it is relatively rare for a package to lose dependencies—it can fall out of use, but the packages that previously depended on it will tend to continue to depend on it.
Our results agree with that found in other works, especially that of Decan et al. (2018). Figure16in particular shows the effect of CRAN’s strict rolling-release model where out-of-date packages are archived (meaning that they are no longer as easy to install); Fig.15
Fig. 15 Cargo community activity. Relative activity of each community in each month. The communities are named by important packages as detailed in the “Methods” section
shows how the Rust ecosystem seems to start very suddenly as the package manager came relatively late into the language’s life.
For Java specifically, our work does not show much overlap with the communities found by Šubelj and Bajec (2011). This could be due to differences in between their static and our dynamic community detection, but it could also be that the validity of our
Fig. 17 Choosing the number of communities: Maven. Left: the mean pairwise adjusted mutual information of the community-node membership across repeated decompositions. 1 is a perfectly stable assignment to communities; 0 is perfectly random. The shaded area corresponds to twice the standard error of the mean. Right: the mean normalised residual sum of squares error for repeated decompositions on the Maven network against the number of components. The shaded area corresponds to twice the standard error of the mean above and below the line
results is questionable for Maven as theLibraries.iodata for Maven is incomplete (Decan et al.2018).
The absolute level of the adjusted mutual information at low numbers of communities seems to reflect the diversity of an ecosystem: R and elm, both domain specific languages, have high levels of AMI for 2 and 3, whereas all of the general purpose languages we consider do not.
Methodologically, we found that using adjusted mutual information as a metric by which to choose the number of communities led to (predominantly) explainable commu-nities that appeared to be stable across multiple runs of the decompositions and across multiple values of the number of communities chosen. Our labelling algorithm, Eq. (3)
Fig. 19 Maven degree distributions. In and out degree distributions for the Maven package ecosystem
worked well for our application, giving plausible and comprehensible labels, and could plausibly work well for any communities in networks with power-law degree distribu-tions. The stability of an ecosystem can be seen from our activity over time plots, i.e. the
τrvectors.
Further work could involve investigating larger components for languages for which we currently have fairly low AMI scores. It would also be fairly straight-forward to extend our technique to consider the co-authorship network that creates the software as another layer in the network. Knowledge of how the ecosystem evolves organically could be used to detect fraudulent packages, especially by unknown authors. The creation of models of software ecosystem evolution from simple sets of rules (for example, 10% of packages are deprecated every 6 months) to try to replicate our results synthetically could also prove insightful.
Our work could have applications in helping designers of software ecosystems to make informed choices; it is clear that, for example, CRAN’s rolling release policy has a big impact on its software communities. One could imagine using clusterings like those we have created to determine whether part of a software ecosystem was on the wane and was likely to be replaced soon. Such considerations would make sense if one was choosing dependencies for a project that was intended to last many years. Additionally, if one knows how communities form naturally, it becomes easier to pick out outliers, as we have seen with the npm “joke” packages.
Abbreviations
AMI: Adjusted mutual information; APG-TF: Alternating proximal gradient tensor factorisation; CANDECOMP: Canonical decomposition; CP: CANDECOMP/PARAFAC; CRAN: Comprehensive R archive network; DOM: Document object model; FOSS: Free and open-source software, HTTP: Hypertext transfer protocol; LIDA: Leeds institute for data analytics; NRSS: Normalised residual sum of squares; PARAFAC: parallel factor analysis; PyPI: Python package index
Acknowledgements
This work was undertaken on MARC1, part of the High Performance Computing and Leeds Institute for Data Analytics (LIDA) facilities at the University of Leeds, UK. The authors would also like to thank Andrea Schalk, Emlyn Price, and Joseph French for providing useful feedback on an early version of the manuscript.
Authors’ contributions
OAB created the initial concept—the research plan, methodology, and the application to software packages—and wrote the majority of the paper. CMC and OAB wrote the code and the results and discussion section in a roughly even split. ENL wrote the introduction. All authors discussed the experimental design and edited the paper.
Funding
OAB’s work was supported as part of an Engineering and Physical Sciences Research Council (EPSRC) grant, project reference EP/I028099/1.
Availability of data and materials
The data used in this research is available fromdoi.org/10.5281/zenodo.2536573. All of our code is available at doi.org/10.5281/zenodo.2610369andgithub.com/bovine3dom/evolution-of-software-communities.
Competing interests
The authors declare that they have no competing interests.
Author details
1School of Computer Science, University of Manchester, Manchester, UK.2School of Geography, University of Leeds,
Leeds, UK.3School of Environment, Education and Development, University of Manchester, Manchester, UK.
Received: 27 March 2019 Accepted: 23 August 2019
References
Araujo M, Papadimitriou S, Stephan G, Papalexakis EE, Koutra D (2014) Com2 : Fast Automatic Discovery of Temporal (‘Comet’) Communities. PAKDD 2014, Part II, LNAI 8444:271–283
Aynaud T, Guillaume J-L (2010) Static community detection algorithms for evolving networks. In: Proceedings of Modeling and Optimization in Mobile, Ad Hoc, and Wireless Networks (WiOpt). pp 513–519.https://doi.org/10.1016/j. niox.2011.03.001
Bader BW, Kolda TG (2007) Efficient MATLAB computations with sparse and factored tensors. SIAM J Sci Comput 30(1):205–231.https://doi.org/10.1137/060676489
Baldwin A (2018) Details about the event-stream incident. https://blog.npmjs.org/post/180565383195/details-about-the-event-stream-incident
Bassett DS, Porter MA, Wymbs NF, Grafton ST, Carlson JM, Mucha PJ (2013) Robust detection of dynamic community structure in networks. Chaos 23(1).https://doi.org/10.1063/1.4790830.1206.4358
Bezanson J, Karpinski S, Shah VB, Edelman A (2012) Julia: A fast dynamic language for technical computing. arXiv preprint arXiv:1209.5145
Bromberger S (2017) JuliaGraphs/LightGraphs.jl.https://doi.org/10.5281/zenodo.1412141
Cai KY, Yin BB (2009) Software execution processes as an evolving complex network. Inf Sci 179(12):1903–1928.https:// doi.org/10.1016/j.ins.2009.01.011
Chaikalis T, Chatzigeorgiou A (2015) Forecasting java software evolution trends employing network models. IEEE Trans Softw Eng 41(6):582–602.https://doi.org/10.1109/TSE.2014.2381249
Chatzigeorgiou A, Melas G (2012) Trends in object-oriented software evolution: Investigating network properties. Proc Int Confer Softw Eng:1309–1312.https://doi.org/10.1109/ICSE.2012.6227092
Chong CY, Lee SP (2015) Analyzing maintainability and reliability of object-oriented software using weighted complex network. J Syst Softw 110:28–53.https://doi.org/10.1016/j.jss.2015.08.014
Concas G, Monni C, Orru M, Tonelli R (2013) A study of the community structure of a complex software network. International Workshop on Emerging Trends in Software Metrics, WETSoM:14–20.https://doi.org/10.1109/WETSoM. 2013.6619331
Decan A, Mens T, Grosjean P (2018) An empirical comparison of dependency network evolution in seven software packaging ecosystems. Empirical Software Engineering:1–36.https://doi.org/10.1007/s10664-017-9589-y.1710.04936 Dietrich J, Yakovlev V, McCartin C, Jenson G, Duchrow M (2008) Cluster analysis of Java dependency graphs. In:
Proceedings of the 4th ACM Symposium on Software Visuallization - SoftVis ’08. ACM Press, New York. p 91.https:// doi.org/10.1145/1409720.1409735.http://portal.acm.org/citation.cfm?doid=1409720.1409735
Durumeric Z, Li F, Kasten J, Amann J, Beekman J, Payer M, Weaver N, Adrian D, Paxson V, Bailey M, Halderman JA (2014) The Matter of Heartbleed. In: Proceedings of the 2014 Conference on Internet Measurement Conference. IMC ’14. ACM, New York. pp 475–488.https://doi.org/10.1145/2663716.2663755
Folino F, Pizzuti C (2014) An evolutionary multiobjective approach for community discovery in dynamic networks. IEEE Trans Knowl Data Eng 26(8):1838–1852.https://doi.org/10.1109/TKDE.2013.131
Gauvin L, Panisson A, Cattuto C (2014) Detecting the community structure and activity patterns of temporal networks: A non-negative tensor factorization approach. PLoS ONE 9(1).https://doi.org/10.1002/9781119156253.ch10.1308.0723 He J, Chen D (2015) A fast algorithm for community detection in temporal network. Physica A: Stat Mech Appl 429:87–94.
https://doi.org/10.1016/j.physa.2015.02.069
He J, Chen D, Sun C, Fu Y, Li W (2017) Efficient stepwise detection of communities in temporal networks. Physica A: Stat Mech Appl 469:438–446.https://doi.org/10.1016/j.physa.2016.11.019
Kang U, Papalexakis E, Harpale A, Faloutsos C (2012) Gigatensor: scaling tensor analysis up by 100 times-algorithms and discoveries. In: Proceedings of the 18th ACM SIGKDD International Conference on Knowledge Discovery and Data Mining. ACM. pp 316–324
Katz J (2018) Libraries.io Open Source Repository and Dependency Metadata.https://doi.org/10.5281/zenodo.2536573. https://doi.org/10.5281/zenodo.2536573
Kluyver T, Ragan-Kelley B, Pérez F, Granger B, Bussonnier M, Frederic J, Kelley K, Hamrick J, Grout J, Corlay S, Ivanov P, Avila D, Abdalla S, Willing C (2016) Jupyter Notebooks – a Publishing Format for Reproducible Computational Workflows. In: Loizides F, Schmidt B (eds). Positioning and Power in Academic Publishing: Players, Agents and Agendas. IOS Press. pp 87–90
Kolda TG, Bader BW (2009) Tensor Decompositions and Applications. SIAM Review 51(3):455–500.https://doi.org/10. 1137/07070111X
Li H, Zhao H, Cai W, Xu J-Q, Ai J (2013) A modular attachment mechanism for software network evolution. Physica A: Statistical Mechanics and its Applications 392(9):2025–2037.https://doi.org/10.1016/j.physa.2013.01.035 Lian Wen, Dromey RG, Kirk D (2009) Software Engineering and Scale-Free Networks, Vol. 39.https://doi.org/10.1109/
TSMCB.2009.2020206
Louridas P, Spinellis D, Vlachos V (2008) Power laws in software. ACM Trans Softw Eng Methodol 18(1):1–26.https://doi. org/10.1145/1391984.1391986
Myers CR (2003) Software systems as complex networks: Structure, function, and evolvability of software collaboration graphs, Vol. 68.https://doi.org/10.1103/PhysRevE.68.046116.0305575
Pan W, Li B, Ma Y, Liu J (2011) Multi-granularity evolution analysis of software using complex network theory. J Syst Sci Compl 24(6):1068–1082.https://doi.org/10.1007/s11424-011-0319-z
Papalexakis EE, Faloutsos C, Sidiropoulos ND (2012) Parcube: Sparse parallelizable tensor decompositions. In: Joint European Conference on Machine Learning and Knowledge Discovery in Databases. Springer Vol. 10. pp 521–536. https://doi.org/10.1145/2729980.http://dl.acm.org/citation.cfm?doid=2808688.2729980
Paymal P, Patil R, Bhowmick S, Siy H (2011) Empirical Study of Software Evolution Using Community Detection. Cs.Unomaha.Edu. January 2015
Pedregosa F, Varoquaux G, Gramfort A, Michel V, Thirion B, Grisel O, Blondel M, Prettenhofer P, Weiss R, Dubourg V, Vanderplas J, Passos A, Cournapeau D, Brucher M, Perrot M, Duchesnay E (2011) Scikit-learn: Machine learning in Python. J Mach Learn Res 12:2825–2830
Rosvall M, Esquivel AV, Lancichinetti A, West JD, Lambiotte R (2014) Memory in network flows and its effects on spreading dynamics and community detection. Nat Commun 5:1–13.https://doi.org/10.1038/ncomms5630
Sarzynska M, Leicht EA, Chowell G, Porter MA (2016) Null models for community detection in spatially embedded, temporal networks. J Compl Netw 4(3):363–406.https://doi.org/10.1093/comnet/cnv027
Savi´c M, Ivanovi´c M, Jain LC (2019) Complex Networks in Software, Knowledge, and Social Systems 148.https://doi.org/ 10.1007/978-3-319-91196-0
Savi´c M, Radovanovi´c M, Ivanovi´c M (2012) Community detection and analysis of community evolution in Apache Ant class collaboration networks:229.https://doi.org/10.1145/2371316.2371361
Schlueter I (2016) kik, left-pad, and npm.https://blog.npmjs.org/post/141577284765/kik-left-pad-and-npm Šubelj L, Bajec M (2011) Community structure of complex software systems: Analysis and applications. Physica A: Stat
Mech Appl 390(16):2968–2975.https://doi.org/10.1016/j.physa.2011.03.036
Tantipathananandh C, Berger-Wolf TY (2011) Finding communities in dynamic social networks. Proc - IEEE Int Confer Data Mining, ICDM:1236–1241.https://doi.org/10.1109/ICDM.2011.67
Vinh NX, Epps J, Bailey J (2009) Information theoretic measures for clusterings comparison: Is a correction for chance necessary? In: Proceedings of the 26th Annual International Conference on Machine Learning. ICML ’09. ACM, New York. pp 1073–1080.https://doi.org/10.1145/1553374.1553511
Xin X, Wang C, Ying X, Wang B (2017) Deep community detection in topologically incomplete networks. Phys A: Stat Mech Appl 469:342–352.https://doi.org/10.1016/j.physa.2016.11.029
Xu J, Gao Y, Christley S, Madey G (2005) A TOPOLOGICAL ANALYSIS OF THE OPEN SOURCE SOFTWARE DEVELOPMENT COMMUNITY Scott Christley Dept . of Computer Science and Engineering University of Notre Dame Notre Dame. In: 46556, Proceedings of the 38th Hawaii International Conference on System Sciences - 2005 Vol. 00. pp 1–10 Xu Y, Yin W (2013) A Block Coordinate Descent Method for Regularized Multiconvex Optimization with Applications to
Nonnegative Tensor Factorization and Completion. SIAM J Imag Sci 6(3):1758–1789.https://doi.org/10.1137/ 120887795
Yin G, Chi K, Dong Y, Dong H (2017) An approach of community evolution based on gravitational relationship refactoring in dynamic networks. Phys Lett, Sec A: Gen, Atom Solid State Phys 381(16):1349–1355.https://doi.org/10.1016/j. physleta.2017.01.059
Yu W, Aggarwal CC, Wang W (2017) Temporally Factorized Network Modeling for Evolutionary Network Analysis:455–464.https://doi.org/10.1145/3018661.3018669
Zanetti MS, Schweitzer F (2012) A Network Perspective on Software Modularity. ARCS 2012:1–8.http://arxiv.org/abs/ 1201.3771
Zheng X, Zeng D, Li H, Wang F (2008) Analyzing open-source software systems as complex networks. Physica A: Stat Mech Appl 387(24):6190–6200.https://doi.org/10.1016/j.physa.2008.06.050
Publisher’s Note