Forecasting Gold Prices Based on Extreme Learning Machine
S. Kumar Chandar, M. Sumathi, S.N. SivanadamS. Kumar Chandar* Associate Professor,
Christ University, Bangalore, India
*Corresponding author: [email protected] M. Sumathi
Associate Professor,
Sri Meenakshi Government College For Arts For Women (Autonomous), Madurai, India
[email protected] S.N. Sivanandam
Professor Emeritus,
Karpagam College Of Engineering, Coimbatore, India [email protected]
Abstract: In recent years, the investors pay major attention to invest in gold market because of huge profits in the future. Gold is the only commodity which maintains its value even in the economic and financial crisis. Also, the gold prices are closely related with other commodities. The future gold price prediction becomes the warning system for the investors due to unforeseen risk in the market. Hence, an accurate gold price forecasting is required to foresee the business trends. This paper concentrates on forecasting the future gold prices from four commodities like historical data’s of gold prices, silver prices, Crude oil prices, Standard and Poor’s500stock index(S&P500) index and foreign exchange rate. The period used for the study is from1st January 2000to 31st April2014. In this paper, a learning algorithm for single hidden layered Feed forward neural networks called Extreme Learning Machine (ELM) is used which has good learning ability. Also, this study compares the five models namely Feed forward networks without feedback, Feed forward back propagation networks, Radial basis function, ELMAN networks and ELM learning model. The results prove that the ELM learning performs better than the other methods.
Keywords: Feed forward neural networks, Extreme Learning Machine, Gold price forecasting.
1
Introduction
Gold is the major commodity in the economic and monetary market. India and china are the major importers among the world and consumes 60 % of the global gold. Every day, the value of the gold increases and cannot be controlled. Nowadays, people tend to invest in gold owing to huge profits in future. The gold prices are closely related with other commodities. A hike in oil prices will have positive impact on gold prices and vice versa. When there is a hike in equities, gold prices goes down. This is because when there is a boom in the stock market, the investors tend to invest the gold money in the equities. Hence, an accurate gold price forecasting is required to foresee the business trends in future.
Soft Computing techniques like Neural Networks, Fuzzy logic, Genetic Algorithms, Particle Swarm Optimization and Simulation Annealing can be used to forecast the gold price. Among the above, Artificial Neural Networks are very accurate and predicts the future very well. Some of the recent studies on gold price forecasting are discussed below.
Gary et al. [1] used neural networks for forecasting Standard &Poor’s 500stock index and gold futures prices. Their forecast was based on the historical prices of the stock index and gold prices. Malliaris et al. [2] used times series techniques and Artificial Neural Networks for forecasting the prices of gold, oil and Euro. They gave an interrelationship among the three and proposed ANN technique to forecast the individual variables. And they concluded that both short term and long term relationship exist between the three variables. Mehdi Bijari et al. [3] proposed a hybrid ARIMA model using Fuzzy logic and Artificial Neural network for forecasting exchange rates and gold prices. Fuzzy logic and ANN was hybridized with the ARIMA model in order to get accurate results. The results explained that the proposed technique predicts the future prices accurately than the other methods. Ali et al. [4] uses Multilayer perceptron neural network model for predicting the changes in stock prices and gold prices. The data used in this study was Tehran’s Stock Exchange (T.S.E). The results showed that the ANN models perform better than the traditional statistical techniques. Deepika et al. [5] proposed Autoregressive Integrated Moving Average (ARIMA) models for forecasting the monthly gold price from period 1980to2012. This paper also finds the factors influencing the gold price using multiple regression analysis. Lazim Abdullah [6] used Auto-Regressive Integrated Moving Average (ARIMA) model for forecasting the selling prices of gold bullion coins. They forecasted that the selling prices are in the upward direction and the investors can invest money in the gold bullion coins.
Trian et al. [7] explored gold equivalent for forecasting steel prices in pipeline projects. This paper elaborates on how the steel prices depend on the gold price using a regression model of the historical data. Massarrat Ali Khan et al. [8] used Box-Jenkins, ARIMA model for forecasting the gold prices. The period used for the study was from January2003to March2012. They concluded that ARIMA model was the suitable model for forecasting the gold price. Bai Li [9] proposed Improved Artificial Bee colony algorithm (ABC) for forecasting the gold price modelling using Wavelet Neural Networks. The experimental results showed that the Improved ABC algorithm works more effective than the conventional ABC algorithm. Fengyi Zhang et al. [10] proposed the methods for forecasting gold price using Radial Basis Function (RBF) neural networks and hybrid fuzzy clustering algorithm. Principal Component Analysis was used to unite technical indicators namely Moving Average, Receive Operator Characteristics and P-Accuracy rate. The results showed that the hybrid fuzzy clustering algorithm works better than the RBF neural network. Hossein Mombeini et al. [11] developed a defined model for forecasting gold prices. The performance measures are used to access the accuracy of the model. They have presented gold price forecasting using two models namely artificial neural networks and ARIMA models and showed that the ANN model works better than the ARIMA model in terms of performance metrics.
This paper concentrates on forecasting the future gold prices from four commodities like historical data’s of gold prices, silver prices, Crude oil prices, Standard & Poor’s 500 stock index (S &P 500) index and foreign exchange rate. The period used for the study is from 1st January 2000 to 31st April2014. In this paper, a learning algorithm for single hidden layered Feed forward neural networks called Extreme Learning Machine (ELM) is used which has good learning ability. Also, this study compares the three models namely Feed forward networks without feedback, Feed forward back propagation networks and ELM learning model.
The organization of the paper is as follows: Section 1 summarizes on the Introduction and Literature survey. Section2illustrate on the research data used in this study, Section3explains the ELM algorithm. Section 4 explains on the application of ELM algorithm to gold price forecasting. Section 5 discusses on the results, Section 6 concludes the paper and Section 7 enlighten on the references used in the study.
2
Research data
The gold prices are normally related with other commodities like crude oil, stock prices, silver prices etc. The period of the study is from 1st January 2000 to 31st April 2014. The monthly data are used to forecast the future gold prices. In this study, the future gold prices are forecasted from four commodities like historical data’s of gold prices, silver prices, Crude oil prices, Standard&Poor’s500stock index (S &P 500index and foreign exchange rate.
The gold price and silver price data was gathered from http://www.bullion-rates.com/gold /INR/2014-4-history.htm, crude oil price data was collected from http://www.indexmundi// .com/commodities, Bombay stock exchange data was accumulated from http://bseindia.com website and foreign exchange data was collected from http://fxtop.com/en/historical-exchange-rates.phpMA=1.
In the sample data set, the input attributes contains the average monthly data of gold price per oz, the monthly average data of crude oil, the monthly average data of silver price, the monthly average value of US dollars in terms of Indian rupees the monthly average values of S &P 500stock data and the target attribute has the actual gold prices.
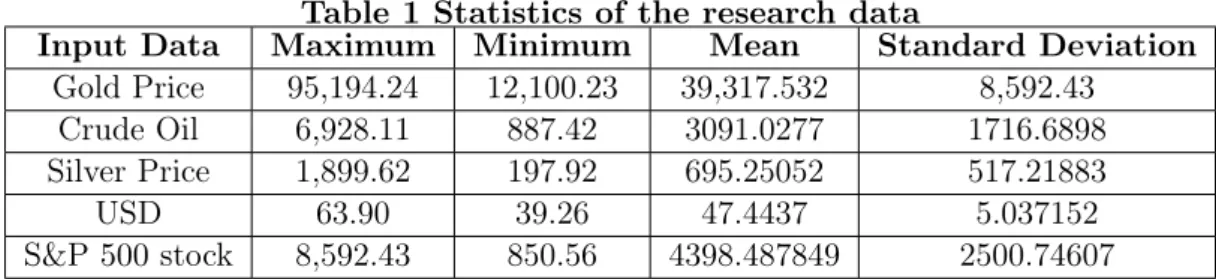
The summary statistics of the research data is calculated from the input data by finding the minimum, maximum, mean and standard deviation of these values.
Table 1 Statistics of the research data
Input Data Maximum Minimum Mean Standard Deviation
Gold Price 95,194.24 12,100.23 39,317.532 8,592.43 Crude Oil 6,928.11 887.42 3091.0277 1716.6898 Silver Price 1,899.62 197.92 695.25052 517.21883
USD 63.90 39.26 47.4437 5.037152
S&P 500stock 8,592.43 850.56 4398.487849 2500.74607
3
Extreme Learning Machine
Single layer feed forward network (SLFN) is one of the most common network architecture. It is widely used in many applications like classification and regression. Gradient descent learning methods like SLFN networks are time consuming and have serious issues such as over fitting, local minima problem and some parameters need to be tuned manually. Some researchers have discovered many possibilities for SLFN networks. Among all, Huang et al. [12–14] proposed that randomly chosen input weights and the bias weights in all the iterations with utmost N hidden neurons will bring desirable accuracy. Moore-Penrose generalized pseudo inverse is used for calculating the output weights. The learning algorithm is faster and has good generalization ability. This type of learning is known as ’Extreme Learning Machine’ (ELM).
The salient features of ELM are specified in a simple three step algorithm. In contrast to gradient descent methods, ELM need not see the training data before generating the hidden node parameters. ELM algorithm works for all piecewise continuous activation function. ELM tries to find solution for many problems like local minima, time consuming and tuning the parameters. It works easier than other learning algorithms such as neural networks and support vector machine. The brief overview on ELM algorithm is discussed below:
3.1 Extreme Learning Machine
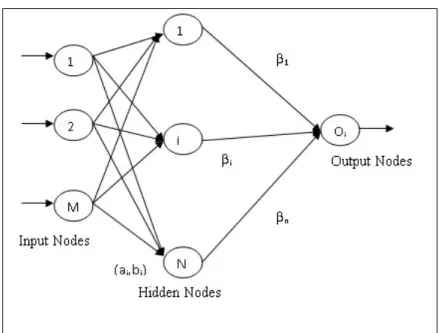
A single layer feed forward network with x1, x2, ..., xm, input nodes, h1, h2, ..., hn, hidden
Figure 1: Single layer feed forward network
Let(ai, bi)be the weights connecting from input layer to hidden layer andβ1, β2, ..., βnbe the
weights of the nodes connecting from hidden layer to the output layer. Let ’g’ be the piecewise continuous activation function. The hidden layer outputs are given as
N
∑
i=1
[βig(ai, bi, xj)] =tj, j= 1, ..., N (1)
Equation (1) can be rewritten asβH =T.HereH is called the hidden layer output matrix , which can be expressed as follows,
H(a1, ..., aN;b1, ..., bN;x1, ..., xM) = (2) G(a1, b1, x1) . G(aN, bN, x1) . . . G(a1, b1, xM) . G(aN, bN, xM) β= [β1β2...βn]T and T = [t1t2...tn]T (3)
In the hidden output matrix, each value represents the hidden output values of their cor-responding node. The three step ELM learning algorithm is as follows: In a Single layer feed forward neural network, (xi, ti) be the training pair and g(a, b, x) be the hidden node output
function.
Step 1: Initially hidden nodes are chosen randomly, (ai, bi) wherei= 1,2,3, ..., N
Step 2: Calculate the hidden layer output matrix H
Step 3: Calculate the output weights β where β= T. Here represents the Moore-Penrose inverse of hidden layer output matrix H.
4
An application of ELM learning to Gold price prediction
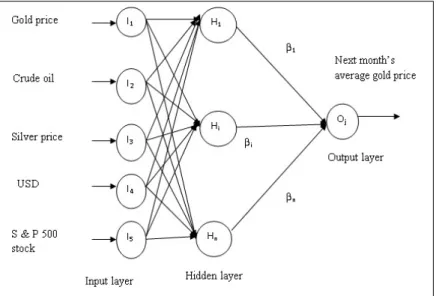
In this section, ELM training methodology is applied to gold price prediction. The proposed architecture is shown in Fig.2. The gold prices are normally related with other commodities like crude oil, stock prices, silver prices etc. The period of the study is from 1st January 2000 to 31st April 2014. In this figure, monthly average price of five parameters like gold price, crude oil, silver price, USD and S&P 500 stock price are taken as inputs for ELM learning network. The output of this network gives the next month’s gold average price. All the hidden nodes weights are chosen randomly. First, the hidden node output values are calculated from equation (1). Then the output of this network is calculated by multiplying outputs of the hidden nodes with the weights of the hidden node and the output nodes.
Figure 2: Architecture of the proposed system
5
Results and Discussions
All the implementations are carried out using MATLAB R2009 running in an ordinary PC with Pentium IV processor with 2.40 GHz speed and 256 MB of RAM. . The period of the study is from 1st January 2000 to 31stApril 2014. The monthly data are used to forecast the future gold prices. In this study, the future gold prices are forecasted from four commodities like historical data’s of gold prices, silver prices, Crude oil prices, Standard & Poor’s500 stock index (S & P 500) index and foreign exchange rate. Among the data, 70% of the data is used for training, 15%is used for validation and 15%of the data is used for testing.
The total number of trading days is 86 from (1st Jan2000 - 31stApr 2014). All the ANN models are predicting next month’s average gold value. The details of the historical datasets for all the prediction models are listed in Table 2
Details of the dataset Total number training validation Testing
of trading days Sample Sample Sample
Monthly average gold price Monthly average silver price Monthly average Crude oil price
Monthly average S&P 500- 172 120 26 26
stock index Monthly average US-dollars in Indian rupees
ELM learning algorithm is implemented and compared with other four existing neural networks such as feed forward neural network, back propagation network, Radial basis function and elman networks.
5.1 Feed forward networks without feedback
A network is said to be feed forward network when the outputs are not directed back as inputs to the same or preceding layer. In this network, the information moves only in one direction and there is no feedback. All the layers are trained using Levenberg-Marquardt (TRAINLM) function and INITNW and TRAINS functions are used for adaptation of weights. During training process, this network has been given with 1000 epochs. But, it achieves the best performance goal at 13th iterations. The training time, training accuracy, testing time and testing accuracy of this network is given in Table 3.
5.2 Feed forward back propagation networks
Back propagation networks are multi-layered feed forward networks trained with respect to the back propagation error algorithm. This is the most widely used network. Here, the outputs are directed back as inputs to the same or preceding layer nodes. Hence in this model, the function ’MAPMINMAX’ is used to reduce the noise in the dataset. Training is done with the Levenberg-Marquardt ’TRAINLM’ training function and back propagation weight/bias learning is done using ’LEARNGDM’ function. Adaption is done with ’TRAINS’ which updates weights with the specified learning function. The transfer function’TANSIG’function is used for hidden layers and ’PURELIN’function for output layer. Performance is measured according to the mean square error ’MSE’ performance function. This model runs up to 11 iterations and achieves the best performance goal. The training time, training accuracy, testing time and testing accuracy of this network is given in Table 3.
5.3 Radial basis function network
Radial Basis Function Network is a particular type of Feed Forward Network used for ap-proximating the functions and recognizing the patterns. The architecture of the network consists of three layers namely, the input layer, hidden layer and the output layer.
5.4 ELMAN networks
The ELMAN networks are a form of recurrent neural networks. A three layer feed forward network where a set of ’Context Units’ are attached to the hidden layer. At each time step, a copy of hidden layer unit is copied onto the Context unit having a weight of one. Thus the network is learnt by the current input signals, a copy of previous hidden layer unit’s i.e context
units and the output of the network. The context unit can be considered as a one of the inputs to the hidden layer.
5.5 ELM learning algorithm
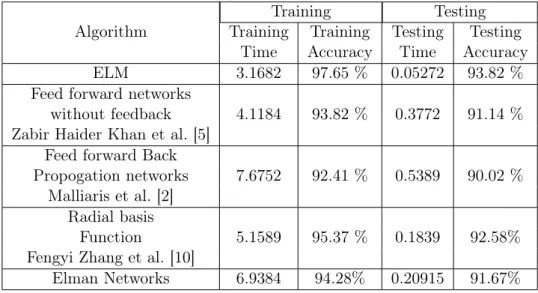
In this study, the weights of the hidden nodes are chosen randomly and the number of hidden nodes is varied from 5to 20. But the best training and testing accuracy was achieved when the number of hidden nodes was 10. When compared with the other two networks, ELM achieves 97.5%for training and 93.82% for testing. The performance of ELM algorithm with respect to gold price prediction is shown is Table 3.
Table 3 Performance comparison of different neural networks
Training Testing
Algorithm Training Training Testing Testing Time Accuracy Time Accuracy
ELM 3.1682 97.65 % 0.05272 93.82 %
Feed forward networks
without feedback 4.1184 93.82 % 0.3772 91.14 % Zabir Haider Khan et al. [5]
Feed forward Back
Propogation networks 7.6752 92.41 % 0.5389 90.02 % Malliaris et al. [2]
Radial basis
Function 5.1589 95.37 % 0.1839 92.58%
Fengyi Zhang et al. [10]
Elman Networks 6.9384 94.28% 0.20915 91.67%
The graph is drawn between monthly average gold value and time series which is shown in Fig.3. In this graph, the predicted gold prices are mapped and it is compared with the actual gold prices. From the graph, it is understood that this proposed model predicts the future gold prices more accurately with the actual gold prices.
6
Conclusions
An accurate gold price forecasting is necessary for predicting the future gold price. Hence in this paper, a new learning algorithm called ELM learning is applied which has good learning ability and generalization capability. The period used for the study is from 1st January 2000 to 31st April 2014. Since, the gold price is related with other commodities, four commodities like like historical data’s of gold prices, silver prices, Crude oil prices, Standard & Poor’s 500 stock index (S& P500) index and foreign exchange rate are given as inputs to the single layer feed forward network Also, this study compares the three models namely Feed forward networks without feedback, Feed forward back propagation networks and ELM learning model. The results clearly explain that the ELM algorithm achieve approximately 3%increase in the training and testing efficiency when compared with the other networks.
Bibliography
[1] Gary Grudnitski, Larry Osburn, Forecasting S&P and Gold Futures Prices: An Application of Neural Networks, The Journal of Futures Markets, 13(6) : 631-643, 1993.
[2] A.G. Malliaris and Mary Malliaris, Time Series and Neural Networks Comparison on Gold, Oil and the Euro, Proceedings of International Joint Conference on Neural Networks, Atlanta, Georgia, USA, June 14-19, 2009.
[3] MehdiBijari, Gholam AliRaissi Ardali, Improvement of Auto-Regressive Integrated Moving Average models using Fuzzy logic and Artificial Neural Networks (ANNs), Neurocomputing, 72 : 956-967, 2009.
[4] Ali ghezelbash, Predicting Changes in Stock Index and Gold prices to Neural Network ap-proach, The Journal of Mathematics and Computer Science, 4 : 227-236, 2012.
[5] Deepika M G, Gautam Nambiar and Rajkumar M, Forecasting price and analysing factors in-fluencing the price of gold using ARIMA model and multiple regression analysis,International Journal of Research in Management, Economics and Commerce, 2(11) : Nov 2012.
[6] Lazim Abdullah, ARIMA model for gold bullion coin selling prices forecasting,International Journal of Advances in Applied Sciences, 1(4) : 153-158, 2012.
[7] Trian Hendro Asmoro, Exploring Gold Equivalency for forecasting steel prices on Pipeline projects, 2(5) : 1-22, May 2013.
[8] Dr. M. Massarrat Ali Khan, Forecasting of Gold Prices (Box Jenkins Approach),International Journal of Emerging Technology and Advanced Engineering, 3(3) : 2013.
[9] Bai Li, Research on WNN Modelling for Gold Price Forecasting Based on Improved Artifi-cial Bee Colony Algorithm, Hindawi Publishing Corporation Computational Intelligence and Neuroscience Vol. 2014, pp. 1-10, 2014.
[10] Fengyi Zhang and Zhigao Liao, Gold price forecasting based on RBF neural network and hybrid fuzzy clustering algorithm, Proceedings of the seventh International Conference on Mangement Science and Engineering Management, Lecture Notes in Electrical Engineering, Vol. 1, pp. 73-84, 2014.
[11] Hossein Mombeini and Abdolreza Yazdani-Chamzini, Modeling Gold price via Artificial Neural Network, Journal of Economics, Business and Management, 3(7) : 2015.
[12] Guang-Bin Huang, Lei Chen, Chee-Kheong Siew, Universal Approximation Using Incre-mental Networks with Random Hidden Computational Nodes IEEE Transactions on Neural Networks, 17(4) : 879-892, 2006.
[13] Guang-Bin Huang, Qin-Yu Zhu, Chee-Kheong Siew, Extreme Learning Machine: Theory and Applications,Neurocomputing, 70 : 489-501, 2006.
[14] Guang-Bin Huanga, Lei Chena, Convex Incremental Extreme Learning Machine, Neurocom-puting, 70 : 3056-3062, 2007.