Economic impact
of a
Western
sydney
airport
Contents
Foreword 3 Executive Summary 5 Key Findings 7 1 Introduction 8 2 Background 92.1 Profile of Western Sydney 9
2.2 Tourism and Travel activity
in the Western Sydney Region 10
3 Previous studies on aviation capacity
in the Sydney region 12
3.1 Joint Study and technical appendices 12
3.2 Wilton Study 15
3.3 Commonwealth Bank research 16
3.4 Tourism and Transport Forum 17
3.5 ACCC Airport Monitor 17
4 Benchmark analysis of other major airports 17 4.1 Major airports in Australia and New Zealand 17 4.2 Second airports – global examples 19 4.3 Implications for a Western Sydney Airport 19 5 Western Sydney Airport growth scenarios 21
5.1 Overview of scenarios 21
5.2 Scenario development methodology 21
5.3 Scenario 1 projections 23
5.4 Scenario 2 projections 25
5.5 Scenario 3 projections 26
5.6 Aggregate time saving 27
6 Economic impacts 27
6.1 Direct employment 27
6.2 Broader economic impacts 28
References 35
Appendix A : Passenger movement numbers,
market shares and CGE result tables 37
Appendix B : CGE modelling 48
Limitation of our work 51
Report prepared by Deloitte Access Economics for the NSW Business Chamber
Glossary
ABS Australian Bureau of Statistics
ACCC Australian Competition and Consumer Commission
BITRE Bureau of Infrastructure, Transport and Regional Economics
CBA Commonwealth Bank of Australia CGE Computable General Equilibrium DAE Deloitte Access Economics FTE Full Time Equivalent (employment) GA General Aviation
GPA Glasgow Prestwick Airport GRP Gross Regional Product GSP Gross State Product GVA Gross Value Added IVS International Visitor Survey KSA Kingsford Smith Airport LCC Low Cost Carrier NVS National Visitor Survey
PPA Passenger Movements Per Annum ROS Rest Of Sydney
RPT Regular Public Transport
SA2 Statistical Area Level 2 (ABS definition) SAC Sydney Airport Corporation
TRA Tourism Research Australia TTF Tourism and Transport Forum WS Western Sydney
Western Sydney represents one of the fastest growing economies in NSW and Australia. More than one in eleven Australians now call Western Sydney home. However, while its population continues to grow and diversify, Western Sydney faces a dramatic jobs deficit. This jobs deficit affects the economic and social
prosperity of local residents as many are left with no other option but to commute to the Sydney CBD on already congested transport networks to seek out employment opportunities. In 2006, it was estimated that there was a shortfall of over 180,000 jobs in the region and this is expected to increase to over 320,000 jobs by 2036 without significant action.
An airport at Badgerys Creek – the “Black Caviar” of the proposed sites for Sydney’s second airport – would not only help meet Sydney’s burgeoning aviation demand, it would also serve as the catalyst for job creation, investment and economic growth that the region so desperately needs.
The residents of Western Sydney deserve an airport. Despite the population of Western Sydney being greater than that of South Australia and greater than the combined populations of Tasmania, Northern Territory and the Australian Capital Territory, it does not reap the benefits of having the same level of air transport access residents of Adelaide, Hobart, Darwin and Canberra enjoy. The NSW Business Chamber’s Thinking Business program, of which this report forms part, builds on the Chamber’s experience of working with leaders across business and government to bring about change that supports growth, development, jobs and lasting prosperity for NSW.
Leveraging our diverse membership, the program identifies existing or emerging issues that are not being sufficiently addressed in public debate and provides a platform for business to put forward its perspective on how these issues might best be resolved.
The program works through three stages; we identify issues concerning our members; we investigate how
they might best be addressed; and we act on their behalf across government and industry to resolve these problems and build a better environment in which to operate businesses.
This report demonstrates that Western Sydney would benefit immensely from having a local airport – an airport operating from 2027 will generate close to an additional 30,000 jobs and $9 billion in economic output for Western Sydney by 2050. These jobs and economic effects will be spread across the Western Sydney region as the airport grows.
Western Sydney businesses and residents cannot afford more delay and uncertainty surrounding this issue. We need bipartisan support for an airport at Badgerys Creek from all tiers of government, and we need to start planning for an airport now given construction lead times. We thank Deloitte Access Economics for preparing this report as well as the members of the expert Steering Group who provided valuable input to ensure the modelling undertaken was based on realistic growth scenarios for a Western Sydney Airport. We also thank the local Chambers, businesses, community groups and civic leaders who have been encouraging the Chamber’s pursuit of this issue thus far. We will continue to put the case forward for this essential piece of infrastructure to government decision makers to ensure that it is delivered for the benefit of both Western Sydney and NSW.
Stephen Cartwright
CEO, NSW Business Chamber
David Borger
Director, Western Sydney, Sydney Business Chamber
Stephen Cartwright
CEO, NSW Business Chamber
David Borger
Director Western Sydney, Sydney Business Chamber
Foreword
Executive Summary
The development of a second Sydney passenger airport has been a long running issue. Past government policy has alternated between further capacity at Kingsford Smith Airport (KSA), expansion of existing general aviation airports and the development of a greenfield site. Over the past few decades, there have been a number of studies commissioned on future aviation capacity, culminating in
the Joint Study on Aviation Capacity in the Sydney Region
released in March 2012. The conclusion of the Joint Study was that a second major airport facility will be required and that immediate steps should be taken to mitigate the long lead time of such a development. This view is broadly unanimous among the aviation and tourism industries. The Joint Study identified the Badgerys Creek site in Western Sydney as the preferred option for a second Sydney airport.
This report examines the economic impact of the development of a Western Sydney Airport (WSA) at Badgerys Creek on the Western Sydney and broader Sydney region, under three potential growth scenarios. The sources of economic impact include capital expenditure during construction and expansion, additional visitor expenditure, additional freight activity and time saved in surface travel by passengers electing to use the WSA.
The Western Sydney region
Western Sydney has both a lot to offer, and a lot to gain from a second Regular Public Transport (RPT) facility at Badgerys Creek. It is a dynamic, multicultural region: historical population growth from 2001-2011 was double the rest of NSW and it has a higher proportion of residents born overseas. It has a number of key industries that depend on air transport services based in the area. While aviation-dependent industry sectors are typically
underrepresented in the Western Sydney region, significant numbers of employees living in Western Sydney commute to other parts of the city to work in these industries. Hence, it is foreseeable that a WSA would trigger regional growth in these industries, given the availability of land, labour and key transport linkages. In some cases, this process has already begun: the Transport, Postal and Warehousing sector saw the largest absolute growth of any industry in Western Sydney between 2009-10 and 2010-11, with an additional $411.6 million in gross regional product generated.
Western Sydney currently represents around a quarter of the domestic aviation demand inbound and outbound from the greater Sydney region. The equivalent figure for international travel is 22%. Western Sydney’s shares have
grown significantly over the past eight years and this trend is projected to continue in line with population, which is expected to reach 2.96 million by 20361. Interestingly,
business travel is the most common reason for domestic air travel into and out of Western Sydney, closely followed by visiting friends and relatives, and holidaymaking.
Views on existing capacity in the Sydney basin The Joint Study forms the primary basis of existing literature on future aviation capacity in the Sydney region. It estimates that from 2027, there is likely to be large-scale capacity issues at KSA, due to the significant growth of demand in both international and domestic aircraft movements. However, there are a number of contrasting views on the issue:
• Commonwealth Bank research determined KSA will reach capacity in 2025.
• The Sydney Airport Corporation released a statement arguing that there will be ample capacity to meet forecast demand to 2045.
• The Tourism and Transport Forum (TTF) released a report in January 2013 placing the need for a new airport by 2035. This is in line with the current Sydney Airport master plan forecasts.
One point raised by the Joint Study and reiterated by TTF is that planning for a second RPT facility in the Sydney Basin should commence within the next 12 months.
Scenario development
Three scenarios depicting the expansion of a WSA have been developed, each based on a phased expansion profile. Each scenario is designed to reflect a different growth outcome:
• Scenario 1 depicts the WSA expanding only as required to accommodate the unmet demand for a constrained KSA, as forecast in the Joint Study.
• Scenario 2 allows for demand growth additional to that forecast by the Joint Study, between 5-20 per cent, dependent on the type of traveller. Consequently, the airport’s growth profile is accelerated relative to the baseline.
• Scenario 3 explores the possibility of a greater degree of freight activity in the earlier stages of the airport, with the same passenger movement numbers as Scenario 2. In addition to the three fully worked scenarios, three sensitivities were estimated. Two of these are upper and lower bounds for the timing of maximum capacity at Kingsford Smith, based on Scenario 1. The final sensitivity is based on passenger volumes at Badgerys Creek presented in the recently released Wilton Study. The modelling assumes construction of the airport commencing in 2020 and operations commencing in 2027.
Passenger flows to both the WSA and KSA have been modelled using an airport patronage model based on a framework used in the Joint Study, while average visitor expenditures were estimated based on International and National Visitor Survey data. Airfreight tonnage was estimated as a ratio of passenger movements, reflecting the large proportion carried by belly hold. Some variability of freight intensity was incorporated into Scenario 3. These inputs, along with a measure of total time saved in surface travel, form the inputs to economy-wide, Computable General Equilibrium (CGE) modelling.
Economic impacts of a Western Sydney Airport Chart i compares the increase in gross economic value added from the WSA under the three scenarios modelled. All scenarios show a large increase in the Airport’s economic contribution over time, with the 2050 figures ranging from $11.6 billion in gross regional product under Scenario 1 to $15.2 billion under Scenario 3. Western Sydney gains the larger share of additional economic value relative to the rest of Sydney.
Chart i: Scenario results – Additional Gross Regional Product generated by a Western Sydney Airport
Scenario 1 Scenario 2 Scenario 3 0 2 4 6 8 10 12 14 16 18 2030 2040 2050 2030 2040 2050 2030 2040 2050 Billions
Western Sydney Rest of Sydney
Source: DAE analysis. Dark colours represent Western Sydney, light colours represent Rest of Sydney.
These trends are reflected in the comparison of results of additional Full Time Equivalent (FTE) employment in both regions, as shown in Chart ii. By 2050, additional
employment generated by the WSA is estimated to range from 35,216 jobs under Scenario 1 to 46,285 jobs under Scenario 3. Construction employment is expected to peak at 1,529 jobs during the third phase of expansion. The expansion phase level of construction activity is expected to be larger than the initial development, as the activity will be concentrated over a shorter period of time.
Chart ii: Scenario Results – Additional FTE employment generated by a Western Sydney Airport
Scenario 1 Scenario 2 Scenario 3 0 5 10 15 20 25 30 35 40 45 50 2030 2040 2050 2030 2040 2050 2030 2040 2050 Thousands
Western Sydney Rest of Sydney
Source: DAE analysis.
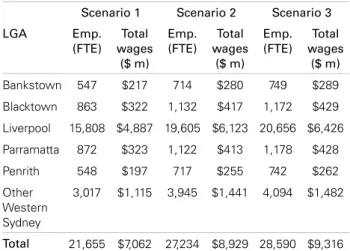
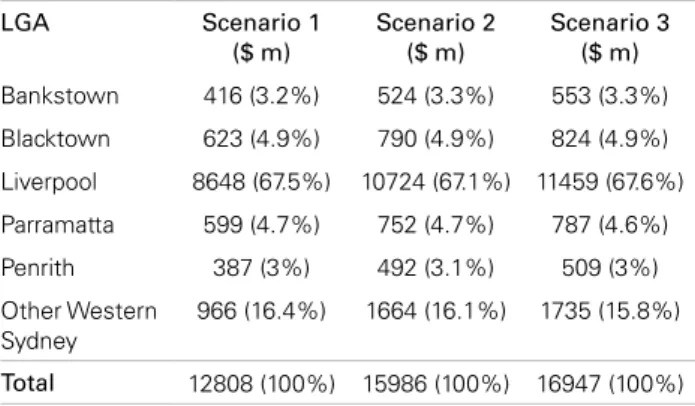
At the sub-regional level, the Liverpool local government area (LGA), which incorporates the Badgerys Creek site, will receive a significant portion of direct airport
employment, estimated at between 16,251 and 20,013 FTE positions in 2050. Aside from Liverpool, the most significant beneficiaries from a WSA are Blacktown LGA and Parramatta LGA, which will receive a $623 million and $599 million increase in gross output, respectively. Besides these primary subregions, the aggregate wage income will be fairly evenly spread, with the top five LGAs in Western Sydney receiving more than $200 million in additional aggregate wage income by 2050. This wage income includes the incremental increase in wages for existing jobs, relative to business as usual.
From a Western Sydney industry perspective, predictably the Air Transport sector is anticipated to benefit most from the WSA, growing to $6.4 billion. Aside from this, the Business Services sector (including car hire, travel agency services, etc.) will see an additional $1.7 billion in output, as well as an additional 1,312 small and 101 medium businesses. Other major beneficiaries include the Communication, Finance and Investment and Manufacturing sectors.
Summary of findings
The analysis presented in this report demonstrates that a second Sydney airport located in Western Sydney would generate significant economic benefits for the region, providing a major economic boost to Western Sydney’s local economies and indeed to the state of New South Wales more broadly. The impacts stem both from alleviating pending capacity constraints in the Sydney basin and from the productivity and competitiveness gains that a second airport located in Western Sydney would generate. While the industries and sub-regions to benefit most significantly would be those with strong links to the air transport sector, invariably the economic impacts would be dispersed widely.
The overall scale of the airport’s economic impacts is most evident when the cumulative benefits are considered. In net present value terms, the impact on the Western Sydney economy over the period 2020 to 2050 is estimated at between $9.2 billion and $15.6 billion, while the impact on the whole of Sydney economy is estimated at between $15.7 billion and $25.6 billion. These impacts are particularly large given that no activity will occur for the next seven years. Average additional employment over the period 2020 to 2050 is estimated at between 12,645 and 19,982 FTE for Western Sydney, and between 20,601 and 31,736 FTE for the Sydney region overall, bearing in mind that most of the additional employment will be generated in the latter part of the modelling period.
However, the realisation of these benefits – or, to put it another way, the avoidance of costs emanating from capacity constraints in the Sydney basin – requires haste on the part of policymakers. As the Joint Study points out, the planning phase for a greenfield airport development is between 6-12 years. This is exclusive of actual airport construction. The modelling undertaken here assumes that airport construction commences in 2020. In order to have an operational airport to absorb unmet demand at KSA, the remaining 7 years before construction would need to be used for necessary planning and technical studies. Hence, in the interests of the continued economic development of Sydney – and indeed Australia – policymakers should consider the decision to commission a site for a second airport a matter of priority.
Key Findings
A second Sydney Airport located at Badgerys Creek in Western Sydney would generate considerable economic benefits for the region and to the State of New South Wales more broadly. The Western Sydney Airport (WSA) will facilitate a significant volume of international visitors to Australia, as well as domestic visitors to the Sydney region. This will occur through direct movements at the new airport, as well as the relief of capacity constraints at Kingsford Smith Airport (KSA):
• Under Scenario 1: 6.1 million international and 20.9 million domestic passenger movements in the year 2050.
• Under Scenarios 2 and 3: 9.1 million international and
24.0 million domestic passenger movements in the year 2050.
Besides passengers, WSA will facilitate airfreight tonnage that would not have otherwise been transported through a constrained KSA:
• Under Scenario 1: 487.5 kilo-tonnes in the year 2050. • Under Scenario 2: 600.3 kilo-tonnes in the year 2050. • Under Scenario 3: 667.9 kilo-tonnes in the year 2050. The combination of additional tourism expenditure, freight tonnage and reduced surface travel will have a pronounced effect on the output of the broader regional economy in 2050:
• Under Scenario 1: $6.6 billion in Western Sydney,
$11.6 billion in Greater Sydney.
• Under Scenario 2: $8.2 billion in Western Sydney,
$14.7 billion in Greater Sydney.
• Under Scenario 3: $8.7 billion in Western Sydney,
$15.3 billion in Greater Sydney.
The net present value (NPV) of these economic impacts to the year 2050 ranges between $15.7 and $25.6 billion in today’s terms. Table ii gives the economic impact of the airport in 2050, disaggregated across the regions within Western Sydney, based on current industry profiles. A WSA will generate and facilitate employment in Western Sydney and across Sydney more broadly. Table i shows the number of new jobs that will be created through construction of the airport, direct airport employment and through wider employment generated across the region.
Table i: Overall employment figures
Construction Employment Phase 1
(2020-27) Phase 2 (2032-33) Phase 3 (2037-40) Scenario 1 269 369 1,177 Scenarios 2 and 3 269 369 1,529
Direct Airport Employment 2030 2040 2050
Scenario 1 1,280 7,625 16,251
Scenarios 2 and 3 1,628 13,462 20,013
Total Employment 2030 2040 2050
Scenario 1 - Western Sydney 1,940 12,249 21,655 Scenario 1 - Total Sydney 3,181 19,928 35,216 Scenario 2 - Western Sydney 3,062 21,158 27,234 Scenario 2 - Total Sydney 4,671 35,225 44,766 Scenario 3 - Western Sydney 5,553 22,257 28,590 Scenario 3 - Total Sydney 7,411 36,430 46,285
Source: DAE analysis. Note Construction and direct airport
employment are measured in gross terms and are calculated outside the computable general equilibrium model. The timing of expansions under Scenarios 2 and 3 are brought forward three years.
Table ii: Localised effects
(employment and aggregate wages) - 2050
Scenario 1 Scenario 2 Scenario 3 LGA Emp. (FTE)
Total wages ($ m) Emp. (FTE) Total wages ($ m) Emp. (FTE) Total wages ($ m) Bankstown 547 $217 714 $280 749 $289 Blacktown 863 $322 1,132 $417 1,172 $429 Liverpool 15,808 $4,887 19,605 $6,123 20,656 $6,426 Parramatta 872 $323 1,122 $413 1,178 $428 Penrith 548 $197 717 $255 742 $262 Other Western Sydney 3,017 $1,115 3,945 $1,441 4,094 $1,482 Total 21,655 $7,062 27,234 $8,929 28,590 $9,316
Source: DAE analysis. Aggregate wages are in 2013 dollars.
1 Introduction
Planning for future growth of aviation demand in the Sydney region has been a long running debate – committees at the state and federal level have been examining the issue since the 1970s. In that time government policy has alternated between developing a second Regular Public Transport (RPT) Facility, and further expansion of capacity at Kingsford Smith Airport (KSA): • An intergovernmental group was set up in 1977 to
study the major airport needs of Sydney.
• In 1986 land at Badgerys Creek was purchased with the purpose of building a ‘Sydney-West’ airport.
• In 1994 the third runway at KSA was opened. • In 1999 an Environmental Impact Statement was
completed for the Badgerys Creek site, after an alternative site – at Holsworthy – was ruled out.
• From 2000-2009 several other options were canvassed, including the expansion of Newcastle and Canberra airports to accommodate additional demand from the Sydney region.
More recently, The Joint Study on aviation capacity in the
Sydney region was released in March 2012. The study was
commissioned to consider the short and long term aviation infrastructure needs of the Sydney Region. It determined that from 2027, there is likely to be capacity issues at KSA leading to unmet aviation demand. The NSW Business Chamber, which commissioned this study, represents the interests of around 30,000
businesses across NSW, ranging from owner-operators to corporations, and from manufacturers to service providers. In order to continue to advance the discussion regarding the merits of locating Sydney’s second airport at Badgerys Creek, the Chamber has recognised the need to analyse the economic benefits that would be generated for the region, its residents and businesses and for the local, state and national economy more broadly.
On this basis, Deloitte Access Economics was engaged to conduct a scenario-driven analysis of the potential economic benefits that a Badgerys Creek-based WSA would generate. The approach employed by Deloitte Access Economics has drawn together the findings of the existing research on the impacts of a WSA; the views of a steering group comprising local business and industry leaders; and economic modelling underpinned by Deloitte Access Economics’ in-house computable general
equilibrium (CGE) model.
Objectives of the analysis
The overarching objective of this report – and the analysis underpinning it – is to demonstrate the nature and magnitude of growth and benefit opportunities that a second airport based in Western Sydney would generate for the region. Specifically, the report estimates the regional impact for Western Sydney, in terms of gross economic value added and additional full-time equivalent employment. These headline economic findings are supported by qualitative analysis around the industries that will likely benefit most significantly from a second airport in the region.
Report structure
The structure of this report is as follows:
• Chapter 2 – overviews the economic and social profile of Western Sydney, as well as current tourism and travel demand into and out of the region.
• Chapter 3 – summarises the previous literature on aviation demand and capacity in the Sydney region. • Chapter 4 – provides a benchmark analysis of major
airports in Australia and New Zealand, as well as selected non-primary airports globally.
• Chapter 5 – outlines the methodology of scenario development and the constructed parameters for each scenario.
• Chapter 6 – presents the outcomes of the economic modelling and the conclusions of the analysis.
• Appendix A – provides additional detail in relation to the passenger movement figures for the WSA under the modelled scenarios, and tabulated CGE results. • Appendix B – contains details on the CGE modelling
2
Background
This chapter provides a brief overview of the profile of Western Sydney, from a demographic and economic perspective, highlighting those industries which would stand to gain from a second RPT facility in Western Sydney. The chapter also provides more general reasoning as to why a second airport at Badgerys Creek would likely become the preferred local airport for individuals and business based in Western Sydney, rather than simply a satellite second airport.
2.1 Profile of Western Sydney 2.1.1 People
Western Sydney2 is a dynamic region: with population
growth of 12% in the decade to 2011, the region out-paced the rest of Sydney and had twice the growth of the rest of NSW (Chart 2.1). In 2011, the population of Western Sydney was just over 2 million and by 2036 it is forecast to reach 3 million, according to the NSW Department of Planning and Infrastructure projections. This represents 70% of the population increase across Sydney more broadly, much of which is due to the significant land releases expected for the region.
Chart 2.1: Percentage Change in population 2011-2036
0% 2% 4% 6% 8% 10% 12% 14%
Western Sydney Rest of Sydney Rest of NSW
Source: ABS Census Data.
Western Sydney has a diverse population base, with a greater proportion of residents born outside Australia than both other parts of Sydney and other parts of NSW (the latter being considerably more pronounced). The source of this migration has largely been South Asia and the Middle East. In contrast, while the rest of Sydney also has a relatively large proportion of people born outside of Australia, these are predominantly from Europe. For both regions, the migrant share of the local population has grown over the past two census intervals. This has
important implications for the international air travel sector – and hence for the Badgerys Creek airport proposal – as 25% of inbound international passengers to Western Sydney cited visiting friends and relatives as their purpose of visit.
Chart 2.2: Percentage population born outside Australia
0% 5% 10% 15% 20% 25% 30% 35% 40% 2001 2006 2011
Western Sydney Greater Syd Rest of NSW
Source: ABS Census Data.
2.1.2 Economy and industry
Overall, industries that are heavily dependent on air transport are largely underrepresented in the Western Sydney region. However, these industries are present in the rest of Sydney, and draw heavily on workers based in Western Sydney. Hence, a second airport located in Western Sydney would likely attract business to Western Sydney, closer to their labour force and air transport linkages. In the draft Sydney metropolitan strategy, the State Government recognised that encouraging this transition was vital to curb a growing jobs deficit in Western Sydney, estimated to reach 300,000 by 20313.
Air transport use by business, in terms of passengers and freight, is highly concentrated in a small number of industry sectors. Indeed, the top five sectors make up over 50% of usage of air transport; the top 10 sectors use two thirds of air transport; and the top 20 sectors make up nearly 80% of usage. The top five users of air transport by ABS Input-Output classification are as follows:
1. Professional, Scientific and Technical Services – 21% 2. Wholesale Trade – 10%
3. Building Cleaning, Pest Control, Administrative and Other Support Services – 9%.
(This includes travel agency and tour operation services) 4. Public Administration and Regulatory Services – 8%.
(This includes foreign government representation) 5. Telecommunication Services – 5%.
2 Western Sydney is defined as the following Local Government Areas: Auburn, Bankstown, Blacktown, Blue Mountains, Camden, Campbelltown, Fairfield, Hawkesbury, Holroyd, Liverpool, Parramatta, Penrith, The Hills Shire, and Wollondilly.
Chart 2.3 indicates that overall, these top five air transport dependent industry sectors are underrepresented in the Western Sydney region. Wholesale Trade is an exception – it is overrepresented in Western Sydney, contributing 7.8% of local output, relative to a 4.8% national average, and 5.8% whole of Sydney average, as shown in Chart 2.3. Wholesale traded goods include basic materials, machinery and equipment, motor vehicles and parts, groceries and liquor/tobacco, textiles, and
pharmaceuticals.
The uplift in transport, logistics and freight forwarding businesses that the wholesale trade sector would rely upon is explored in more detail in Section 5.5, which outlines a more freight-focussed scenario.
Chart 2.3: Gross Regional Product by industry sector
0% 2% 4% 6% 8% 10% 12%
Wholesale Trade Public Administration & Safety
Professional, Scientific & Technical Services Administrative & Support Services Information Media & Telecommunications
Sydney Total Western Sydney Region
Source: RDA Sydney.
While aviation-dependent industry sectors are overall underrepresented in Western Sydney, the region does provide a considerable amount of the labour force for those sectors in the rest of Sydney. For the top five largest air transport users, Western Sydney contributes the following percentages of labour force:
1. Professional, Scientific and Technical Services – 20% 2. Wholesale Trade – 36%
3. Building Cleaning, Pest Control, Administrative and Other Support Services – 36%
4. Public Administration and Regulatory Services – 32% 5. Telecommunication Services – 37%.
These workers would foreseeably be willing to work closer to home, rather than face a lengthy daily commute. Hence prospective businesses looking to take advantage of a new air transport hub at Badgerys Creek should not face labour supply issues. This also applies for existing businesses looking to relocate operations. The creation of an air transport hub at Badgerys Creek would link with other long term surface transport and business precinct projects, as have been identified in the draft metropolitan strategy.
Implications for a Western Sydney Airport
Private and business demand for aviation in
Western Sydney is set to grow considerably in the
next several decades. This will be driven by strong
population growth, as well as the existing wholesale
trade sector, which is a major user of air transport
services. A WSA would gain from this growth, as it
would be the preferred location for aviation activity
for these individuals and businesses. At the same
time, a WSA would augment this growth, providing
a fillip to industry sectors that are major air transport
users, but are currently underrepresented in
Western Sydney.
2.2 Tourism and travel activity in Western Sydney Region
Chart 2.4 shows the breakdown of inbound and outbound passengers to/from Western Sydney (WS) and the Rest of Sydney (ROS), by purpose of visit. This data is from the International and National Visitor’s Survey (IVS and NVS). The trips consist of all outbound and inbound air
passengers to each Statistical Area Level 24 (SA2) defined
as being in Western Sydney, or Rest of Sydney (the remaining area of Greater Sydney as defined by the ABS). Western Sydney is dominated by the rest of Sydney for all trip types, but makes up 29% of domestic trips and 30% of international trips to visit friends and relatives. Interestingly, business is the most common purpose of travel for domestic trips into and out of Western Sydney, noting that outbound passengers may list their home region in Western Sydney, but commence travel from the Rest of Sydney.
Chart 2.4: Travellers to/from Western Sydney and Rest of Sydney – by purpose
Holiday Visiting friends
and relatives Business Other 0 500 1,000 1,500 2,000 2,500 3,000 Thousands
International WS International ROS Domestic WS Domestic ROS
In 2012, 40,000 international and 48,000 domestic air travellers spent at least one night in Western Sydney for the purposes of a holiday. There are several major tourist attractions in Western Sydney, including Featherdale Wildlife Park, Katoomba and the Blue Mountains, as well as Wet n’ Wild due to open in December 2013. These numbers do not count those domestic tourists who travel to Sydney through means other than air transport. A more convenient air travel connection would promote these visitors to the region.
2.2.2 Trend of inbound/outbound travellers in Western Sydney
Over the past decade, Western Sydney has significantly grown its share of aviation activity in the Sydney Region. Chart 2.5 indicates that over a period of modest growth in aviation worldwide, both international and domestic passengers to and from Western Sydney have grown, while equivalent figures for the rest of Sydney have remained steady or declined. The net result is that Western Sydney has grown its share of all domestic traffic from 18% in 2005 to 25% in 2012. The increase in WS share of international traffic has been from 16% in 2005 to 22% in 2012.
Chart 2.5: Travellers to/from Western Sydney and Rest of Sydney – timeline
0 1 2 3 4 5 6 2005 2006 2007 2008 2009 2010 2011 2012 Millions
International WS International ROS Domestic WS Domestic ROS
Source: National/International Visitor Survey Data.
This trend shown in Chart 2.5 is reflected in the comparison between current passenger distributions in Figure 2.1, and projection of passenger numbers in Figure 2.2. The second projection is constructed using the unconstrained growth forecast of aviation demand from the Joint Study (as discussed in section 3.1), and projecting the change in population composition over time using NSW Department of Planning and Infrastructure data.
Growth of major source markets
– China and India
The future demand for aviation in the Sydney
region is dependent on international visitor growth:
two key growth markets are Indian and Chinese
visitors. The Indian market now ranks tenth for
NSW international arrivals, but is sixth in terms
of its share of NSW visitor nights. Although still
developing off a base of about 70,000 visitor nights
per annum, Indian visitors have the longest average
length of stay in NSW (47.8 nights).
The Tourism Forecasting Council (TFC) expects
inbound tourism to Australia from China to increase
at an annual average growth rate of 7.2% over the
period to 2020. Indian visitor arrivals are expected
to increase at an annual average growth rate of
8.5% - the highest of all inbound markets. Given the
large proportion of Western Sydney residents born
overseas, as shown in Chart 2.2, and the Western
Sydney share of arrivals to visit friends and relatives
(VFR) shown in Chart 2.4, the growth in Indian and
Chinese visitor arrivals will be reflected in passenger
volumes into Western Sydney.
The composition of outbound international and domestic passenger numbers, as well as inbound passengers visiting friends and family, is assumed to change proportionally with population changes. The percentage composition of inbound passengers with other purposes of visit (i.e. Holiday, Business or Other) is assumed to remain constant over the projection5. Figure 2.1 and
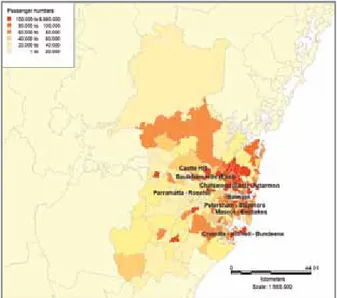
Figure 2.2 provide a visual projection of the growth in aviation demand in Sydney overall for the next 40 years, as well as the ‘westward shift’ in aviation activity, depicted by the darker shades of red in western SA2’s in 2050 relative to 2013.
Figure 2.1: Distribution of aviation demand in 2013
Figure 2.2: Distribution of aviation demand in 2050
3 Previous studies on
aviation capacity in the
Sydney region
This chapter examines the main existing literature on future aviation capacity in the Sydney region. The analysis draws on a number of sources, including intergovernmental panels, as in the Joint Study; regulatory bodies, as in the ACCC; industry bodies, such as the Transport and Tourism Forum; and private investors; such as the Commonwealth Bank of Australia.
3.1 Joint Study and technical appendices
The Joint Study on aviation capacity in the Sydney region
was provided to the Federal and NSW Governments and publicly released in March 2012. It is seen as the definitive work on examining the options for addressing Sydney’s future aviation needs. It examines the current and future demand for aviation in the Sydney region, the capacity of existing airports to meet this demand, the impacts if this demand is not met, and options to develop new infrastructure. The headline findings of the report were that from 2027 there is likely to be growing unmet demand for aviation and the Badgerys Creek site is the best candidate for a new RPT facility from a cost-benefit perspective.
3.1.1 Current and future demand for aviation in the Sydney region
As part of the assessment of aviation capacity in the Sydney region, the Joint Study describes the current and future demand for aviation capacity in considerable detail. The sections relevant to this analysis are chapter 3, and appendix A2 and A3.
Chapter 3 of the Joint Study includes discussion of headline KSA traffic figures as at 2010:
• KSA handled 35.7 million passenger movements, and 286,600 aircraft movements;
• Around 80% of KSA’s half millions tonnes of freight was international; and
• The majority of freight was belly hold: 70% of international inbound, 80% of international outbound, and 75% of domestic.
The IVS/NVS data in Appendix A2 is consistent with that presented in Section 2.2 of this report. The other particularly relevant information is the mode of surface transport passengers use to access KSA: over 84% use some form of road travel, with the remaining 16% taking public transport, which may be a bus or train. 94% of meeters & greeters and 79% of KSA employees take a private car.
The forecasts in Appendix A3 maintain an average growth in passenger movements in the Sydney region of 2.9% per year to 2060, yielding the following totals:
• 17.9 million international and 32.7 million domestic movements in 2020;
• 29.7 million international and 47.1 million domestic movements in 2035; and
• 62.7 million international and 82.9 million domestic movements in 2060.
These estimates are given in Chart 3.1. These considerations are relevant to understand the current demand profile at KSA, and how this profile will grow over time, absent any capacity restrictions. The surface access data is important to model the generalised costs of surface travel to a WSA.
Chart 3.1: Unconstrained demand for aviation at Kingsford Smith Airport 0 20 40 60 80 100 120 140 160 2010 2015 2020 2025 2030 2035 2040 2045 2050 2055 2060 Domestic & Regional International
Source: Joint Study Appendix A3.
Chart 3.2: Constrained demand for aviation at KSA - with unmet demand ‘wedge’ (million passenger movements pa)
0 20 40 60 80 100 120 140 160 2010 2015 2020 2025 2030 2035 2040 2045 2050 2055 2060 Domestic International Unconstrained
Source: Joint Study Appendix A3.
3.1.2 Accommodating unmet demand at a second RPT airport
From the unmet demand profile quantified in Appendix A3, Appendix C8 goes further to examine how this unmet demand could be accommodated at an additional RPT airport. Chapter 8 examines some of the feasibility issues surrounding placement of a new facility, and Appendix B7 assesses the economic impact of not proceeding with additional aviation capacity in the Sydney region. Appendix C8 developed an airport patronage model, disaggregated into domestic/international and business/ domestic classifications, and assessing demand from each Statistical Area (2) (SA2). Using this model, four scenarios were developed, to assess the effect of establishing a second airport of different capacities on the level of unmet demand. The location of the new RPT airport within these scenarios was at the military airport facility RAAF Richmond. For each level of capacity, the competitive dynamics between a new airport and KSA were determined, based on the relative overlap of airport catchments, and the scalability of the second airport site. Along with benchmark data from other second airports worldwide, the competitive analysis was drawn together to form a logistic demand curve for each level capacity. These are shown in Chart 3.3.
Using IVS/NVS data on visitor trips to and from each Statistical Local Area (SLA) by purpose of visit, the passenger demand for the second airport could be forecast. The forecast demand for a second RPT facility was then incorporated into the profile of unmet demand, as shown in Chart 3.4. This depicts the second RPT facility absorbing unmet demand over time, until its own capacity is reached, and unmet demand continues to grow again. Finally, Chart 3.5 compares the point at which each scenario would reach maximum capacity, as a precursor to the concept of phased expansion.
Chart 3.3: Joint Study Appendix C8 Airport patronage model demand functions
0 10 20 40 50 60 80 90 100
Scenario 1 Scenario 2 Scenario 3 Scenario 4 70
30
Market Share of Alternative (%)
Cost Alternative/Cost KSA (%) 100 100%
50%
Chart 3.4: Joint Study Appendix C8 additional capacity of a second RPT airport 0.0 1.3 1.4 1.5
Passenger Movements Millions
Year 1.1 1.0 0.9 0.8 0.7 0.6 0.5 0.4 0.3 0.2 1.2 0.1 1.6 2010 2015 2020 2025 2030 2035 2040 2045 2050 2055 2060 KSA 2nd RPT Facility Unmet Demand
Source: Joint Study Appendix C8.
Chart 3.5: Joint Study Appendix C8 – additional capacity scenarios
0 55
40
5
Passenger Millions p.a.
Year 2010 2015 2020 2025 2030 2035 2040 2045 2050 2055 2060 Scenario 1 Scenario 2 35 30 25 20 15 10 45 50 Scenario 3 Scenario 4 Unmet Demand Any capacity brought on at Richmond above the unmet demand line would result in competitive conditions
Scenario 4 demand at Richmond = unmet demand in 2045 Scenario 3 demand at Richmond = unmet demand in 2040 Scenario 2 demand at Richmond = unmet demand in 2035 Scenario 1 demand at Richmond = unmet demand in 2033
Source: Joint Study Appendix C8.
Appendix C8 also explored the possibility of a second airport increasing the size of the base market itself. This was reflected in a case study of Newcastle Airport, which experienced a high level of growth shortly after Low Cost Carriers (LCC) were introduced, as shown in Chart 3.6. This level of growth was attributed to two factors: • Increased breadth and frequency of routes offered; and • Increased price competition resulting in lower airfares
for passengers.
Both of these factors would lead to a growth of base level aviation demand following the establishment of a WSA.
Chart 3.6: Joint Study Appendix C8 – stimulated demand from LCC entry
0.0 1.3 1.4 1.5
Pax Movement / Seats (millions)
Financial Year 2000 2001 2002 2003 2004 2005 2006 2007 2008 2009 2010 Jetstar entry into Service 1.1 1.0 0.9 0.8 0.7 0.6 0.5 0.4 0.3 0.2 1.2 0.1 1.6 CAGR Seat Capacity Actual Pax CAGR Pax Long term growth - 4% - 1% +32% +8%
Source: Joint Study Appendix C8.
Part eight of the Joint Study assessed the best localities within a 90 minute radius of the major Sydney population for different airport types:
• Type 1: full service airport with runway length up to 4,000 metres, serving all RPT segments, capable of accommodating a future parallel runway layout; • Type 2: land constrained full-service airport serving all
RPT segments, capable of accommodating one runway; • Type 3: limited service airport serving all RPT segments, accommodating a single shorter runway of up to 2,600 metres; and
• Type 4: minimum service airport serving GA and limited RPT.
Within the four airport types, only Types 1 and 3 were investigated to the individual site level. For the Type 1 airport locations examined, Badgerys Creek represented the greatest benefit-cost ratio (2.7), while for the Type 3 locations examined, Badgerys Creek represented the second greatest benefit-cost ratio (1.2). This is consistent with the broader findings of the Joint Study, which evaluate the Badgerys Creek site to be the best candidate for a second RPT airport.
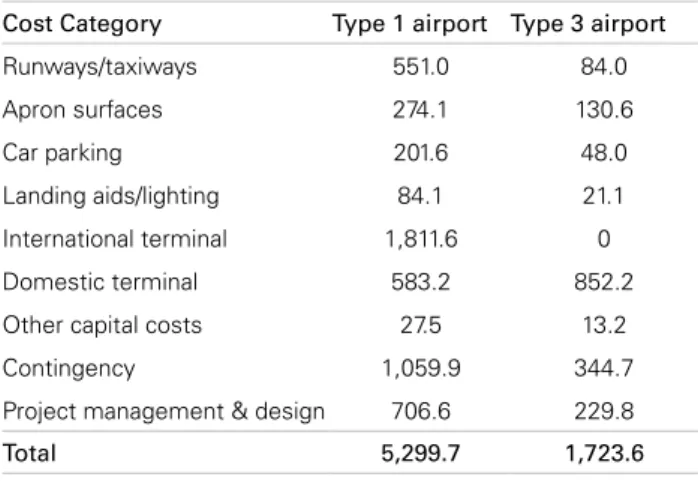
A series of generic capital costs were also outlined for developing a greenfield airport site, as shown in Table 3.1. These are taken in conjunction with specific high-level estimates of earthworks and transport infrastructure connections to the Badgerys Creek site:
• $360 million in earthworks to create an airfield platform; • $190 million for necessary road linkage upgrades; and • $1130 million for dedicated rail connections.
Based on technical analysis from Worley Parsons and others, the Joint Study estimated that timing for the planning of a greenfield site, including site location confirmation, environmental impact statements, public consultation, planning and rezoning, and preliminary design would range between 6 and 12 years. This is exclusive of actual construction.
These estimates of project timing and capital
expenditure provide an instructive guide for the
CAPEX component of this analysis and highlight
the need for measures to be taken as a matter
of urgency, given the long lead times in airport
development.
Table 3.1: Joint Study airport cost breakdown ($m) Cost Category Type 1 airport Type 3 airport
Runways/taxiways 551.0 84.0 Apron surfaces 274.1 130.6 Car parking 201.6 48.0 Landing aids/lighting 84.1 21.1 International terminal 1,811.6 0 Domestic terminal 583.2 852.2
Other capital costs 27.5 13.2
Contingency 1,059.9 344.7
Project management & design 706.6 229.8
Total 5,299.7 1,723.6
Source: Joint Study Part 8.
Appendix B7 assessed the negative economic impact of not investing in additional aviation capacity in the Greater Sydney area. The approach was to measure the impacts in terms of foregone expenditure, value-added (i.e. profits and wages), and FTE employment numbers. The particular avenues of negative economic impact that were
quantified were the following:
• Losses to the tourism and associated industries that attract expenditure from interstate visitors;
• Losses to the freight industry in terms of value of tonnage not flown;
• Passenger welfare lost due to delays and foregone trips, including knock-on effects to other airports;
• Losses to the aviation and airport industries, including landside retail; and
• Losses to hotels and business parks in the airport vicinity.
These losses were input to into the Monash Multi-Regional Forecasting model under three scenarios; high, medium and low. The capital expenditure foregone was modelled as a series of expansions. The modelled indirect state-wide losses for NSW in 2050 are given in Table 3.2.
Table 3.2: NSW economic impact of constrained aviation capacity - 2050
Scenarios: GSP (2010 $m) FTE employment
(‘000 persons)
Low 3,320 7.2
Medium 10,472 26.3
High 24,274 61.5
Source: Joint Study Appendix B7.
Appendix B7 also highlighted a number of qualitative impacts of aviation demand being constrained: • Reputation – Sydney (and NSW/Australia) faces a
reputational risk if world-class aviation linkages cannot be accessed.
• Facilitating regional growth – Sydney acts as a gateway for the rest of New South Wales and Australia, hence regional growth would be jeopardised if aviation transport through Sydney was constrained. • Social impacts – there is a positive social impact of
providing connectivity for family and friends living interstate or overseas, and expanding the choice of transport options available to consumers.
The sources of foregone expenditure and method
of airport infrastructure CAPEX modelling serve to
inform the approach of this analysis. The
economy-wide modelling results provide a benchmark to the
results estimated here - albeit from the alternative
perspective to this.
3.2 Wilton study
The Study of Wilton and RAAF Base Richmond for Civil
Aviation Operations was released by the Federal
Government in May 2013. It was commissioned as a technical scoping study to locate a second airport at Wilton, as well as expanding the use of RAAF Richmond to include RPT capabilities. As part of the study, Booz &
Company were commissioned to model the volume of passenger traffic at Badgerys Creek, along with the other two sites. The same methodology was used as was described in Section 3.1.2 above, confirming this as a suitable approach for the analysis contained in this report. The economic impact of developing a large scale airport, operational by 2025, was modelled by Ernst & Young, following a similar approach used for the technical appendix B7 of the joint study. The passenger volume used for this study was the Booz & Company high capacity Tier 2 modelling scenario (essentially replicating a KSA capacity airport). The projected freight volume is shown in Chart 3.7. While the conditions under which such a growth trajectory would be achieved are debatable, for the purpose of this report, it has been modelled as a sensitivity to the central case results.
Chart 3.7: Ernst & Young modelled passenger volume at Badgerys Creek airport
5 10 15 20 25 30 35 40 2015 2020 2025 2030 2035 2040 2045 2050 Millions
Domestic - Business International - Business International - Leisure Domestic - Leisure
-Source: Ernst & Young Economic and social analysis of potential airport sites, 2013.
This update of the Booz & Company work from the
Joint Study in the context of Wilton consolidates
their methodology of estimating airport patronage,
which is adopted for this analysis. It also
underscores that the forecasts of constrained and
unconstrained demand used in the Joint Study are
the best references currently available.
The economic impact of a large scale airport coming
online by 2025 is significantly different to the
scenarios modelled here, but nevertheless serves
as an upper bound comparator to this analysis.
3.3 Commonwealth Bank research
The Commonwealth Bank of Australia (CBA) released a research report in January 2013, titled Sydney versus the
World, examining the capacity and utilisation of KSA. It
benchmarks the capacity utilisation of KSA against the 30 largest airports in the world by passenger movements. The research identifies Beijing Airport as the most efficient in terms of capacity utilisation, representing a 61% improvement on KSA’s current utilisation rate. The same utilisation of KSA capacity would give a capacity of 59 million passenger movements per annum. Chart 3.8, taken from the CBA report, compares unconstrained passenger volume forecasts for KSA. With the exception of the Sydney Airport Corporation, the forecasts are very similar for the first 30 years. These forecasts suggest that if KSA was able to match Beijing Airport’s utilisation, then it would have sufficient capacity to meet forecast demand until 2025.
Chart 3.8: CBA research – comparison of KSA unconstrained demand estimates
Actual Joint Study 30m 20m 2004 40m 50m 60m 70m 80m 2006 2008 2010 2012 2014 2016 2018 2020 2022 2024 2026 2028 2030 2032 2034 2009 SACL Master Plan
BITRE 2012 CBAf
Source: CBA Equity Research Report Sydney versus the world.
Sydney Airport Corporation (SAC) issued a media release in response to the CBA research, contesting some of the assumptions used. In particular, the CBA analysis assumes no large-scale capacity expansion (e.g. gates, terminals, runways), which disregards the $2 billion spent over the past 10 years. By contrast, the SAC argues that there is ‘ample capacity to meet forecast demand to at least 2045’.
This research provides a useful comparison of recent
passenger movement forecasts and verifies that the
2010 Joint Study forecast is tracking well against
actual data and more recent forecasting efforts.
3.4 Tourism and Transport Forum
The Tourism and Transport Forum (TTF) released a report in January 2013 titled Sydney’s Aviation Future – Meeting
the Challenge of Growing Demand. The TTF is an industry
body representing the tourism, transport and aviation sectors. The report concurs with the broad findings of the Joint Study; however, it places a greater focus on the need for reform of curfews, slot and movement caps, as well as noise sharing agreements at KSA. The report states that these place “artificial constraints” on airport capacity, and do not reflect the safety and noise reduction of modern aircraft. The report also suggests that other general aviation and military airports may be better utilised, for peripheral aviation activity, such as dedicated freight and business/charter flights.
Importantly, the report endorses the Joint Study finding that there is a longer term requirement for a second RPT airport in the Sydney Region, and confirms Badgerys Creek as the most suitable location. It also suggests that planning and technical design of the new airport should commence in the next 12 months. However, it defers the need for a new WSA out to 2035; eight years later than the Joint Study. These findings are consistent with the recently released 2013 Sydney Airport draft Master Plan, which projects demand in 2033 to be 74 million passenger movements, in line with unconstrained forecasts shown in Chart 3.8.
The divergence of findings in relation to the timing
and extent of capacity constraints at KSA, and the
growth that a second Sydney site would achieve,
highlights the uncertainty inherent to this issue
and provides the basis for including variation in the
scenarios modelled in this study.
3.5 ACCC Airport monitor
In April 2013, the Australian Competition and Consumer Commission (ACCC) released their annual monitoring report of the quality, prices, costs and profits of the five largest capital city airports in Australia; Adelaide, Brisbane, Melbourne, Perth and Sydney. The role of the ACCC in this context is one of monitoring only – it does not enforce price restrictions or minimum quality standards. The report included several key findings on the profitability and quality of service provided at KSA: • KSA reported the highest aeronautical margins and
revenue of the five airports monitored for the year to June 2012;
• KSA also recorded the highest revenue and margin of car park spaces, as well as the largest increase in general landside revenues; and
• Of the five airports, KSA had the lowest quality of service based on the survey responses from passengers and airlines. Part of the drop in quality of service was due to the increasing issue of congestion at KSA, increasing the frequency and duration of delays.
To a certain extent, these results are an indication
of the inherent restrictions of the Mascot airport
site, rather than the performance of Sydney Airport
Corporation. Either way, the findings suggest
aviation users and airlines would benefit from a
second airport, through less restricted landside
access.
4 Benchmark analysis
of other major airports
Benchmarking analysis is an important element in developing a picture of the growth path of a WSA, as well as the capital expenditure during subsequent expansions of the airport. Other Australian and New Zealand airports provide instructive comparators, as they have similar mixes of international/domestic travellers, similar capital costs; and employment to passenger movement ratios. In most cases, data is more readily available for local examples than overseas airports. However, there are only two examples of genuine second airports, and there have been no recent greenfield airport developments in Australia or New Zealand. Accordingly, comparisons were sought predominantly in Australia and New Zealand, as well as global examples of recently developedsecondary airports.
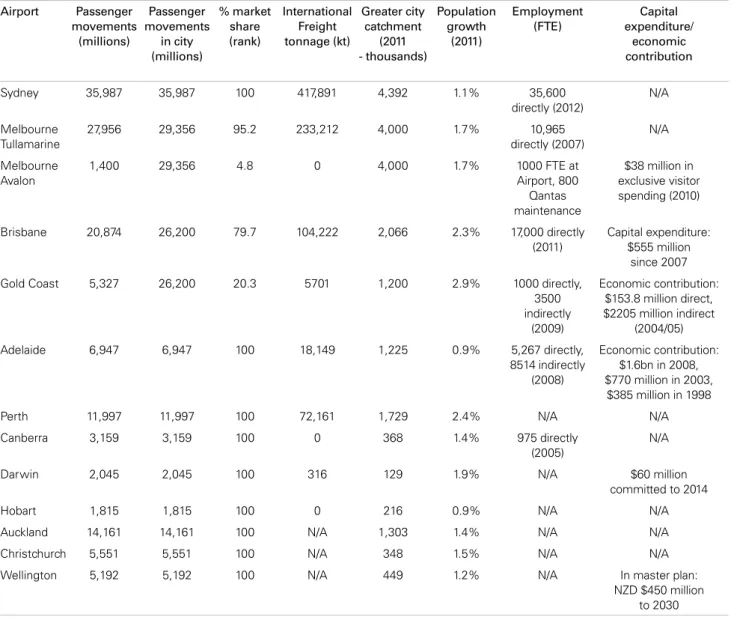
4.1 Major airports in Australia and New Zealand The majority of RPT aviation activity in Australia is located in the capital cities. These are the primary sources of comparison for the WSA. Table 4.2 gives a broad overview of the major airports in Australia and New Zealand, with passenger/freight volume, population and growth of catchments, and any available data on capital expenditure, employment figures, or economic contribution of those airports.
As the second airport for the second largest city in Australia, Avalon is at first glance a strong benchmark comparison for the WSA. However, there are several key differences between Avalon and a potential airport at Badgerys Creek:
• The Avalon RPT facility was not a greenfield development;
• Tullamarine Airport doesn’t have capacity concerns to the same extent as KSA;
• A significantly lower percentage of Melbourne’s population live a shorter distance to Avalon (relative to Tullamarine) than Badgerys Creek (relative to KSA); and • Population growth trends do not favour a transition of
aviation activity to Avalon to the same degree as Badgerys Creek.
In addition, data on Avalon passenger movements is not provided to the Bureau of Infrastructure, Transport and Regional Economics (BITRE) for commercial-in-confidence reasons, making accurate comparisons less feasible.
4.1.1 Gold Coast Airport
Gold Coast Airport is one of the most comparable benchmark airports in Australia, because, after Avalon, it is the only secondary airport in Australia, with its passenger catchment overlapping with Brisbane. On a common market basis, Gold Coast has 20% of the total market share with Brisbane, with 5.3 million passenger movements last year. The airport has undergone a number of major capital works in the past two decades:
• Total of $55 million in capital works from 1998 to 2008; including $25 million runway works in 2007;
• $100 million terminal redevelopment opened in 2010 - more than double its previous size to approximately 28,700 m2, including a common-user terminal adopted
in Adelaide and elsewhere; and
• $8.8 million in runway and tower maintenance in 2011. Chart 4.1 shows a remarkable trend in passenger figures over the past decade; an average growth rate of 14% from 2001-02. This is partly due to the expansion into international operations during that time. This has been reflected in international freight, which has experienced compound average growth of 22% over the four years to June 2012. Chart 4.2 shows the relatively heavy focus on low-cost and hybrid carriers for Gold Coast Airport, specifically Jetstar, Virgin, and Qantas. These two features of strong passenger movement growth and a focus on low cost carriers will likely be reflected in a future WSA.
Chart 4.1: Gold Coast - Long term trend of passenger movements 0 1 2 3 4 5 6 1985-86 1990-91 1995-96 2000-01 2005-06 2010-11 Millions Domestic International
Source: BITRE data.
Chart 4.2: Gold Coast - Weekly one way capacity and frequency share 46.0% 34.6% 10.3% 4.8% 1.1% 1.1% 1.6% 0.5% 47.9% 31.1% 10.1% 4.4% 2.5% 2.5% 1.5% 0.2% 0.0% 10.0% 20.0% 30.0% 40.0% 50.0% 60.0% Jetstar Virgin Australia Tiger Airways Qantas Scoot Airasia X Air New Zealand Airnorth
Capacity Share Frequency Share
4.2 Second airports – global examples
As discussed above, there are few examples of second airports in Australia. After a preliminary examination of 15 non-primary airports in Europe, North America and UK, London Luton and Glasgow Prestwick were identified as relevant examples. These two airports were selected based on the level of market share, pre GFC growth and availability of data. These two examples are chosen to reflect different stages of WSA airport growth, and highlight different aspects of aviation activity (i.e. freight vs. passenger traffic).
4.2.1 London Luton
London Luton airport is located 51km north of central London, hosting 9.6 million passenger movements, or 7% of the total traffic in the region. It competes with four other major London airports: Heathrow (50%), Gatwick (26%), Stanstead (15%) and London City (6%). It is serviced almost exclusively by Low Cost Carriers (LCC’s), 99.5% by frequency. Luton airport represents a small share of the overall freight task – moving 29,600 tonnes of air freight in 2012, or 2% of the total market share. The UK Civil Aviation Authority estimates that the airport has a catchment area of approximately 15 million people, based on the relative location of other airports, and the services they provide. Since purchasing the airport in 1998, the current owners (London Luton Airport Operations Ltd.) have spent £215 million improving and upgrading the airport, including £40 million spent for a new terminal and £23 million on the Luton Airport Parkway Station. London Luton directly employed 516 people as at December 2011.
4.2.2 Glasgow Prestwick
Last year Glasgow Prestwick Airport (GPA) hosted 1.3 million passenger movements, or 13% of market share relative to Glasgow Airport. This level is down from a peak of 2.4 million in 2008-09. It has a smaller catchment area than Luton; two million people live within 60 minutes of the airport. The airport has a significant focus on its airfreight capability, moving 14,000 tonnes of freight in 2011-12, 83% of Glasgow city total. This is partly due to a lack of curfew, meaning goods can land late at night and be transported to London in time for start of business the following day.
A study conducted in 2008 assessed the economic contribution of GPA and the reliance of local businesses on the air transport services that the airport provides. Table 4.1 outlines the Gross Value Added (GVA) and employment figures for the local region and the rest of Scotland. These figures show that even a small airport by passenger movements can be responsible for a significant amount
of economic value employment. As part of the study, survey results showed that 8% reported that they would face major problems without the freight service GPA provides, and 58% of local businesses reported using the airport in the previous year for business trips, with an average of six trips per year.
Table 4.1: Glasgow Prestwick Airport Economic Contribution 2008
Industry Ayrshire Rest of Scotland
GVA (£ million) Employment GVA (£ million) Employment Airport Wages and Salaries 10.6 481 9.5 430 Supply contracts 7.4 164 5.2 117 Tenant, Freight and Aerospace 16.9 470 23.3 678 Passenger Expenditure 13.2 618 40.5 1,717 Total 48.1 1773 78.6 2,941
Source: SQW Consulting. Note that the average AUD/GBP exchange rate in 2008 was 0.45 cents.
4.3 Implications for a Western Sydney Airport With a current airport catchment of 4.4 million, including 2 million in Western Sydney, WSA will attract some market share from KSA, particularly as KSA becomes increasingly capacity constrained. Hence, comparisons can be made against existing airports based on catchment size. The main point of difference for the WSA is the future capacity constraint of KSA. This means it will experience a certain degree of ‘inorganic’ growth as it takes up the future demand that cannot be met at KSA. With WSA growing through a process of phased expansion, benchmark comparisons of growth paths are less instructive than static comparisons between a WSA and existing Australian airports. For instance, the initial phase of operations (3-5 years) of the WSA may resemble Canberra or Darwin airports, then expanding to a similar scale as Gold Coast or Adelaide. Longer term (25 years +) the airport will need to handle significantly more passengers, and so the final stage within each scenario of this analysis may resemble Brisbane or Tullamarine. The economic contribution and employment figures recorded in Table 4.2 can be used to compare final CGE results.
Table 4.2: Comparison of existing airports in Australia and New Zealand Airport Passenger movements (millions) Passenger movements in city (millions) % market share (rank) International Freight tonnage (kt) Greater city catchment (2011 - thousands) Population growth (2011) Employment (FTE) Capital expenditure/ economic contribution Sydney 35,987 35,987 100 417,891 4,392 1.1% 35,600 directly (2012) N/A Melbourne Tullamarine 27,956 29,356 95.2 233,212 4,000 1.7% 10,965 directly (2007) N/A Melbourne Avalon 1,400 29,356 4.8 0 4,000 1.7% 1000 FTE at Airport, 800 Qantas maintenance $38 million in exclusive visitor spending (2010) Brisbane 20,874 26,200 79.7 104,222 2,066 2.3% 17,000 directly (2011) Capital expenditure: $555 million since 2007
Gold Coast 5,327 26,200 20.3 5701 1,200 2.9% 1000 directly,
3500 indirectly (2009) Economic contribution: $153.8 million direct, $2205 million indirect (2004/05) Adelaide 6,947 6,947 100 18,149 1,225 0.9% 5,267 directly, 8514 indirectly (2008) Economic contribution: $1.6bn in 2008, $770 million in 2003, $385 million in 1998
Perth 11,997 11,997 100 72,161 1,729 2.4% N/A N/A
Canberra 3,159 3,159 100 0 368 1.4% 975 directly
(2005)
N/A
Darwin 2,045 2,045 100 316 129 1.9% N/A $60 million
committed to 2014
Hobart 1,815 1,815 100 0 216 0.9% N/A N/A
Auckland 14,161 14,161 100 N/A 1,303 1.4% N/A N/A
Christchurch 5,551 5,551 100 N/A 348 1.5% N/A N/A
Wellington 5,192 5,192 100 N/A 449 1.2% N/A In master plan:
NZD $450 million to 2030
Note: (Freight tonnage is international only – this is the majority of freight on a national average basis. Data is not available for local freight.). Sydney airport market share excludes Newcastle, Canberra, and local general aviation traffic. As Melbourne’s second airport, Avalon’s catchment was based on greater Melbourne, but could include Geelong, an additional 210,000 persons. New Zealand airport statistics are based on the 2006 census. Gold Coast catchment data was from the 2012 Annual Report, not census data. Sources: ABS Census, BITRE, Statistics New Zealand,Airport Master plans and holding company annual reports.
5 WSA Growth scenarios
This chapter outlines the methodology of scenario development, drawing on the existing literature discussed in Chapter 3 and the benchmark analysis summarised in Chapter 4. The scenarios are presented in turn, with some rationale of the issues each of them is designed to explore.5.1 Overview of scenarios
To address the range of possible future growth outcomes for the WSA, three different growth scenarios were analysed. Each scenario is designed to reflect a different growth outcome:
• Scenario 1 depicts the WSA expanding only as required to accommodate the unmet demand for a constrained KSA, as forecast in the Joint Study.
• Scenario 2 allows for demand growth additional to that forecast by the Joint Study, between 5-20 per cent, dependent on the type of traveller. It is assumed that this additional growth is spurred by residents and businesses taking advantage of the opportunities that improved air access and lower costs of air travel generates. Consequently, the growth profile for the airport is accelerated relative to the baseline.
• Scenario 3 explores the possibility of a greater degree of freight activity in the earlier stages of the airport, with the same passenger movement numbers as Scenario 2.
In addition to the three fully worked scenarios, three sensitivities were estimated. Two of these are bounds for the timing of maximum capacity at KSA, based on Scenario 1. The final sensitivity is based on passenger volume numbers at Badgerys Creek developed during the Wilton Study.
5.2 Scenario development methodology
The economic impact measured using CGE modelling is based on a series of economic ‘shocks’ that describe the additional visitor expenditure, freight tonnage and time saved by aviation users in each scenario. These economic shocks were developed by the following process:
1. Determining the profile of the ‘wedge’ of unmet demand, as described in Chapter 3;
2. Developing a phased expansion of capacity at a WSA that will accommodate this unmet demand;
3. Modelling passenger flows from locations in Sydney and Western Sydney using an airport patronage model based on the framework in Appendix C8 of the Joint Study;
4. Forecasting average expenditures for inbound visitors, both international and domestic passengers; and 5. Determining the additional visitor and freight
expenditure that will be generated, along with aggregate time saved.
5.2.1 Unmet demand profiles
The profile of unmet demand motivates the requirement for a WSA, and informs the growth path of capacity. It is the difference between the unconstrained and constrained demand forecasts. In all scenarios, the unconstrained forecast used is from the Joint Study – the discussion in Sections 3.1.1 and 3.1.2 determines that the Joint Study forecast is best suited for this analysis, as it includes the full window of this analysis, and is broadly consistent with other forecasts. For each of the scenarios, the constrained demand forecast is also that one used in the Joint Study. The sensitivity of constraint timing is assessed in Section 6.2.4 as part of the final results.
Chart 5.1: Unmet demand profile – annual passenger movements 0 10 20 30 40 50 60 2015 2020 2025 2030 2035 2040 2045 2050 2055 2060 millions Domestic International
Source: Joint Study Appendix C8.
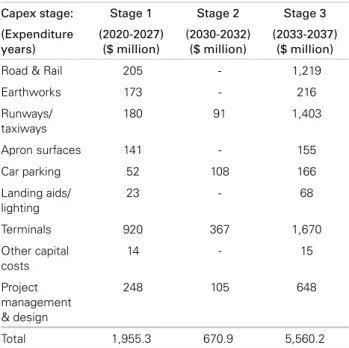
5.2.2 Phased expansion profiles
The unmet demand profiles represent a realistic, if conservative, demand for a WSA. Hence the WSA capacity projections for Scenarios 1, 2 and 3 were designed to accommodate the unmet demand profile, with phases of expansion, rather than continual capacity increases. The model of phased expansion is consistent with benchmark analysis of other airports in Australia and New Zealand, and analysis within Appendix B7 of the Joint Study. Each scenario has three phases of expansion: an initial development of the greenfield site followed by two enlargements. The capital expenditure associated with each phase is taken from benchmark data from other airports discussed in section 4.1, as well as costing estimates in Part 8 of the Joint Study. The timing and magnitude of these expansions are discussed for each scenario in Sections 5.3 to 5.5.