i
Evaluating the Effectiveness of Live Peer Assessment as a Vehicle for The
Development of Higher Order Practice in Computer Science Education
Steve Bennett
School of Computer Science
University of Hertfordshire
Thesis submitted to the University of Hertfordshire in partial fulfilment of the requirements of the degree of Doctor of Philosophy (PhD)
ii
Declaration
I certify that the work submitted is my own and that any material derived or quoted from the published or unpublished work of other persons has been duly acknowledged.
Student Full Name: Steve Bennett Student Registration Number: 00011514
______________________________ Date: 24th April 2017
iii
Acknowledgements
In completing this study, I would first wish to give huge thanks to my supervisor Dr Trevor Barker who encouraged me to enroll for a PhD in the first place, and supported me through the whole process. Through him I could see the bigger picture and concentrate on the things of genuine significance rather than the details I would sometimes get bogged down in. He was also a great colleague to teach with for many years and I hope I have picked up some of the wisdom and congeniality that he has always
demonstrated.
I would also like to give thanks to the University of Hertfordshire generally and particularly my own department of Computer Science. Through the University generally I was lucky enough to participate in the Blended Learning Unit which gave me the time and encouragement to try out new things. There I would particularly like to thank Professor Peter Bullen and David Kraithman for their support.
Then I’d like to thank my own department of Computer Science for giving me a time allowance for this research. Particularly, I’d like to thank colleagues who supported me in different ways along the way. Firstly, I’d like to thank Professor Amanda Jefferies who first invited me onto the Cable (Change Academy for Blended Learning Enhancement) project during the 2009-10 academic year where the practices covered in this thesis were first piloted. The purchase of the first 80 EVS clickers then led directly to this thesis! Secondly I’d like to thank Dr Mariana Lilley for being a supportive colleague on a number of different courses and programs of study where I have been encouraged to try out many different approaches and with whom I have been able to discuss the various issues that came up. Without the anticipation of such support and without an environment in which natural curiosity and experimentation were encouraged I would not have had the ability to try things out to the extent I have. I would also like to thank my parents, and particularly my mother for noticing my academic tendencies in the first place and encouraging them! And finally, I’d like to thank my girlfriend Vanessa for being such a tower of strength during this period of the writing of this thesis and being such a fabulous person to return to after a day in the office.
iv
Abstract
This thesis concerns a longitudinal study of the practice of Live Peer Assessment on two University courses in Computer Science. By Live Peer Assessment I mean a practice of whole-class collective marking using electronic devices of student artefacts demonstrated in a class or lecture theatre with instantaneous aggregated results displayed on screen immediately after each grading decision. This is radically different from historical peer-assessment in universities which has primarily been
asynchronous process of marking of students’ work by small subsets of the cohort (e.g. 1 student artefact is marked by <3 fellow students). Live Peer Assessment takes place in public, is marked by (as far as practically possible) the whole cohort, and results are instantaneous.
This study observes this practice, first on a level 4 course in E-Media Design where students’ main assignment is a multimedia CV (or resume) and secondly on a level 7 course in Multimedia Specification Design and Production where students produce a multimedia information artefact in both prototype and final versions. In both cases, students learned about these assignments from reviewing works done by previous students in Live Peer Evaluation events where they were asked to collectively publicly mark those works according to the same rubrics that the tutors would be using. In this level 4 course, this was used to help students get a better understanding of the marks criteria. In the level 7 course, this goal was also pursued, but was also used for the peer marking of students’ own work.
Among the major findings of this study are:
In the level 4 course student attainment in the final assessment improved on average by 13% over 4 iterations of the course, with very marked increase among students in the lower percentiles
The effectiveness of Live Peer Assessment in improving student work comes from o Raising the profile of the marking rubric
o Establishing a repertoire of example work
o Modelling the “noticing” of salient features (of quality or defect) enabling students to self-monitor more effectively
In the major accepted measure of peer-assessment reliability (correlation between student awarded marks and tutor awarded marks) Live Peer Assessment is superior to traditional peer assessment. That is to say, students mark more like tutors when using Live Peer Assessment
v
In the second major measure (effect-size) which calculates if students are more strict or
generous than tutors, (where the ideal would be no difference), Live Peer Assessment is broadly comparable with traditional peer assessment but this is susceptible to the conditions under which it takes place
The reason for the better greater alignment of student and tutor marks comes from the training sessions but also from the public nature of the marking where individuals can compare their marking practice with that of the rest of the class on a criterion by criterion basis
New measures proposed in this thesis to measure the health of peer assessment events comprise: Krippendorf’s Alpha, Magin’s Reciprocity Matrix, the median pairwise tutor student marks correlation, the Skewness and Kurtosis of the distribution of pairwise tutor student marking correlations
Recommendations for practice comprise that:
o summative peer assessment should not take place under conditions of anonymity but that very light conditions of marking competence should be enforced on student markers (e.g. >0.2 correlation between individual student marking and that of tutors) o That rubrics can be more suggestive and colloquial in the conditions of Live Peer
Assessment because the marking criteria can be instantiated in specific examples of student attainment and therefore the criteria may be less legalistically drafted because a more holistic understanding of quality can be communicated
vi
Table of Contents
Declaration ... ii Acknowledgements ... iii Abstract ... iv List of Tables ... xiList of Figures ...xiii
Chapter 1. Introduction ... 1
Chapter 2. Peer Assessment and Feed-Forward: Literature Review ... 7
2.1 Meta-Studies of Peer Assessment ... 8
2.1.1 Peer Assessment between Students in Colleges and Universities – (Keith Topping) ... 8
2.1.2 User of Self Peer and Co Assessment in Higher Education - (Dochy, Segers, & Sluijsmans) 8 2.1.3 Student Peer Assessment in Higher Education: A Meta-Analysis Comparing Peer and Teacher Marks ((Falchikov and Goldfinch) ... 9
2.1.4 Effective peer assessment processes: Research findings and future directions (Van Zundert et al., 2010) ... 11
2.1.5 Peer assessment in the digital age: a meta-analysis comparing peer and teacher ratings (Li et al) 12 2.2 Synthesising the Findings ... 13
2.2.1 Perception of Fairness... 14
2.2.2 Measures of Accuracy ... 14
2.2.3 Claimed Effects ... 16
2.2.4 Logistics and Constellations ... 17
2.3 Peer Asssessment in Computer Science ... 18
2.3.1 Peer Marking – Study by Sitthiworachart and Joy ... 18
2.3.2 John Hamer and Aropa ... 20
2.4 Peer Assessment Technology... 22
2.5 The Design Crit ... 22
2.6 The Studio Method in Computer Science ... 24
2.7 Exemplar Based Assessment ... 25
2.8 Relevance to the Proposed Study ... 27
2.9 Conclusion ... 28
Chapter 3. Multimedia Specification Design and Production ... 30
3.1 Module Aims and Learning Outcomes ... 30
vii
3.3 Introducing Live Peer Assessment ... 33
3.3.1 Logistics ... 35
3.3.2 Peer Assessment Marking ... 38
3.4 The Data, Measures, and their Interpretation ... 39
3.5 Multimedia Specification Assignment 2 ... 42
3.5.1 Student Marking: Correlations and Effect Sizes ... 42
3.5.2 Assignment 2: Measures of Agreement ... 46
3.5.3 Assignment 2: Pairwise Correlation Measures ... 47
3.5.4 Inter-Rater Reliability ... 49
3.6 Multimedia Specification Assignment 4 ... 52
3.7 Conclusion ... 57
Chapter 4. The Experience of Peer Assessment on a Masters Course ... 59
4.1 Factors Affecting Higher Student/Tutor correlations ... 59
4.2 Focus Group ... 62
4.2.1 Students’ Initial Feelings about Peer Assessment ... 63
4.2.2 Fairness ... 64 4.2.3 Reciprocity ... 65 4.2.4 Bias ... 67 4.2.5 Marking Competence ... 68 4.2.6 Tutor Influence ... 68 4.2.7 Training ... 71 4.2.8 Peer Influence ... 73 4.2.9 Student Experience ... 75 4.3 Conclusion ... 76
Chapter 5. E-Media Design – Longitudinal Analysis... 80
5.1 The Course and Differences from the Previous Study ... 80
5.2 E-Media Design: The Module ... 81
5.3 First Iteration with Clickers and Exemplar Marking: 2010-11 ... 83
5.4 Second Iteration with Clickers and Exemplar Marking: 2011-12 ... 86
5.5 Third Iteration with Clickers and Exemplar Marking: 2012-13 ... 92
5.6 Fourth Iteration with Clickers and Exemplar Marking: 2013-14 ... 97
Chapter 6. E-Media Design Course – The Map of Improvement ... 106
viii
6.2 The Nature and Effects of Rubrics ... 117
6.2.1 Research Relating to Rubric Design ... 119
Chapter 7. Analysis of Voting in the BSc Course over the Years ... 123
7.1 Limitations of the Data... 123
7.2 Comparison of Inter-Rater Reliability using Krippendorf’s Alpha over the course ... 125
7.3 Time Taken to Make Judgements Between Grade Bearing and Non Grade Bearing Evaluation Sessions ... 128
7.4 2011-12 Iteration ... 133
7.4.1 Details of Student and Tutor Marking ... 133
7.5 More In Depth Look at Voting Patterns in the Final Year ... 138
7.5.1 The Training Set ... 138
7.5.2 Levels of Participation and Agreement in The Rehearsal Session ... 140
7.5.3 Levels of Participation and Agreement in the Final Session ... 142
7.5.4 Which Criteria Required the Most Time ... 145
7.6 Critical Success Factors ... 148
Chapter 8. Internalisation ... 151
8.1 Reflective Practice and Communities of Practice ... 152
8.2 Applying a Reflective Practice Framework to the Multimedia CV ... 153
8.3 Focus Group ... 154
8.3.1 The Centrality of the Rubric ... 155
8.3.2 The Impact of the Collective Marking Experience ... 157
8.3.3 Solving Problems ... 159
8.4 Conclusion ... 164
Chapter 9. Inspiration ... 167
9.1 Comparison of Use of Colour by 12-13 and 13-14 Cohorts ... 167
9.2 Examples of a Curved Navigation Bar ... 170
9.3 Use of Inverted Rounded Rectangles for Corners... 174
9.4 Conclusion ... 177
Chapter 10. Summary and Discussion ... 179
10.1 Logistical Recommendations: Preparation ... 179
10.2 Anonymity vs Accountability: Libertarian vs Authoritarian ... 180
10.3 Debriefing ... 182
ix
10.5 Surface vs Deep Learning ... 184
10.6 Further Research ... 186
10.6.1 Social Equity in Computer Science Education ... 186
10.6.2 Potential for Use in MOOCs ... 189
10.7 The Value of Live Peer Assessment ... 193
Chapter 11. Conclusions ... 195
11.1 RQ1 How might EVS and LPA be designed and implemented? ... 195
11.1.1 What kinds of rubrics or marking sheets are best used? ... 196
11.1.2 What practices can be used to enhance the reliability of marks in this modality? ... 197
11.1.3 What considerations should be borne in mind when choosing exemplars for students to mark? 198 11.2 How might EVS and LPA be evaluated? ... 198
11.2.1 Can LPA improve marks in an assignment? ... 198
11.2.2 If marks improve in an assignment, how is that improvement distributed across the cohort? 199 11.2.3 What measures exist to quantify the success of an LPA event? ... 200
11.2.4 Are students generally competent enough to mark their peers under these conditions and are they more or less so when compared to more traditional forms of peer assessment? ... 201
11.3 What are the benefits and limitations of using LPA and EVS? ... 203
11.3.1 What pedagogical benefits does this kind of peer assessment bring with it? ... 203
11.3.2 Do students become more competent in judging quality in the work of others and in their own work?... 203
11.3.3 What are the limitations of the technique? ... 204
11.4 How does LPA Work? ... 205
11.4.1 Does the act of assessing impact on the way students’ set about their own academic work? 205 11.4.2 What might be the explanation for the effects claimed for LPA in this study? ... 206
11.4.3 What are the students’ opinion and feelings about the process? ... 206
11.5 Conclusion ... 206 Appendices ... I References ... I Ethics Approvals ... VII Ethics Protocol: 1112/51 ... VIII Ethics Protocol: COM/SF/UH/00014 ... IX
x
Rubrics... X 2010T Rubric ... X 2010S Rubric ... XIII 2011TE Rubric ... XIV 2011 TS Rubric ... XVIII 2011TM RUBRIC ... XXI 2012S Rubric ... XXII 2012TM Rubric ... XXIV 2013S Rubric ... XXV 2013T Rubric ... XXVIII List of Publications Related to Work Done in this Thesis ... XXIX
xi
List of Tables
Table 2-1:Li et al.’s list of conditions where higher correlations occur between tutor and student marking
– (my numberings) ... 12
Table 2-2: Topping’s Peer Assessment Classification applied to (Sitthiworachart & Joy, 2004) ... 19
Table 2-3: Sitthiworachart and Joy: tutor student correlations by assignment and marking criteria ... 19
Table 2-4: Hamer’s table of comments with my annotations ... 21
Table 2-5:Wimshurst and Manning: Improvement of Cohort Controlled For by GPA ... 26
Table 3-1:Multimedia Specification Design and Production Course Schedule ... 31
Table 3-2:Topping’s Peer Assessment Classification Applied to Assignment 3 ... 32
Table 3-3:Student Numbers by Cohorts and Number of Groups ... 35
Table 3-4:Assessment Rubric for Prototype Artefact ... 35
Table 3-5:Assessment Rubric for the Completed Artefact ... 36
Table 3-6:Marking Data ... 39
Table 3-7: Sitthiworachart and Joy's Interpretation of Pearson Correlation Values ... 40
Table 3-8:Cohen's Interpretation of Effect Size ... 41
Table 3-9:Falchikov and Goldfinch's Table of theEeffect of Cohort Size on Correlation and Effect Sizes .. 41
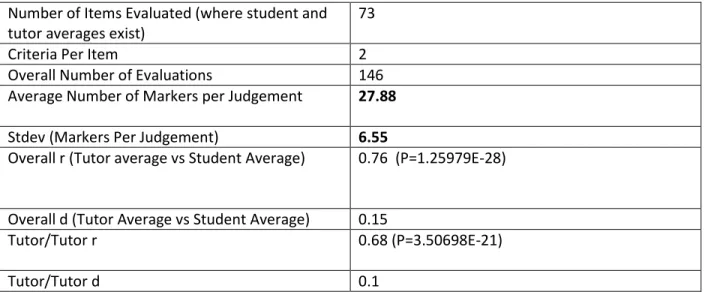
Table 3-10: Global Data on All Marking Judgements for Assignment 2 over Four Iterations ... 42
Table 3-11:Correlation over Specific Criteria over Four Years ... 43
Table 3-12:Correlation and Effect Sizes by Iteration for Assignment 2 ... 43
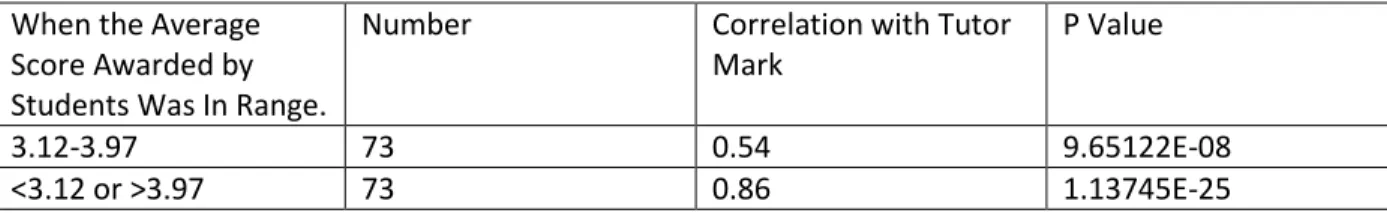
Table 3-13: Correlation within Average Scores versus Correlation within Non Average Scores ... 44
Table 3-14:Overmarking and Undermarking Proportions by Cohort ... 47
Table 3-15:Pairwise Student Tutor Correlation at the 20th Percentile ... 49
Table 3-16:Krippendorf's Alpha By Assignment 2 Marking Event (S=Summative R=Rehearsal) ... 51
Table 3-17:Histograms of Specific Marks Awarded By Assignment 2 Marking Event (S=Summative R=Rehearsal) ... 51
Table 3-18:Correlation and Effect Sizes by Iteration for Assignment 4 ... 53
Table 3-19: Kurtosis and Skewness of the Distribution of Correlations between individual student marks and tutor marks per assignment and cohort. ... 56
Table 4-1:Total r and d for all Judgements on all Assignments Delivered as Summative Assessment. (Excludes Rehearsal Events) ... 59
Table 4-2:Total r and d for all the two Major Meta-studies). *note effect size was calculated from s very small number of studies ... 59
Table 4-3:Factors in Li et al. Contributing to Higher Correlations between Tutor and Student marks: Whether they were of Relevance to the Current Study ... 60
Table 4-4: Non-significant Factors in Li et al. Contributing to Higher Correlations between Tutor and Student Marks: Pertinence to the current study ... 61
Table 5-1:E-Media Design Module - Learning Outcomes ... 81
Table 5-2: Weightings By Assignment2009-10 ... 82
Table 5-3: Weightings by Assignment 2010-11 ... 83
Table 5-4: 2010-2011 Rubric used by Tutor + Restricted Used by Students: Henceforth referred to as 2010T and 2010S, respectively ... 84
xii
Table 5-6: Evolution of Rubrics 2011-12. Tutor Exercise Rubric: Henceforth referred to as 2011TE and
the Tutor Marking Rubric: Henceforth referred to as 2011 TM. ... 88
Table 5-7: Appropriateness of Content Criterion 2011-12 ... 91
Table 5-8: Screen Design Criteria 2011-12 ... 91
Table 5-9: 2012 Rubric Used by Students - henceforth referred to as 2012S ... 93
Table 5-10: Evolution of Rubric 2012-13. Rubric used for Tutor Marking: Henceforth referred to as 2012TM ... 95
Table 5-11: 2013-14 Student Rubric (exactly the same stems as 2012TM) – referred to henceforth as 2013S... 101
Table 5-12: Post Evaluation Objective Test Questions ... 103
Table 5-13: Summation of Evolution of Module by Year ... 104
Table 6-1: T-Tests for Successive Year Averages ... 107
Table 6-2: Averages of Assignment 1 and Assignment 3 over time... 107
Table 6-3:Scores by Iteration and Decile ... 108
Table 6-4:Attendance by Event ... 110
Table 6-5: Rubrics 09/10/11 vs 12/13 ... 110
Table 6-6: 2009-10 and 2010-11 Average Score Per Criterion for the CV Assignment (scores awarded by tutor) ... 111
Table 6-7: 2010-11 and 2011-12 Average Score Per Criterion in CV Assignment (scores awarded by the tutor) ... 114
Table 6-8: 2012-13 and 2013-14 change of average score by criterion (as marked by tutor) ... 115
Table 7-1: Summary of Conditions ... 123
Table 7-2:Criteria by Level ... 124
Table 7-3: Method for awarding marks based on agreement with tutors over the years. ... 125
Table 7-4:Krippendorf's Alpha by Event ... 126
Table 7-5:Krippendorf's Alpha by Item Evaluated (*no record of which files evaluated during 12-13 iteration) ... 126
Table 7-6:Time Taken to Mark Each Criterion 2011-2012 Year in both “Rehearsal” and “Final” events . 129 Table 7-7:Time Taken to Mark Each Criterion 2013-2014 Year in both “Rehearsal” and “Final” events . 130 Table 7-8:Percentage of Non-Clicking Students By Year Modality and Artefact ... 132
Table 7-9: Criteria Used, Rehearsal vs Final Event ... 135
Table 7-10:Correlation of Marks Between Tutor Exercise and Student Voting (2011-12) ... 136
Table 7-11:Scores Given by Tutors vs Scores Given By Students 2013 Final Event ... 140
Table 7-12: Marking Pattern for Students who Attended Rehearsal vs Those Who Did Not. ... 144
Table 7-13: Correlation with Tutor Marks: Students who Attended Rehearsal vs those who did not ... 144
Table 7-14:List of the Marking Events ... 145
Table 7-15:Comparison of Marking Times Between Events on Per Year Basis ... 146
Table 11-1:Correlation and Effect Size for Tutor vs Student Marks Assignment 2 MSc Course ... 202
xiii
List of Figures
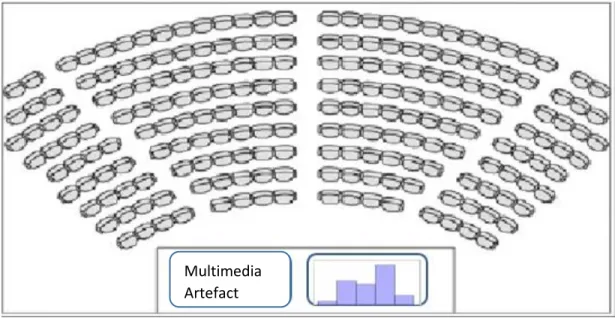
Figure 3-1:Marking Percentages of Multimedia Artefact Assignments ... 34
Figure 3-2:Typical Layout During a Clicker Session ... 37
Figure 3-3:Typical Marking Prompt Screens ... 38
Figure 3-4:Effect Size Equation as Used by Falchikov and Goldfinch ... 40
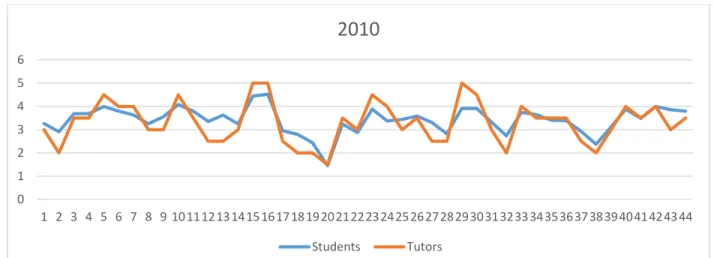
Figure 3-5:Tutor (Red) vs Student (Blue) Marks for Each Item and Criterion in 2010 – 22 groups two criteria per presentation ... 45
Figure 3-6:Tutor (Red) vs Student (Blue) Marks for Each Item and Criterion in 2011 – 19 groups two criteria ... 45
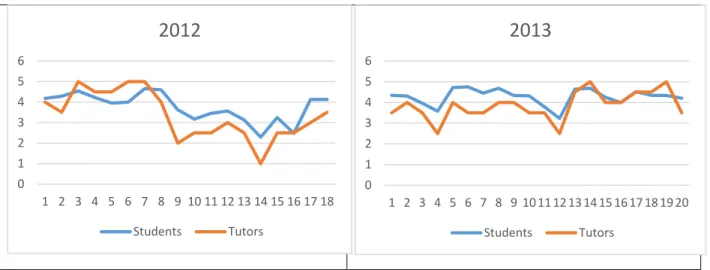
Figure 3-7: Figure 2 7:Tutor (Red) vs Student (Blue) Marks for Each Item and Criterion in 2012 and 2013 ... 46
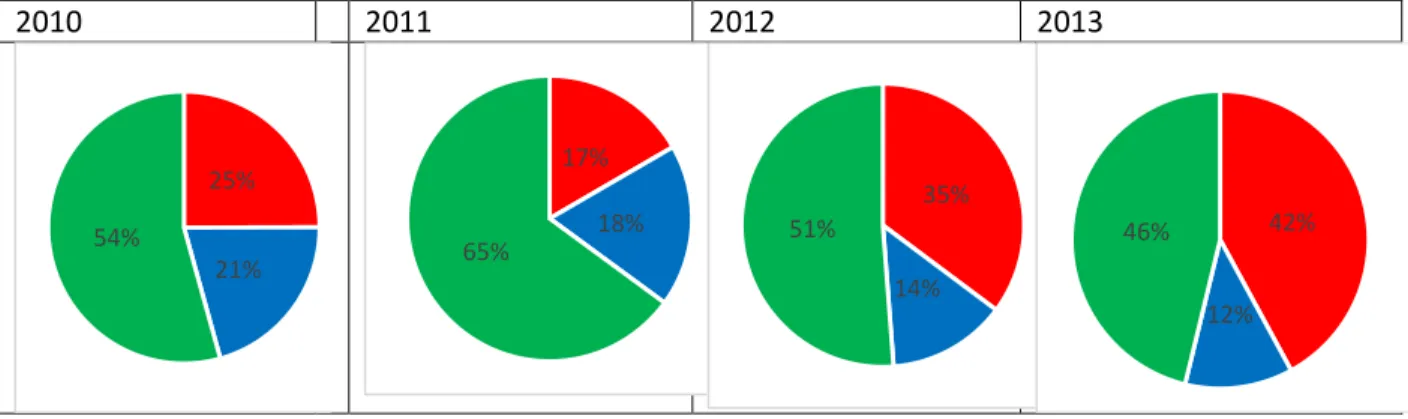
Figure 3-8:Agreement, Overmarking and Undermarking by Cohort while marking assignment 2: Agreement Green, Overmarking Red, Undermarking Blue ... 47
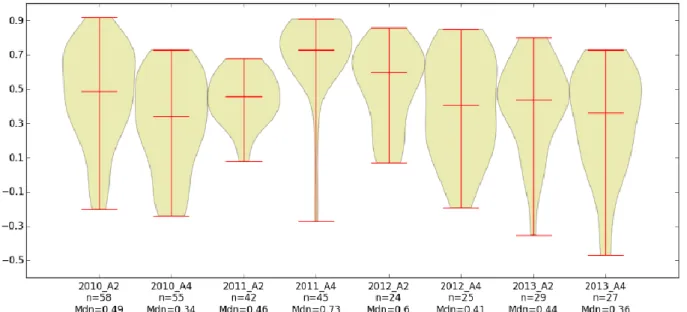
Figure 3-9:Violin Plot of the Distribution of Correlations between Individual Student’s Marking Patterns and those of the Tutors for Assignment 2 Marking Events ... 48
Figure 3-10:Box Plot of the Distribution of Correlations between Individual Student’s Marking Patterns and those of the Tutors for Assignment 2 Marking Events ... 49
Figure 3-11:Students’ Agreement and Over and Undermarking over 4 Years ... 54
Figure 3-12:Violin Plot of the Distribution of Correlations between Individual Students Marking Patterns and those of the Tutors for Assignment 2 and Assignment 4 Marking Events... 55
Figure 3-13:Box Plot of the Distribution of Correlations between Individual Students Marking Patterns and those of the Tutors for Assignment 2 and Assignment 4 Marking Events... 55
Figure 5-1: Normalised Graph of Student Outcomes in 10 Percentile Bins 2008-09/2009-10 ... 80
Figure 5-2:Normalised Graph of Student Outcomes in 10 Percentile Bins 2009-10/2010-11 ... 86
Figure 5-3: Normalised Graph of Student Outcomes in 10 Percentile Bins 2010-11/2011-12 ... 92
Figure 5-4: Normalized Graph of Student Outcomes in 10Percentile Bins 2011-12/2012-13 ... 96
Figure 5-5:CV1.swf – Scored 80.9% ... 97 Figure 5-6:Cv2.swf = Scored 93% ... 98 Figure 5-7:Cv3.swf = 88% ... 98 Figure 5-8:Cv4.swf = 69% ... 99 Figure 5-9:Cv5.swf = 55% ... 99 Figure 5-10:Cv6.swf = 82% ... 100
Figure 5-11: Normalised Graph of Student Outcomes in 10 Percentile Bins 2013/2014 ... 104
Figure 6-1: Marks Distribution by Year ... 106
Figure 6-2: Marks by Percentile Over Years ... 108
Figure 6-3: Box Plot of Performance in Final Assignment Over Years ... 109
Figure 6-4: Violin Plot of Performance over Years ... 109
Figure 6-5:Proportion of No/Maybe/Yes in First Eight Criteria in Years 09-10 and 10-11 ... 113
Figure 6-6:Proportion of No/Maybe/Yes in Final Eight Criteria in Years 09-10 and 10-11 ... 114
Figure 6-7: Marks Distribution First Nine Criteria in Years 12-13 and 13-14 ... 116
Figure 6-8: 2012-13 and 2013-14 Final Nine Criteria in Years 12-13 and 13-14 ... 117
xiv
Figure 7-1:Numbers of Students Per Answer Per Criterion ... 124
Figure 7-2:Time Taken to Mark Each Criterion 2011-20142Year in both “Rehearsal” and “Final” events ... 130
Figure 7-3:Time Taken to Mark Each Criterion 2013-2014 Year in both “Rehearsal” and “Final” events 132 Figure 7-4:Exemplar Set used in 2011-12 ... 134
Figure 7-5:Participation by Criterion by Artefact- 2011-12 Rehearsal Event ... 137
Figure 7-6:Participation by Criterion by Artefact- 2011-12 Final Event ... 138
Figure 7-7:Exemplar Set Used in 2013-14 ... 139
Figure 7-8: Voting Participation (%) by Artefact and Criterion 2013-2014 Rehearsal Event. ... 140
Figure 7-9:Participation by Artefact (line colour) and Criteria during Final Event 2013-14 ... 142
Figure 7-10:Participation by Artefact and Attendees (line colour + shade) and Criteria during the Final Event 2013-14. ... 143
Figure 7-11:Violin plot of attainment levels over 5 years of the course for the final assignment ... 149
Figure 9-1:Spread of principal colors of 2012-13 artefacts sorted by hsv values ... 168
Figure 9-2:Spread of principal colors of 2013-14 artefacts sorted by hsv values ... 168
Figure 9-3:Spread of principal colors of 2012-13 artefacts sorted by red minus blue values ... 169
Figure 9-4:Spread of principal colors of 2013-14 artefacts sorted by red minus blue values ... 169
Figure 9-5:Spread of principal colors of 2012-13 artefacts sorted by greenness values ... 169
Figure 9-6:Spread of principal colors of 2013-14 artefacts sorted by greenness values ... 169
Figure 9-7:6 Principal Colours in the Exemplars ... 169
Figure 9-8: cv2.swf Exemplar ... 169
Figure 9-9: Student Curved Navigation Bar 13-14 (1) ... 170
Figure 9-10: Student Curved Navigation Bar 13-14 (2) ... 170
Figure 9-11: Student Curved Navigation Bar 13-14 (3) ... 171
Figure 9-12: Student Curved Navigation Bar 13-14 (4) ... 171
Figure 9-13: Student Curved Navigation Bar 13-14 (5) ... 171
Figure 9-14: Student Curved Navigation Bar 13-14 (6) ... 172
Figure 9-15: Student Curved Navigation Bar 13-14 (7) ... 172
Figure 9-16: Student Curved Navigation Bar 13-14 (8) ... 172
Figure 9-17: Student Curved Navigation Bar 13-14 (9) ... 173
Figure 9-18: Student Curved Navigation Bar 13-14 (10) ... 173
Figure 9-19: Student Curved Navigation Bar 13-14 (11) ... 173
Figure 9-20: Student Curved Navigation Bar 13-14 (12) ... 174
Figure 9-21: Exemplar cv1.swf 12-13 ... 174
Figure 9-22: Inverted Rounded Rectangle Corners in Button ... 174
Figure 9-23: Student Inverted Rounded Rectangles 13-14 (1) ... 175
Figure 9-24: Student Inverted Rounded Rectangles 13-14 (2) ... 175
Figure 9-25: Student Inverted Rounded Rectangles 13-14 (3) ... 175
Figure 9-26: Student Inverted Rounded Rectangles 13-14 (4) ... 176
Figure 9-27: Student Inverted Rounded Rectangles 13-14 (5) ... 176
Figure 9-28: Student Inverted Rounded Rectangles 13-14 (6) ... 176
1
Chapter 1.
Introduction
Assessment and feedback in terms of their timeliness and effectiveness have been a perennial problem in Higher Education and is invariably the category that demonstrates the least satisfaction among students in the national student survey (2016). To assess is to judge students’ work against a standard of quality, and to give feedback is to express how the student succeeds or fails to achieve the standards desired. For this to be a satisfactory process, the conception of quality needs to be shared between the tutor and his/her students, such that any feedback can be received as something embodying a shared understanding. For this feedback to be anything more than an academic exercise, it needs to influence how the student attends to future work, or if it is formative feedback within a larger project, it needs to enable the student to reflect on his/her practice and proceed differently. Moreover, it needs to be timely, received when the work being evaluated is fresh in the students’ mind, or when there is still time to change things.
In a situation with large staff-student ratios, all this is difficult to achieve. In the 2016 national student survey, only 59% of students agreed with the statement “Feedback on my work has been prompt”. Given those ratios are unlikely to change, what is the best way to ensure a more effective assessment and feedback process, particularly in Computer Science, or in digital topics generally? Another
statement in the 2016 national student survey relating to assessment and feedback which also received low assent was “Feedback on my work has helped me clarify things I did not understand”, for only 60% of students agreed. Given that in this survey students are reflecting on the totality of their university experience, it means that 40% of students do not find feedback helpful – which is a fairly sobering assessment. However, this really needs unpacking. Does the low assent mean that (a) the feedback was incomprehensible (b) the feedback was lacking or (c) the feedback was wrong? My own belief is that the likeliest explanation is that the feedback they received was not meaningful to them.
One of the most influential projects in Assessment and Feedback in the 21st century UK Higher Education
Sector has been the REAP (Re-Engineering Assessment Practices in Higher Education) (2007) project. One of its major findings was that rather than seeking to make academics more efficient producers of feedback, they believed making students more effective monitors of their own work was the key to improving the assessment experience. David Nicol wrote:
2
Assessment and feedback practices should be designed to enable students to become self-regulated learners, able to monitor and evaluate the quality and impact of their own work and that of others.
One of the ways this has been attempted in the past has been through self-assessment and peer-assessment. These techniques began in the 1970s and have become increasingly well established. Typically, they have involved getting students to evaluate the work of their peers, in small groups. This has become so widespread that a number of meta-studies have been undertaken to evaluate the process. In the era before LMSs (Learning Management Systems), such interventions were quite cumbersome, involving academics in distributing/collating lots of paper based responses. More recently, VLE (Virtual Learning Environment) functionality and dedicated online systems have made the act of introducing and managing peer assessment much more practicable.
However, further technological advances, particularly EVS (Electronic Voting Systems) and polling applications, means that today peer assessment can be achieved instantaneously, even with just a smartphone and rating platforms like Poll Everywhere (2017). This kind of peer assessment, however, is very different to what has gone on before owing to its immediacy and convenience. The fact that such platforms enable instantaneous and highly scale-able peer feedback to be obtained (for instance, getting feedback from over 200 students in a lecture theatre), means we need to distinguish it from other forms of peer assessment. Accordingly, from now on I will call it Live Peer Assessment (LPA).
My interest in LPA has been in order to:
1. Get students to evaluate the work of peers and thereby, become more competent evaluators of their own work;
2. Enable a more effective dialogue about quality in multimedia assignments; 3. To generate much faster feedback.
The objectives, therefore, of this research are:
1. To survey current thinking in the area of peer assessment by means of a literature survey; 2. To examine the use of EVS and LPA in a UK University;
3. To develop guidelines for the use of EVS and LPA;
4. To understand the potential benefits and limitations of this approach. The overarching research questions are;
3
RQ1 How might EVS and LPA be designed and implemented?
RQ2 How might EVS and LPA be evaluated?
RQ3 What are the benefits and limitations of using LPA and EVS?
RQ4 How does LPA work?
The following are sub questions relating to these research questions.
RQ1 What kinds of rubrics or marking sheets are best used?
RQ1 What practices can be used to enhance the reliability of marks in this modality?
RQ1 What considerations should be borne in mind when choosing exemplars for students to mark? RQ2 Can LPA improve marks in an assignment?
RQ2 If marks improve in an assignment, how is that improvement distributed across the cohort? RQ2 What measures exist to quantify the success of an LPA event?
RQ2 Are students sufficiently competent to mark their peers under these conditions and are they more or less so when compared to more traditional forms of peer assessment?
RQ3 What pedagogical benefits does this kind of peer-assessment bring with it?
RQ3 Do students become more competent in judging quality in the work of others and in their own work when engaging in LPA and EVS?
RQ3 What are the limitations of this technique?
RQ4 Does the act of assessing the impact on the way students set about their own academic work? RQ4 What might be the explanation for the effects claimed for LPA in this study?
RQ4 What are the students’ opinion and feelings about the LPA process?
These questions are addressed through a study of two courses over four iterations. For each course, two of the iterations precede the start of this PhD and the final two iterations take place during the PhD. Therefore what this study is examining is pedagogical practice which was well established well before any thought of deeper examination was contemplated. The successful implementation and striking results encountered in those early iterations was what gave me the inspiration to seek more complete understanding of what was occurring. As a result, there is no real change in practice beyond refinement of the details in the final two iterations of each course. However, in order to understand how students experienced these techniques, two focus groups were conducted one in each course (carried out under ethics protocols 1112/51 and COM SF UH 00014– see appendix).
4
The first of these is Multimedia Specification Design and Production, a 30 credit masters course. In this course, LPA was used both summatively (on assessees) and in formative exercises (where students learned how to grade others by marking previous students’ work). On this course, students in groups produced multimedia artefacts in both prototype and final forms, with a proportion of their marks coming from the average score given by their peers. The other is E-Media Design, a 15 credit 1st year
BSc course. On this course, the students did not mark their peers work, but rather, participated in exercises marking previous students’ work. For the first three iterations, they received some credit for how similarly they marked to the tutors. That is to say, it was in a limited way, summative (on the assessor). This meant the marking done by any student on this course did not impact on the marks of any other student in any way.
The Masters’ course involved students marking their peers’ group work. That is to say, students developed their artefacts in groups of two or three, and the whole of the class marked them at a demonstration. This course had a varying enrolment between 60-30 students and so it would be difficult to draw many conclusions regarding the quality of student work over different iterations. However, the BSc course had enrolments varying between 180-240 students and did individual work and so on this course it is much easier to compare the quality of work between iterations.
The structure of the thesis is as follows.
Chapter 1 – Introduction
Chapter 2 - Peer Assessment Literature Survey
This is an extensive evaluation of the research literature relating to all 4 research questions. It covers Topping’s work on the variety of peer-assessment practices (RQ1) as well as the measures of peer-assessment practice propounded by Falchikov and Goldfinch and their successors (RQ2). The claimed benefits of peer assessment in the literature are also considered as well as critiques of its practice being provided (RQ3/4). In terms of LPA, I also discuss other examples of this technique as well as analogous techniques – such as the studio “Crit” used in the design sciences (RQ1).
Chapter 3 – Multimedia Specification Masters Course: History and Results
The structure of this course remained remarkably uniform over the four iterations, but certain aspects of each iteration brought out the particular strengths and weaknesses of LPA. (RQ3 and RQ 4). The rubric used and the difference between it and its predecessors is explained (RQ1). Moreover, the influence of rehearsal sessions and their value in the
5
process are covered (also RQ1). Statistical measures consistent with Falchikov and Goldfinch are used as well as new ones are promoted (RQ2).
Chapter 4 - Multimedia Specification Masters Course: Focus Group
In these discussions, I investigated how the students experienced LPA. The aim of this focus group was to discover how LPA works and why it may have affordances that make this form of peer assessment more reliable than others. (RQ3 and RQ4). Based on the discussion, I also return to the marking data and examine whether there was any evidence of reciprocated marking (one student agreeing to mark another’s work higher in return for doing the same). This is also numerically measured (RQ2). Also, techniques to enhance the reliability of student marks are considered (RQ1).
Chapter 5 – E Media Design: Chronology
The E-Media Design course was much more variable in terms of the rubrics used and the incentives offered to make students participate in the peer assessment process. Since this is complicated I have devoted a chapter to it which primarily deals with the logistics of its implementation over the focal four years (RQ1).
Chapter 6 – E Media Design: Measures of Improvement
The E-Media Design course average for the final assignment improved by approximately 13% over the studied four years (RQ3). In this chapter, I analyse the cohort by
percentiles to see which range of the cohort demonstrated greatest improvement. Also, what practices might have contributed to the results of particular years is investigated (RQ1)
Chapter 7 – E Media Design: History and Results
This is an in-depth look at the voting data over the four years, with the aim of
determining whether certain criteria are inherently more difficult or easy than others (RQ1). Other measures of student voting patterns are considered (RQ2) along with how long it took for students to make judgements with particular criteria and artefacts (RQ2). Finally, the effect of the training set on the voting patterns of the students is examined (RQ1).
Chapter 8 – E Media Design: Focus Group and Internalisation of Quality Standards
This chapter is based on a focus group discussion and addresses the question as to why student artefacts, on average, improved over the four iterations. Through the
6
discussion with the students I investigate how they went about their own work after having participated in the LPA events (RQ3 and RQ4).
Chapter 9 – E-Media Design: The Inspirational Element
This chapter deals with a concept that might also be contributing to higher student achievement, namely “inspiration”. I pursue this by looking into whether any properties of the exemplar training set found their way into the work produced by the students (RQ3).
Chapter 10 – Discussion and Summary
This chapter relates the findings and observations of the study to items of interest to computer science academics, including: MOOCs, social equity in computer science, and academic practice. (RQ3 and RQ4)
Chapter 11 – Conclusion
7
Chapter 2.
Peer Assessment and Feed-Forward: Literature Review
In the previous chapter, I explained that the goal of the research was to complete a longitudinal study on the effects of live peer assessment in two university courses. In order to understand the issues involved, a literature survey on peer assessment was undertaken. This was both to inform practice and to establish the conceptual frame of the research.
Peer Assessment has become a more recognised feature of university education recently, although its history is actually quite long. Arguably, the first pedagogical writing regarding this practice was that of George Jardine, who was professor of logic and philosophy at the University of Glasgow from 1774 to 1826, who extolled the practice of peer tutoring and got students to work in groups and edit each other’s essays (Gaillet, 1992). However, its first mention in recent university education probably occurred in 1959, with Hammond and Kern (1959) emphasising the value of self-assessment in medical education. Specific reference to the value of peer assessment first occurs in Schumacher (1964), where he noted that peer assessment could be used to measure medical skill and also, unlike traditional measuring practices, “skill in relationships”. This finding was echoed seven years later when Korman and Stubblefield (1971) found that peer ratings were the most accurate predictor of subsequent intern performance.
The next very significant paper was written by Boud and Tryee (1980), which recorded that there was substantial correlation between the marks of tutors and peer evaluated marks applied to students in a law course. Law, like medicine, is a very established profession, where peer evaluations of colleagues is commonplace and therefore, peer assessment might be considered suitable in training new
practitioners. A similar level of agreement (relating to correlation between tutor and student marking) was found by Morton and MacBeth (1977), who investigated medical students rating each other. The fact that very early in the practice of university peer-assessment there was some need to prove the validity of peer-awarded marks is significant. After all, how could one responsibly ask students to receive the opinions of their peers, if one did not have faith that they would be fair and representative? At this time, self-assessment was as important as peer assessment and one significant meta-study about student self-assessment was published in 1989 by David Boud and Nancy Falchikov (1989). This
established a number of techniques for comparing different studies which would also re-emerge in Falchikov and Goldfinch’s meta-study on peer assessment some 10 years later; essentially, these
8
pertained to correlation coefficients between student awarded marks and tutor awarded marks as well as effect size (Cohen’s D). Regarding this, they found that the mean correlation coefficient between staff assessment and student self-assessment was 0.39.
2.1
Meta-Studies of Peer Assessment
Up to now, there have been five significant meta-studies on peer assessment:
Peer Assessment between Students in Colleges and Universities Keith Topping (Topping, 1998);
User of Self Peer and Co Assessment in Higher Education (Dochy, Segers, & Sluijsmans, 1999);
Student Peer Assessment in Higher Education: A Meta-Analysis Comparing Peer and Teacher Marks (Falchikov & Goldfinch, 2000);
Effective peer assessment processes: Research findings and future directions (Van Zundert, Sluijsmans, & Van Merriënboer, 2010);
Peer assessment in the digital age: a meta-analysis comparing peer and teacher ratings(Li et al., 2015).
2.1.1
Peer Assessment between Students in Colleges and Universities – (Keith Topping)
Topping examined 31 papers, and his paper is a broad summary of findings, largely qualitative, with its major contribution being a very rigorous classification system of the different ways in which peer assessment is undertaken. Typical modes include peer ratings between members of a group – typically done on a one to one basis (each person rates one other). Sometimes one person rates a small number of others. As well as these, Topping included categories such as weighting (summative or not),
anonymity, assessors per assessee and many others. This classification system will be used for reviews of some other studies, as well as the studies in this report. Topping was also very good at critically analysing the claims made by a number of papers and synthesising them into a compact overview.
2.1.2
User of Self Peer and Co Assessment in Higher Education -
(Dochy, Segers, & Sluijsmans)
Dochy et al. (1999) probed 63 papers covering both self and peer assessment (the fact that they covered self assessment also accounts for the larger number of papers). Their main findings were that, ifimplemented properly, one could expect agreement between tutor and student marking and also, that it would have positive effects on students. They associated the need for peer assessment with the needs of the labour market for more self-reflective learners capable of problem solving.
9
2.1.3
Student Peer Assessment in Higher Education: A Meta-Analysis Comparing Peer and
Teacher Marks (
(Falchikov and Goldfinch)
Falchikov and Goldfinch (2000) covered 48 papers and involved a much greater statistical rigour than the previous two studies, with no study of similar ambition being attempted until Li et al. (2015) . This was a very significant meta-study, which attempted a synthesis of data to establish the validity of peer
assessment. They focused particularly on two measures to compare tutor and student marking
patterns: the r (correlation coefficient), and d (the effect size). In broad terms, r represents the level of similarity of the marking patterns of tutor(s) and student(s), whereas d measures the similarity of marking weights. In other words, r can tell if there is a correlation between marks given by different markers, whilst d can tell if one group of markers grades more or less generously than another. Synthesising and putting the data of the 48 studies together, they found an average r (correlation coefficient between tutors and students) of 0.69. Notably, this is much higher than the average correlation coefficient reported in the meta-study of self-assessment papers (0.39). They elicited that the average d (effect size) to be 0.24. Overall, these are very positive figures for justifying the overall validity of peer assessment.
However, within these data, they also highlighted a number of other variables influencing the level of agreement between tutors and peers. One of the codings used to differentiate the studies was the marking instrument used - based on "dimensionality" vs "globality" -, by which they meant how structured the marking instrument was. The three categories in this regard are:
1. G - meaning global - that is to say, students and staff have to award an assessee a particular overall score without much concentration on criteria or attainment descriptors;
2. G+ - means that students award a global score, but with strong guidance as to the considerations or criteria for giving an award;
3. D - means explicitly dimensioned, namely, that students follow a rubric of various criteria with potentially attainment descriptors for each.
There findings in this regard, were that the G+ types of peer assessment exercises yield the highest correlation coefficients and that D type rubrics the least. Nonetheless, this division itself might be too broad-brush since not all such marking instruments would fall easily into one of the three categories. As an example, the marking procedure described by Magin (1993) could be said to be both G+ or D, whilst
10
Falchikov and Goldfinch would place that paper in the G+ category. Magin’s paper contained two cases studies, one of which asked students to rate other students based on contribution to discussion and contribution to development of group. The other case study involved seminar presentations, where students were subsequently rated on six criteria, broadly summarised as evidence of reading, evidence of understanding, organisation of time, creativity and variety, facilitation of student participation and critical evaluation). Each of these had to be marked from 1 (inadequate) through 3 (satisfactory) to 5 (outstanding). This appears fairly strictly dimensioned, yet it was coded under G+ by Falchikov and Goldfinch.
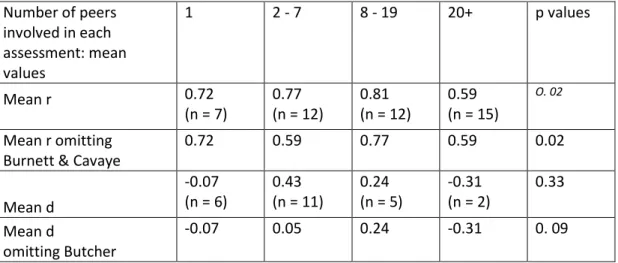
The other interesting findings in the paper are that cohort size (the constellation involving a large number of assessors per assessee) does not improve the level of agreement, and potentially might lead to lesser correlations. This, however, may just be a reflection of the logistical issues of having multiple assessors in 1998 (when the meta-study was undertaken). Brown and Knight (1994) also wrote:
One danger arises in the sheer mathematics of multiple assessors. If 20 or so groups assess each other and two categories of staff are also involved, and there is an element of oral assessment too (eg, 'How effective were the group in answering questions on the poster?'), then the processing of all the assessment sheets can be a nightmare.
At the time of writing of the current study, where there are many technologies, such as EVS clickers as well as dedicated polling apps, these logistical issues, which could have impacted on the processes under consideration by Falchikov and Goldfinch may be no longer a problem. Another finding is that the rating of academic products (e.g posters and presentations) is more likely to lead to high agreement than the rating of professional practice. This may be down to the more subjective criteria in operation. A number of papers - Orsmond, Merry, and Reiling (1996), Sitthiworachart and Joy (2004) - have also demonstrate different levels of agreement amongst different criteria.
Falchikov and Goldfinch undoubtedly brought greater rigour to the study of peer assessment. In their paper, they criticise approaches which demonstrate validity by "percentage of agreement" between tutor and student marks, where "agreement" could be interpreted sometimes extremely strictly, whilst at other times extremely loosely. Similarly, their insistence on the effect size variable (Cohen’s D) as being an important measure, meant that validity would not merely be demonstrated by similarity of marking pattern, regardless of the scores given, for it would also concern whether marks awarded are over-generous or the opposite.
11
However, a number of the other recommendations made at the end of the paper might be regarded as unduly prescriptive. For instance, their promoting of criteria informed global scores above explicitly dimensioned criteria, was made from a comparison of a small number of studies reporting different levels of correlation. They also recommended avoiding large numbers of assessees per assessor, but did not offering much in the way of a proof for this. However, their emphases, assessor population size, clarity of criteria, holistic verses granular criteria and effect size as a supplementary measure of validity, were important considerations for practice in this study. Falchikov and Goldfinch, while justifying the validity of peer assessment, did not seek any way of quantifying the benefits for students doing so. At the beginning of their study, they cited Vygotsky and social constructionism and stated that peer assessment will promote learning. However, they provide little concrete evidence for that assertion.
2.1.4
Effective peer assessment processes: Research findings and future directions
(Van Zundert
et al., 2010)
The next meta-study did indeed, attempt to find out if peer assessment (PA) promoted learning, and also to find out what factors are instrumental in this. In their words, they sought “to investigate how PA conditions, methods and outcomes are related” and grouped its findings across four headings:
1. Psychometric Qualities Of Peer Assessment
(by this is meant accuracy and reliability of peer marks); 2. Domain-Specific Skill
(by this is meant improved performance in the field where the peer assessment was used); 3. Peer Assessment Skill
(by this is meant the differential abilities of different peer assessors and the factors contributing to this);
4. Students' Views Of Peer Assessment
(by this is meant students overall attitudes towards the process).
In terms of Psychometric Qualities (in basic terms validity of judgement), this meta-study did not say anything not already said by Falchikov and Goldfinch. In terms of Domain specific skill, the authors pointed to a number of studies where students did a draft of some assessment, received peer feedback, and then redeveloped their work, which usually resulted in a higher score and the authors attributed this to students acting on the feedback received. In terms of Peer Assessment Skill, the authors pointed to better outcomes happening when students received training in peer assessment. Other findings were that high achieving students appeared to give better feedback, and that students with "high executive
12
thinking" (generally a willingness to follow the instruction and guidance of the tutors, rather than being more independent) appeared to give better feedback. Among Students’ Views of Peer Assessment they found greater acceptance of peer assessment among students who had been trained in it and a more positive orientation to study. However, they also found a number of studies where students expressed negative opinions of peer assessment.
2.1.5
Peer assessment in the digital age: a meta-analysis comparing peer and teacher ratings (Li
et al)
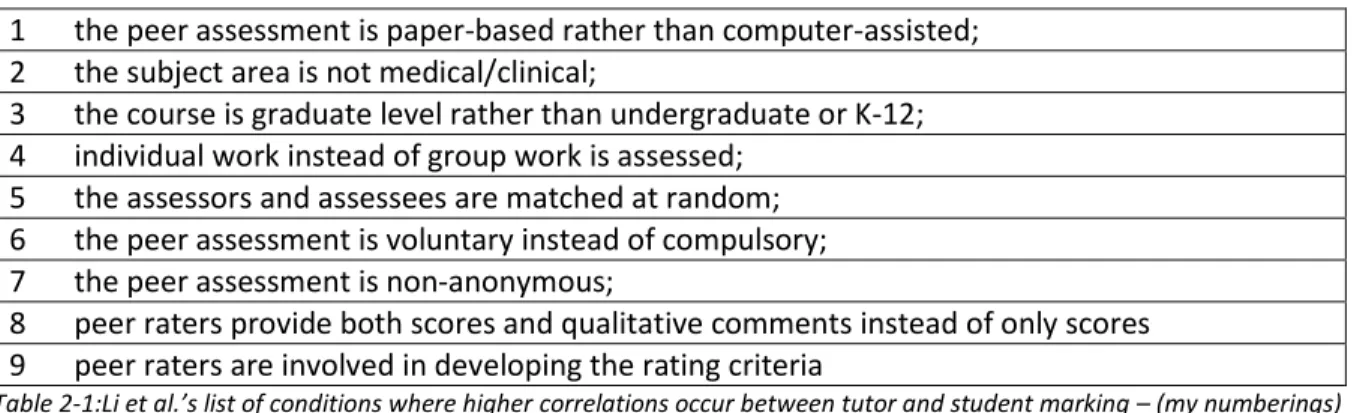
The most recent meta study by Li et al. (2015) involved doing very much the same as Falchikov and Goldfinch, namely, to cover the correlation between tutor and student marking. However, they covered a larger number of studies (70). They also described a more sophisticated technique for aggregating the various reported correlation coefficients into an overall figure. They found that the average correlation between tutor and student awarded marks is 0.63 (very comparable to Falchikov and Goldfinch’s figure of 0.69). They also made a number of other observations, contending higher correlations occur when the following is the case.
1 the peer assessment is paper-based rather than computer-assisted; 2 the subject area is not medical/clinical;
3 the course is graduate level rather than undergraduate or K-12; 4 individual work instead of group work is assessed;
5 the assessors and assessees are matched at random; 6 the peer assessment is voluntary instead of compulsory; 7 the peer assessment is non-anonymous;
8 peer raters provide both scores and qualitative comments instead of only scores 9 peer raters are involved in developing the rating criteria
Table 2-1:Li et al.’s list of conditions where higher correlations occur between tutor and student marking – (my numberings) They believed the paper-based finding (item 1 in Table 2-1) may be due to the immaturity of some web based systems for conducting peer-assessment and also, that paper-based versions might make the exercise less casual (this might also explain higher correlations when qualitative comments were added - see item 8 in Table 2-1.) Also, the finding that correlations improve when participation is voluntary might also mean that participation is more serious (unmotivated students are not participating). However, the danger in having only voluntary participation is that it might mean that those who would most benefit from participating in peer assessment might not do choose to so. The finding that
correlations are higher when the subject area is not clinical (item 2 in Table 2-1) relates to the difficulty of judging professional practice (and echoes Falchikov and Goldfinch’s findings) and more generally, the
13
difficulty of evaluating more subjective criteria. That individual rather than group work receives higher correlations (item 4) is intriguing and the authors did not attempt to explain why this is so.
This paper is valuable in that it confirms the typical correlation between tutor and student marks that had been established in Falchikov and Goldfinch. They also pointed to the different variations based on the maturity of the assessors, and the level of their buy in to the process. However, just like the other meta-studies here, there is not much in terms of the effects, that is to say, the beneficial outcomes that can be said to arise from peer assessment.
2.2
Synthesising the Findings
In order to synthesise the findings of these studies, to identify those most relevant to the study being undertaken here, I summarise them under four headings: Perception of Fairness, Measures of Accuracy, Claimed Effects and Logistics and Constellations.
Perception of Fairness is typically the student’s perception of the honesty and validity of the
process. In this study, this is examined in the focus group with the masters students (chapter 4).
Measures of Accuracy, involve the r (Correlation Coefficient) and d (Cohen’s d for Effect Size)
cited by Falchikov and Goldfinch, but also other measures, such as pairwise Kendall’s Tau (Orpen, 1982) and also Paired T-Tests (Cheng & Warren, 2005). The coverage of the marking on the MSc course in terms of r and d is examined.
Claimed Effects relate to the benefits or otherwise the practice brings to the student, both in
terms of higher scores in subsequent assignments, or in terms of attitude to learning. This is investigated in the scores for the assignments on the BSc course.
Logistics and Constellations relates to how peer assessment needs to be organised in order to
be successful (prior training in peer assessment, negotiation of criteria, summative vs formative) as well as who marks who and number of assessors per assessee. The logistics are very specific to the method used in this study (EVS clickers) and I will attempt to convey what I believe to be the most effective methods for doing this.
These four factors do interact. The Perception of Fairness registered by students will be related to the Logistics and Constellations (the type and wording of rubric, whether staff moderation is undertaken, training in peer assessment, anonymity or not, number of assessors per assesse and the selection of who rates who) and also, to the real Measures of Accuracy (the general correlations and effect sizes
14
between tutor and student scores in any assessment, the presence or otherwise of evidence of non-academic marking).
2.2.1
Perception of Fairness
Fairness is a perennial concern and the anxiety it causes students is never completely assuaged by how many studies demonstrate high correlation between tutor and students’ marks. As explained earlier, Falchikov and Goldfinch found the average correlation across all studies between tutor awarded marks and student awarded marks to be 0.69, which is substantial. However, this correlation figure describes the coincidence of patterns of marking and cannot take account of odd occasions of injustice.
Moreover, a high correlation is not necessarily an indication of fairness. Highly correlated marks
between two markers with highly discrepant standard deviations (where the range between the highest and lowest may be larger) would mean that potentially high performing students are not given sufficient credit for their more accomplished work when marked by markers with a narrow range. Related to this is the disinclination of students to penalise their peers. Finally, there is the fear of abusive marking. Brown and Knight, (1994) establish a typology of non-academic influences on student marking in the context of groups of project students rating each other. They particularly mention friendship marking and collusive marking. Two other factors, namely, decibel marking (individuals dominating groups and getting high marks as a result) and parasite marking (students benefit who do not participate) are only relevant to project intra-group peer evaluation and so, are beyond the focus of this study. Mathews (1994) also attempted to construct a primitive typology of marking styles (flat, normal, finger-pointing, stitch up and out of kilter). Being aware of these is useful for preventing any distortions that might occur in peer assessment, however, being too vigilant and trusting the students too little can also bring about its own distortion. Typically, most peer assessment practice involves some process of moderation by the tutors, such that unfair or malicious marking can be altered by the monitoring tutor. Other factors influencing the perception of fairness is training in peer assessment. If students can see its operation in non-summative contexts, they are more likely to accept it in summative ones.
2.2.2
Measures of Accuracy
Accuracy has tended to concentrate on comparison between tutor and student marks. The major measure is the correlation coefficient, although this figure is often presented uncritically in small sample sizes (Boud 1980 for example) and at times can be presented with eye-catching results, which seem impossible to justify, for instance, in Burnett & Cavaye (1980) in which a mean correlation of 0.99
15
Freeman (1995) found a high correlation between student and staff marks, but also found evidence of student under-marking of good presentations and over-marking of poor ones (a general compression of the marking). Orsmond et al. (1996) and Stefani (1992) also demonstrated similar effects, thus
suggesting that whilst averages and correlations seem to be consistent, often standard deviations are lower. However, this may be little more than an obvious statistical effect. Simply the fact of averaging multiple marks will lead to a more compressed distribution (if there are the averages of many student ratings being compared with a single tutor rating), rather than being the result of different marking patterns. This statistical effect, however, will also feed into worries about fairness (among high achieving students), who may find the excellence of their work only occasions a small premium in their marks relative to the rest of the class.
Topping (1998) looked at 31 studies concerning the reliability of peer assessment. Eighteen of these studies reported high reliability, with a tendency for peer marks to cluster around the median noted. He also found seven studies with low reliability. An early paper by Orpen (1982) had another
mechanism, creating pairs of Kendall’s coefficient of concordance as a measure of association. Among 21 comparisons between tutor and individual student marks few demonstrated a significant difference. Another measure is paired t tests between tutor markings and student markings (Cheng and Warren, 2005).
At this point, it is worth sounding a note of caution, particularly because there is likely to be a publication bias in favour of studies that demonstrate high-correlation and substantial agreement between tutor and student marks. Studies reporting disappointing results are few; one of these, by Bostock (2000), reported a 0.45 correlation between student and tutor marks. Swanson, Case, and van der Vleuten (1991) reported students giving uniformly high ratings to other students, and when some forced ranking was introduced in order to stop this, it elicited so much resistance that the practice had to be discontinued. However, this paper itself takes a negative stance regarding peer evaluation, confusing it with self-evaluation in its summary of research and therefore, the negative outcomes may merely have reflected the negative assumptions of the authors. What we can say is that among those studies carried out more or less successfully, there are a number of interesting commonalities and one of the most compelling is the r (correlation value), very often being between 0.6 and 0.7, which has been subsequently confirmed by the later meta-study undertaken by Li et al. (2015)
16
2.2.3
Claimed Effects
This can be described as being the change in learning and also learning self-image caused by peer assessment. Dochy et al. (1999) suggest that increased student self-efficacy, awareness of academic quality, reflection, performance, effectiveness, responsibility, students’ satisfaction and an improvement in learning culture are all potential positive effects of peer assessment. Topping particularly focused on cognition and metacognition, believing that PA could lead to increased time on task (evaluating). He also suggests that students would be better able to measure deviations from the ideal, meaning some kind of norm referencing– enabling a student to locate himself or herself in relation to the performance of peers and to prescribed learning targets and deadlines. Sluijsmans, Moerkerke, Van Merrienboer, and Dochy (2001) suggested that students acquire a better self-perception of their own assessment skill as a result of participating in peer assessment, whilst Liu and Tsai (2005) reported students saying that it had helped their learning. In terms of quantitative measures of increased learning or performance,
(Bloxham & West, 2004) also commended peer assessment for giving students an understanding of the assessment regime and giving them a clearer sense of the "rules of the game".
When approaching the issue of the benefits of peer assessment, as opposed the validity, the previously highly numeric and quantified evidence gives way to a vaguer and less provable set of propositions. Regarding this, Pope (2005) stated that “Some of these benefits can give the impression of being nebulous”. Most of the time the proof comes from questionnaire feedback from students. In many studies, such research into student attitudes covers mainly feelings of support or resistance to the practice, whilst elsewhere there is evidence where one can clearly see some educational benefit. Gielen, Dochy, and Onghena (2011) argued that students might gain fresh ideas from seeing other students’ work. Topping contended that feedback from fellow students might be more comprehensible, since it comes from their peers. Higgins (2000) suggested that the power imbalance between tutors and students might mean that students exhibit a ‘emotion-defence system’ when they receive feedback from tutors, which they might not experience when it is received from peers. Peer feedback is also likely to be released more quickly and therefore, whatever limitations there might be in the marking capability of the assessor, the timeliness of the feedback will be some compensation for it (Gibbs & Simpson, 2004). Pryor and Lubisi (2002) suggested that having to evaluate other students and express those evaluations makes them cognitively operate at an evaluative level and to pose metacognitive questions. Stiggins(1987) said “‘Once students internalise performance criteria and see how those criteria come into play in their own and each other’s performance, students often become better performers”.
17
Hanrahan and Isaacs (2001) identify a recurring theme of students’ feedback to peer assessment as being “productive self-critique”. They quoted one student in their study saying “You realise what markers are looking for (a new experience for me and very valuable) and are forced to acknowledge whether or not the factors which must be in your essay are present”. Sambell, McDowell, and Brown (1997) suggested that peer assessment can help students with self-assessment: “The experience of being a peer assessor can be considered as a precursor to becoming a skilled self-assessor”. As can be seen, the predominant method of data collection used to assess whether PA increases student learning has been self-report.
2.2.4
Logistics and Constellations
This relates to what is necessary for successful peer evaluation. Cheng and Warren (2005) persuasively argued for the need for a lot of training for students, if they are to become comfortable with peer evaluation. They cite Williams (1992) and Forde (1996) giving substantial induction in peer evaluation to head off the kinds of anxieties that are often expressed in surveys of student attitudes. Further logistical considerations relate to the marking instrument used. Falchikov and Goldfinch (2000) found evidence that the more specific the marking rubric, the less likely it is to result in high correlation.
As mentioned before, it is Topping who established a rigorous classification system for types of peer assessment, which is probably the most relevant for the analysis of PA logistics. The key terms for this study are:
Focus (quantitative/qualitative);
Product (what is being assessed);
Relation to staff assessment (substitutional or supplementary);
Official weight (contributes to grade or not);
Directionality (one-way, reciprocal or mutual);
Privacy (anonymous or confidential);
Contact (distant or face to face);
Constellation Assessors (individual or group);
Constellation Assessed (individual or group),
Place and Time
18
While Topping’s classification system works well for most of the implementations of peer assessment, some recent papers on “Comparative Judgement” (CJ) have demonstrated a method that is difficult to classify according to his schemes. In this process students are merely given pairs of students’ work and asked to say which the best is: a process by which (after a number of iterations and a suitable
aggregating function) an overall ranking can be produced. Studies of this kind include those of Jones and Alcock (2014), Pollitt (2012) and Seery, Canty, and Phelan (2012) The theory behind this approach is best expressed in Pachur and Olsson (2012).
Thus far, the broad literature in relation to PA across all subjects and disciplines has been covered. Some initial conclusions can be made including:
student and tutor marks are likely to be more convergent around academic products rather than processes,
there are ways of measuring convergence,
that certain criteria when applied may produce greater agreement than others and also
some measures for checking the presence of non-academic factors in peer marks.
There have been many claims about the benefits of peer assessment, but evidently the level of rigour in the associated studies is questionable in many cases. Moreover, there would appear to be a wide variety of types of PA currently practiced in the university sector across the world. At this point, the focus is turned towards the field of computer science.
2.3
Peer Asssessment in Computer Science
The same drivers that led to PA in other disciplines, can also be argued to exist in computer science and IT. Firstly, peer evaluation of code is a well-established quality control mechanism in software
enterprises. Secondly, a whole framework of programming, XP (Extreme Programming) has core principles of collaboration and buddy programming, and involves an almost continuous process of peer review (Beck, 2000). Additionally, like all other subjects, the discipline has had to confront the difficulty of high staff student ratios and the need for smarter forms of assessment to generate sufficient and appropriate feedback.
2.3.1
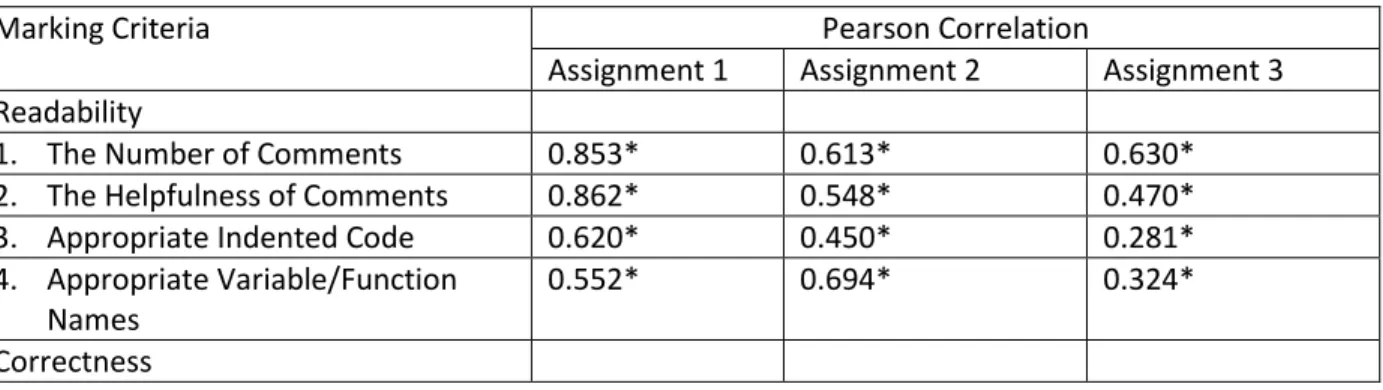
Peer Marking – Study by Sitthiworachart and Joy
An interesting study was undertaken in by Sitthiworachart and Joy (2004), who established an online system where students could write simple Unix programs, which would then be marked by a peer,