Volume 10 Issue 2
6-2018
Less Is More: How Grantmakers Are Using Simple Financial
Less Is More: How Grantmakers Are Using Simple Financial
Metrics
Metrics
Hilda H. Polanco FMA Luther K. Snow Independent ConsultantFollow this and additional works at: https://scholarworks.gvsu.edu/tfr
Part of the Nonprofit Administration and Management Commons, Public Administration Commons,
Public Affairs Commons, and the Public Policy Commons Recommended Citation
Recommended Citation
Polanco, H. H., & Snow, L. K. (2018). Less Is More: How Grantmakers Are Using Simple Financial Metrics.
The Foundation Review, 10(2). https://doi.org/10.9707/1944-5660.1414
Copyright © 2018 Dorothy A. Johnson Center for Philanthropy at Grand Valley State University. The Foundation Review is reproduced electronically by ScholarWorks@GVSU. https://scholarworks.gvsu.edu/tfr
To
ols
Less Is More: How Grantmakers Are Using
Simple Financial Metrics
Hilda H. Polanco, C.P.A., FMA; and Luther K. Snow, M.B.A, Independent Consultant
Keywords: Due diligence, tools, fiscal health, nonprofit finance, financial metrics, grantmaking, liquidity, liquid
unrestricted net assets
Introduction
The assessment of the financial health of nonprofits has always been part of good grantmaking procedure. But financial evalu-ation can be challenging for grantmakers, for three reasons.
First, nonprofit finance is notoriously compli-cated. While fund accounting and nonprofit financial systems are largely designed to ensure the good stewardship of charitable funds, non-profit financial statements are not as well suited to understanding a nonprofit’s financial circum-stances or strategy. Second, grantmaking staff vary in their capacity to incorporate financial evaluation into grant assessments. Staff must be conversant in many factors of nonprofit activity, especially in program strategy. Smaller founda-tions may not be able to afford to hire financial experts. Larger foundations may employ both programmatic and financial experts, but they must figure out how to get them to talk to one another to connect and coordinate the different elements of evaluation. And third, every appli-cant is different. Nonprofit business models can vary dramatically, even within the same pro-gram area, and organizations’ leaders are often more focused on programs than finance. Even those who are on top of their financial strategy are not always as capable of communicating that strategy to others.
In recent years, we have seen a growing exploration of key performance indicators for nonprofits, both for nonprofit management and grantmaking. Much of that work has centered on program performance and organizational
Key Points
• This article explores how the Financial
Health Analysis Tool can bridge the gap between the capacity of grantmakers to conduct financial analysis and the need to incorporate financial considerations into both grantmaking and ongoing engagement with grantees.
• The tool presents four years of key financial
indicators in graphs and charts that create a kind of dashboard of a nonprofit’s financial health over time. This small set of simple metrics highlights patterns and trends that can help grantmakers and nonprofits see how the financial management of an organization is advancing its mission and strategy.
• Using a series of interviews with a group of
early users of the tool, this article looks at how these metrics are deployed in practice by grantmakers and illustrates three areas where they can be of particular utility: due diligence and evaluating grants; capacity building; and recognizing larger patterns and opportunities.
capacities. But, along with those concerns, there has been a renewed emphasis on finan-cial health. For example, the “Performance Imperative,”1 an influential framework
intro-duced in the book Leap of Reason, by Mario Morino, establishes seven “pillars” of high per-formance, one of which is “financial health and sustainability” (Morino, 2011). As Morino told us in a telephone interview, “Understanding the financial health of an organization is critical
To
ols
to knowing whether it can deliver on the pro-grammatic goals it establishes in its mission” (M. Morino, personal communication, April 13, 2017). The Leap of Reason Ambassador Community is developing the Performance Imperative Organizational Self-Assessment (PIOSA), designed to help organizations’ leaders measure their standing and progress.2
A renewed, sectorwide emphasis that sees finan-cial health as integral to nonprofit performance has led to new efforts to capture and present financial data in simple metrics that are easier to communicate, track, and compare. Helpfully, this emphasis has in many cases been tied to a recognition that the high-level financial literacy required to both present and interpret financial data is in short supply, among both foundation program staff and the leaders of nonprofits to whom they make grants.
This article explores the impact, in the words of users themselves, of one effort to capture and present nonprofit financial data in the form of a free and accessible Excel-based tool. The Financial Health Analysis Tool emerged from an initiative funded by the Wallace Foundation and was developed by FMA, a national consult-ing firm that provides financial management services and strategy to nonprofit organizations and grantmakers.3 The tool is part of an effort to
bridge the gap between the often-limited capacity of grantmakers to conduct financial analysis and the need to incorporate financial considerations into grantmaking decisions as well as ongoing engagement with and support to grantees.
Financial Metrics in Nonprofit
Performance
Metrics, in this context, are numbers that sum-marize or measure some aspect of nonprofit con-dition or performance. Grantmakers are called on to review a variety of sources of data in evalu-ating opportunities to support current and pro-spective grantees. At the most basic level, metrics can help simplify that job, save grantmakers time and expense, and allow them to evaluate more opportunities or consider an even wider array of factors in making their decisions.
Developing metrics on financial health and strategy is different from developing metrics on program performance. Financial statements are already made up of measures and num-bers. Simple presentation of financial attributes requires identifying numbers that sum up or rep-resent the essence of more complex concepts. There are three types of financial metrics:
• Result metrics, which lift a total directly
from financial statements;
• Relational metrics, which illustrate the
rela-tionship between two or more figures from statements; and
• Summative metrics, which indicate overall
fiscal health and strategy.
There are advantages and disadvantages to each type of financial metric, so to rely on a single, one-dimensional score can bias or misinform grantmaking. A simple financial tool can deliver on both basic and “big picture” benefits by pre-senting a mix of these three types of metrics.
A renewed, sectorwide
emphasis that sees financial
health as integral to nonprofit
performance has led to new
efforts to capture and present
financial data in simple metrics
that are easier to communicate,
track, and compare.
2 The PIOSA can be found at http://leapambassadors.org/products/piosa.
3 The Financial Health Analysis Tool is hosted and available for download at http://StrongNonProfits.org, an online resource library developed as part of the Strengthening Financial Management Initiative (Devine, 2016).
To
ols
A basic kind of financial metric is a result figure lifted directly from financial statements. The traditional example of this is operating surplus or deficit, sometimes called the “bottom line.” This metric specifies the difference between an organization’s revenues and expenses for a year, and we speak colloquially of it when we say a nonprofit is “in the black” or “in the red.” Grantmakers recognize that this metric can be a useful indicator of viability and fiscal manage-ment. At the same time, a single year’s bottom line can be a misleading indicator of long-term or overall financial health.
A more advanced kind of financial metric is a relational figure, such as a ratio or a percentage calculated from two or more numbers drawn from financial statements. Relational metrics reveal interesting connections between distinct aspects of an organization’s finances. “Functional expense mix,” for example, communicates per-centages of expenses devoted to program, fund-raising, and administrative functions. Similarly, the “operating revenue mix” presents percent-ages of revenue drawn from various sources, such as individual donors, foundations, pub-lic institutions, and from enterprise earnings. Metrics that express a resource in terms of its value in time are also relational, such as “months of cash on hand.” There are many other exam-ples of relational metrics that specialists have devised or recommended for the analysis of non-profit finances.4
A third, higher-level metric is a summative met-ric, which stands as a proxy for overall finan-cial health and strategy. The Finanfinan-cial Health Analysis Tool foregrounds one such metric: months of liquid unrestricted net assets (LUNA), which are calculated by taking the amount of unrestricted net assets on hand at any time and subtracting the illiquid net assets — those that can’t be easily sold or turned into cash. Months of LUNA is calculated by dividing that number by the average monthly operating expenses of the organization (Polanco, 2012).
LUNA is a useful indicator of both financial health and strategy (Polanco & Summers, 2016). On the one hand, LUNA is an indicator of the ability of an organization to withstand a tempo-rary shortfall. Like a “rainy day fund” indicator, months of LUNA measures the liquid reserves that an organization could draw on to cover its expenses. On the other hand, the level of LUNA reserves stands as a kind of summary of the orga-nization’s financial practices over time. LUNA reserves are generated when an organization earns a net operating surplus. In any year when an organization suffers an operating deficit, LUNA reserves must be drawn down to cover
A third, higher-level metric is
a summative metric, which
stands as a proxy for overall
financial health and strategy.
The Financial Health Analysis
Tool foregrounds one such
metric: months of liquid
unrestricted net assets (LUNA),
which are calculated by taking
the amount of unrestricted net
assets on hand at any time
and subtracting the illiquid net
assets — those that can’t be
easily sold or turned into cash.
Months of LUNA is calculated
by dividing that number by
the average monthly operating
expenses of the organization.
4 See, e.g., Analyzing Financial Information Using Ratios, by Kate Barr, at https://www.propelnonprofits.org/resources/ analyzing-financial-information-using-ratios, and Top Indicators of Nonprofit Financial Health, by Peter Kramer, at http:// www.nonprofitfinancefund.org/blog/top-indicators-nonprofit-financial-health
To
ols
the loss. Thus, if an organization has an unusu-ally low LUNA reserve, it has been operating close to the edge. But if an organization’s LUNA balance is unusually high, that suggests the orga-nization could afford to reinvest its resources in capacity building, research, and development. In this sense, the LUNA metric communicates summative information about a nonprofit’s over-all strategy and fiscal-management approach. Results metrics, relational metrics, and summative metrics each have their uses, but each is also limited. They don’t tell the whole story. That’s why reliance on one-dimensional “scores” like “overhead rate” can be deceiving and counterproductive, and can end up wast-ing rather than savwast-ing time (Arneal, 2016). In the end, metrics should be used in tandem with financial statements and conversation. But taken together, a small set of simple metrics can help grantmakers and nonprofits highlight patterns and trends in finances that go beyond what even long financial statements reveal.
A simple approach like the Financial Health Analysis Tool can do more than just save time and effort. It can help us understand how the mission and strategy of an organization are working in its business model, and how the financial management of an organization is advancing its mission and strategy. That enables grantmakers to focus on the strategic fit between a grant and the nonprofit’s financial direction. By presenting a key set of metrics in a way that most people can understand, the tool also sets up a kind of common language among stakeholders. Program staff and finance staff, management and board members, or grantmakers and grantees can look at the same tool together and use it to talk about what an organization has been doing, how it is working, and what opportunities that opens up for better and more effective work in the future.
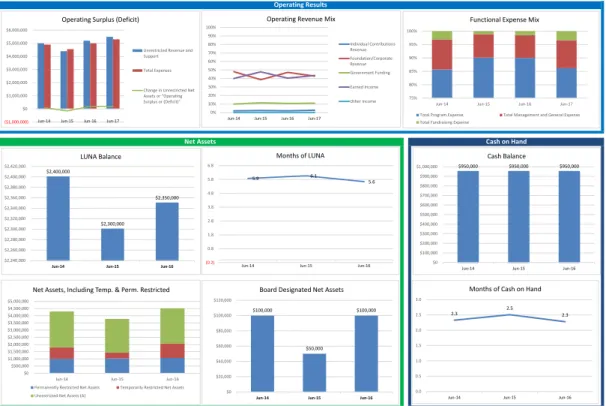
The Financial Health Analysis Tool The Financial Health Analysis Tool serves as a kind of graphic dashboard of a nonprofit’s finan-cial health over time. The tool is both simple to generate and easy to understand, presenting four years of a nonprofit’s key financial indicators in
graphs and charts that can be viewed together on a single page. (See Figure 1.) The tool can be downloaded, free of charge, as a Microsoft Excel spreadsheet “workbook,” with a page for inputs and another for output. Instructions are included, and there is an instruction video on the same page as the download.
Simple Data Input
A key benefit of the Financial Health Analysis Tool is that inputting the necessary data is sim-ple. No special financial knowledge is necessary to generate the results; all that is required are copies of the organization’s most recent finan-cial audit, current-year finanfinan-cial reports, and budget for the coming year. Typically, the audit will include two years of information, the cur-rent-year financial report will include a third year, and the budget will project a fourth, result-ing in four years of information. A few of the tool metrics are not generally available from the bud-get, so those will include only three years of data. In color-coded graphs, the output page calculates and presents nine key performance indicators in three categories: operations, net assets, and cash on hand. The nine graphs represent what are, in FMA’s judgement, the data points that most succinctly and completely summarize an organization’s financial health over time. In addition to such common indicators as operating surplus/deficits and months of cash on hand, the graphs show changes in the operating revenue mix (individual, foundation/corporate, govern-ment, earned, and other) and functional expense mix (program, management and general, and fundraising). They also illustrate net assets (restricted, temporarily restricted, and unre-stricted), any board-designated net assets, and the LUNA metric.
LUNA is a key financial metric: All of the grantmakers interviewed for this article cited its significance in evaluating the financial health of current and potential grantees. Jennifer Hoos Rothberg, executive director of the Einhorn Family Charitable Trust, called LUNA “one of the single best indicators out there to assess a nonprofit’s health and sustainability.”
To
ols
Synthesizing Practitioner Insights
The Financial Health Analysis Tool is rela-tively new. FMA has developed and tested it in client work over recent years, added it in 2017 to the StrongNonprofits.org library for use by nonprofits and foundations, and continues to apply the tool in client work and provide training on its use to nonprofits and foundations.5
To get a sense of how simple financial metrics are deployed in practice by grantmakers using this tool, we conducted a series of interviews with early users. Their insights are synthesized here to illustrate three areas of professional interest to grantmakers where simple financial metrics can be of great utility in clarifying conversations and making decisions. The seven early users who contributed their insights are:
• Jennifer Hoos Rothberg, executive director, the Einhorn Family Charitable Trust; • Padmini Parthasarathy, program director,
the California Wellness Foundation;
• Jeff Paquette, chief financial officer and chief operating officer, Youth INC;
• Katrina Huffman, chief program officer, Youth INC;
• Melissa Litwin, program director, the Henry and Marilyn Taub Foundation; • Julia A. Stoumbos, program officer, the
Henry and Marilyn Taub Foundation; and • Nicole Kyauk, senior program officer, the
East Bay Community Foundation.
Cash on Hand Net Assets Operating Results ($1,000,000) $0 $1,000,000 $2,000,000 $3,000,000 $4,000,000 $5,000,000 $6,000,000
Jun-14 Jun-15 Jun-16 Jun-17
Operating Surplus (Deficit)
Unrestricted Revenue and Support Total Expenses
Change in Unrestricted Net Assets or “Operating Surplus or (Deficit)” 0% 10% 20% 30% 40% 50% 60% 70% 80% 90% 100%
Jun-14 Jun-15 Jun-16 Jun-17
Operating Revenue Mix
Individual Contributions Revenue Foundation/Corporate Revenue Government Funding Earned Income Other Income 75% 80% 85% 90% 95% 100%
Jun-14 Jun-15 Jun-16 Jun-17 Functional Expense Mix
Total Program Expense Total Management and General Expense Total Fundraising Expense
5.9 6.1 5.6 (0.2) 0.8 1.8 2.8 3.8 4.8 5.8 6.8
Jun-14 Jun-15 Jun-16
Months of LUNA 2.3 2.5 2.3 0.0 0.5 1.0 1.5 2.0 2.5 3.0
Jun-14 Jun-15 Jun-16
Months of Cash on Hand
$2,400,000 $2,300,000 $2,350,000 $2,240,000 $2,260,000 $2,280,000 $2,300,000 $2,320,000 $2,340,000 $2,360,000 $2,380,000 $2,400,000 $2,420,000
Jun-14 Jun-15 Jun-16
LUNA Balance $950,000 $950,000 $950,000 $0 $100,000 $200,000 $300,000 $400,000 $500,000 $600,000 $700,000 $800,000 $900,000 $1,000,000
Jun-14 Jun-15 Jun-16
Cash Balance $100,000 $50,000 $100,000 $0 $20,000 $40,000 $60,000 $80,000 $100,000 $120,000
Jun-14 Jun-15 Jun-16
Board Designated Net Assets
$0 $500,000 $1,000,000 $1,500,000 $2,000,000 $2,500,000 $3,000,000 $3,500,000 $4,000,000 $4,500,000 $5,000,000
Jun-14 Jun-15 Jun-16 Net Assets, Including Temp. & Perm. Restricted
Permanently Restricted Net Assets Temporarily Restricted Net Assets Unrestricted Net Assets (A)
FIGURE 1 Sample Output Dashboard
5 For example, an overview training webinar on the tool was produced for the Emerging Practitioners in Philanthropy (2017) series.
To
ols
These sources represent a range of foundations — large and small, family foundations, a com-munity foundation, and a venture philanthropy — and a variety of styles and approaches to using the tool. Some apply the tool across the organi-zation and equip all staff to use it; in other cases, one or a few staff sought out the tool and train-ing directly. Their financial experience ranges from general to expert. In some cases, foundation staff run the tool themselves using information provided by nonprofit grant applicants. In other cases, the foundation trains and asks nonprofits to populate it with their own numbers. Finally, some are applying the tool to groups of grantees either as a learning cohort or as an investment in a field or portfolio.
Three Benefits for Grantmakers
How are grantmakers using this tool, and how beneficial are these simple financial metrics to their grantmaking? In our synthesis, we iden-tified three categories of benefit described by
our sources: due diligence in the grantmaking process; capacity building, internally and with grantees; and as a data aggregator for identifying trends and opportunities across a portfolio of grantees. In every case, grantmakers emphasized the tool’s role in communication and the impor-tance of creating a shared language for talking about financial matters.
Performing Due Diligence and
Evaluating Grants
The grantmakers said they are finding the tool helpful in assessing the financial health of grant applicants. But they are using the financial metrics less as a screen than as a window into the circumstances and strategies of their grantees. Grantmakers perform due diligence to ensure that a nonprofit is ready and able to use grant funds. Most of the grantmakers we spoke with emphasized their due diligence work and the protection of donors or endowed funds. The tool gives grantmakers a clear picture of a grantee’s financial-management practices while allowing them to forecast the effects of the scale and tim-ing of a grant on an organization’s financials. For grantmakers, due diligence is not just a compliance process; it also works in the interest of grantees. Katrina Huffman, of Youth INC, pointed out that a grant can hurt a nonprofit if it is made at the wrong scale or for the wrong purpose. She cited the case of a nonprofit that received a grant to hire a development director; the organization, however, wasn’t large enough at that time to make proper use of a dedicated development director and the change led to unproductive staff relationships. Had Youth INC been able to easily contextualize an investment in development relative to other financial trends in the organization, Huffman said, the tool might have helped avoid that kind of problem. The Financial Health Analysis Tool helps assess an organization’s baseline qualifications to receive a grant. But the conversation doesn’t end there. The grantmakers all said that financial health is not a black-and-white determination, and that they use the tool as an opportunity to spark a discussion. Nicole Kyauk, of the East Bay
In our synthesis, we identified
three categories of benefit
described by our sources: due
diligence in the grantmaking
process; capacity building,
internally and with grantees;
and as a data aggregator
for identifying trends and
opportunities across a portfolio
of grantees. In every case,
grantmakers emphasized the
tool’s role in communication
and the importance of creating
a shared language for talking
about financial matters.
To
ols
Community Foundation, said her financial anal-ysis is “not to penalize or catch applicants, but to make good decisions.” Melissa Litwin, of the Taub Foundation, concurred; the tool “is not a ‘gotcha,’” she said, “but a way to get to partner-ship more quickly.” Rothberg, of the Einhorn Family Charitable Trust, said the tool helps staff perceive what is special and important for each organization — information that “isn’t good or bad,” she said, but that gives staff the insights nec-essary to relate a nonprofit’s financial health and strategy to other elements of its performance. A snapshot view of an organization is one of the tool’s benefits, but the grantmakers said they also value how it combines information on the past, present, and future in a way that can be helpful for charting a sustained relationship with an organization. Jeff Paquette, of Youth INC, said “the four-year trend information is so valu-able because it provides us with the integration and synthesis we are looking for.” Litwin echoed that sentiment:
We want to see how our support can help. If the tool shows an organization is growing in fiscal strength, the projects we fund can be part of that growth. If an organization’s finances are flat, fund-ing may help the group invest in the future. The grantmakers we interviewed were partic-ularly enthusiastic about how the tool enables them to track and understand a nonprofit’s LUNA. Paquette said that while he has tracked “months of working capital” before, he knows that figure can be deceptive because it doesn’t exclude cash earmarked for specific purposes (i.e., restricted). He added that he had never before seen the “instant translation of organiza-tional health into a visual” that is provided by the graph showing LUNA reserves over time. Padmini Parthasarathy, of the California Wellness Foundation, also focused on the LUNA reserves, citing research her organization did showing that grantees that received core sup-port were much more likely to have weathered the recent economic recession (Angeles, 2013). Whether an organization is granted money for reserves or builds them by creating surpluses,
LUNA can be a quick and reliable measure of its capacity for resilience.
The grantmakers use the tool to relate more commonplace indicators, like operating surplus or deficits, with other indicators, such as the functional expense mix. “We know that people look at ‘low overhead’ as a plus for nonprofits, but we also use the functional-expenses graphs to ask when overhead might actually be too low,” Paquette said. Taken with operating results, he said, the functional expense mix trends might support a nonprofit’s strategy to invest in fund-raising and stronger core systems.
Building Capacity
The grantmakers were strongly positive about how the Financial Health Analysis Tool has helped to build the internal capacity of founda-tion staff and to communicate to board members the financial story behind a grant.
Foundation staff who specialize in program analysis or who must wear several hats said the tool strengthens their financial understand-ing, builds their confidence, and leverages their knowledge in other areas. Litwin, of the Taub Foundation, is part of a small staff who must each perform diverse functions. “Cash flow is intuitive to me,” she said, “but different 990 tax returns and audits can be a lot more challenging to interpret.” Litwin said the tool helped her to “get comfortable quickly” with key indicators: “It’s given me a way to take the temperature of an organization, and see if I need to dig deeper.” Understanding the indicators, she said, “has
Foundation staff who
specialize in program analysis
or who must wear several hats
said the tool strengthens their
financial understanding, builds
their confidence, and leverages
their knowledge in other areas.
To
ols
Shared financial metrics can help unify staff analysis and facilitate teamwork. Einhorn’s Rothberg said that the trust is focused on helping nonprofits become and remain “high-perform-ing organizations.” She said that the trust’s staff, primarily generalists, know finance but were challenged to assess financial information consis-tently across prospective and current grantees. The tool gives staff a shared set of information that functions like a common language across team responsibilities for relating finances to program and organizational strengths and strat-egies. Using the tool “opens opportunity for collaboration,” Rothberg said, and builds team-work among staff that deepens understanding throughout the grantmaking process.
As of now, Rothberg said, trust staff enter the data for the tool themselves rather than burden-ing their nonprofit partners with that part of the process. Moreover, she said, by running the tool and reviewing the results, staff are “learning by doing.” Rothberg said the tool has been “incred-ibly useful” in building staff team capacity and that, over time, the trust will be assessing ways to use the tool in partnership with its grantees to make that relationship even more transparent and robust.
The tool also gives grantmaking staff a better way to share financial information with board members. Huffman said she uses financial metrics and the tool in conversations with the Youth INC board, and said it helps clarify and simplify case presentations and helps the board decide when to support riskier grants. Since the Youth INC board members are also donors and donor representatives, Huffman said, the presen-tation experience helps Youth INC staff relate to what grantees encounter when they use the tool and simple metrics to tell their stories to their own donors.
Several of the grantmakers said they have used what they’ve learned from simple financial metrics to tailor their support to a nonprofit’s cir-cumstances and strategy; low LUNA reserves, for example, can inform grant design. Parthasarathy, of Cal Wellness, said she reviewed the applica-tion of a nonprofit who ended the past year in allowed us to move forward on good
invest-ments with more confidence.”
Parthasarathy, of Cal Wellness, said she doesn’t love numbers, but, as a public health professional trained in epidemiology, she does love graphs. She fills in the numbers from the financial state-ments and said she feels empowered by her grasp of the graphic-form results the tool generates. She sees where the numbers go and how they relate. And, as she connects this information to the stories and program characteristics of nonprofits, she “gets it.” Now, when she looks at a nonprofit’s Financial Health Analysis dash-board, she said, “I can see it in a minute.” Huffman, of Youth INC, said she likes how the tool complements the venture philanthropy’s data-driven approach. “When we talk about metrics in philanthropy, we are usually referring to program metrics,” she said. “But the Financial Health Analysis Tool shows how complex orga-nizational finances can be analyzed around some simple summary metrics.”
Staff with various roles and specialties use the tool to work better together. Kyauk said that the East Bay Community Foundation trains staff and grantees in the use of metrics like LUNA as part of its effort to provide more than just monetary sup-port to its community partners. She said she’s seen how the tool has empowered staff and grantees, calling it “a tangible product that is easy to use.”
Several of the grantmakers said
they have used what they’ve
learned from simple financial
metrics to tailor their support
to a nonprofit’s circumstances
and strategy; low LUNA
reserves, for example, can
inform grant design.
To
ols
the black but still showed very low reserves at yearend. This encouraged her to discuss strate-gies with the nonprofit for building fundraising capacity and to structure a core operating sup-port grant to supsup-port those strategies. Litwin, of the Taub Foundation, related a similar situation: The tool highlighted how state budget cuts had impacted the LUNA reserves of a nonprofit, lead-ing Taub to help boost a fundraislead-ing campaign. Strong LUNA reserves can also inform grant design. Huffman shared an example of a youth-serving agency that had built up extraor-dinary LUNA reserves. With technical assis-tance and targeted grant support, that nonprofit decided to reinvest some reserves in hiring staff with more on-the-ground experience and in developing some evaluation tools designed to help build donor support over the longer term. Cal Wellness had a case of an organization show-ing 95 percent program expenses over time; the information led Parthasarathy to ask about the load on program staff and initiate a conversation with the grantee about using a core operating support grant to build management and fund-raising operations.
The tool also helps grantmakers communicate with grantees, by preparing them, identifying important questions, and, in cases where the grantee also uses the tool, providing a com-mon language for staff-board communication. Discussions about simple metrics can help break the ice with grantees. Julia A. Stoumbos, of Taub Foundation, said she “found the tool particularly useful with several new grantees over the past years, when I needed more details on their financial health and wanted to get to a sense of how they communicate with partners.” Parthasarathy, of Cal Wellness, said,
Now that I know the right questions to ask, I get to the real issue. Grantees are almost always able to explain and discuss the issues I notice. But I think of all the things I would have missed if I hadn’t known to ask. Grantees appreciate the good finan-cial questions. I had a grantee recently who said to me, “No one ever asked us that before,” when I asked a question about the revenue mix. That got us talking about strategies for balancing and sus-taining revenue.
When a grantmaker also trains nonprofits in the use of the tool, as the East Bay Community Foundation does, then it might communicate bet-ter with grantees. “Using the tool with our grant-ees means we’re speaking the same language,” Kyauk said. “That means grantees can tell their story in ways that are a lot deeper, and we can shed light on issues we might have overlooked.” The grantmakers observed that nonprofit boards are not always conversant with finances. The graphics-aided presentation of simple financial metrics can help orient and engage those board members. Huffman, of Youth INC, shared a story of a youth agency that reviewed its own results before a site visit, leading to a good con-versation among the staff and the board that participated in the visit; Huffman said she was impressed by the knowledge and insight dis-played by board members.
While the grantmakers we spoke with empha-sized the importance of building their own and colleagues’ internal capacity, they were quick to note that their nonprofit partners and grant-ees build financial management capacity when they complete and submit the tool themselves as part of an application or investment process. “Capacity building starts at the application,” Huffman observed.
Perhaps the biggest benefit to nonprofits is how graphic illustration of simple metrics helps clar-ify the relationship between an organization’s finances and its strategy for accomplishing its mission. When financial management seems technocratic, finances can seem to be removed from operations. By making financial informa-tion easier to understand, the grantmakers said, the tool helps leaders see how their programs and missions generate revenue to sustain the organization, and how their finances make those program efforts possible. Kyauk, of the East Bay Community Foundation, said she believes that the LUNA metric is particularly useful in help-ing organizations understand their position and direction. When staff and board leaders are dis-cussing LUNA and their sustainability strategy, she said, “that elevates the conversations and engages the board in powerful ways.”
To
ols
The grantmakers said they believe that train-ing and practice with simple financial metrics will help nonprofits make their case with other funders, donors, and supporters. “If nonprofits can tell their story with us,” Kyauk said, “we think they will be better prepared to engage the community and leverage other funding.”
Recognizing Larger Patterns and Opportunities
Even as grantmakers are starting to build expe-rience in applying the tool with individual nonprofits, they are acting on ideas to expand its use in larger applications.
Huffman, of Youth INC, has observed several youth organizations whose finances indicate an opportunity to grow by adding expert fund-raising staff. But when she compared financial metrics like scale and growth with their organi-zational charts, she said, such a hire did not seem advisable. So, Huffman is working to assist these organizations through the Youth INC capaci-ty-building process and keeping an eye out for a collaborative opportunity, such as sharing a development director among several nonprofits. Litwin, of the Taub Foundation, said she sees similar potential for a group of early childhood development centers facing market shifts and public policy changes: “If we see trends across groups, that may suggest we consider joint mar-keting, fundraising, or public education efforts across the field.”
The East Bay Community Foundation has already engaged a cohort of community nonprofits in financial management training focused on the tool and LUNA. Kyauk noted that this process has engaged the finance staff and leaders of nonprofits, who aren’t often included in community collaboration efforts. She is tracking the progress of this effort to see how nonprofits continue to share and collaborate, and to see if the growing capacity of the group helps lift good nonprofit work in the East Bay community. Rothberg, of the Einhorn Family Charitable Trust, said she sees potential in another kind of collective perspective — portfolio analysis: What if the trust could summarize the key financial
indicators for all its grantees in a portfolio, using a kind of portfolio-level Financial Health Analysis Tool? It would give the board a new level of information and insight to help the staff identify patterns and trends across the portfolio, and inform foundation strategy in a new way. And Paquette said he has considered the possibil-ity of running Youth INC’s own finances through the tool. He raised an interesting question for future exploration: How would simple financial metrics help grantmakers lead and direct their own grantmaking operations?
Renewing Nonprofit Finance: A
Change in the Wind?
The grantmakers interviewed for this article enthusiastically embraced the use of simple, key financial metrics as tabbed and illuminated by the Financial Health Analysis Tool. They reported that the tool saves staff time, facilitates teamwork, and increases the capacity to evaluate opportunities and make good investments. The tool appears flexible enough to be useful to small and large foundations, to individual staff and entire teams, and to community foundations, venture philanthropies, and family foundations. Key financial indicators and simple utilities like the Financial Health Analysis Tool will never replace complete nonprofit financial statements and in-depth analysis — it is a complement to traditional statements. However, the reception it has received suggests that philanthropies and nonprofits are hungry for these kinds of tools and metrics. Early indications are that a simple, visual utility like the Financial Health Analysis Tool can actually deepen grantmaker understanding and strengthen grantmaking practice, and demon-strate that fiscal management needn’t be confined to experts or isolated from nonprofit strategy.
To
ols
References
Angeles, F. (2013, March 6). Why this foundation believes in the importance of core operating support for grantees [Web log post]. Retrieved January 31, 2017, from https://www.healthaffairs.org/do/10.1377/ hblog20130306.028944/full
Arneal, L. (2016, July/August). Myth busters: Why donors shouldn’t rely on the overhead ratio. Nonprofit Hub Magazine. Retrieved from http://nonprofithub. org/fundraising/myth-busters-donors-shouldnt- rely-overhead-ratio
Devine, N. (2016). The groundwork for successful cohort-based fiscal capacity-building: An evaluation of the Strengthening Financial Management Initia-tive. The Foundation Review, 8(1), 40–47. https://doi. org/10.9707/1944-5660.1282
Emerging Practitioners in Philanthropy. (Producer). (2016). Understanding a nonprofit’s financial trends and health [Video webinar]. Retrieved from http://www. epip.org/webinar_recap_financial_health_dash-board_orientation
Morino, M. (2011). Leap of reason: Managing to outcomes in an era of scarcity. Washington, DC: Venture Philan-thropy Partners.
Polanco, H. H. (2012, June). The key to long term finan-cial health: Liquid unrestricted net assets (LUNA). New York, NY: Nonprofit Press.
Polanco, H. H., & Summers, J. (2016, May). Keeping it in reserve: Grantmaking for a rainy day. Nonprofit Quarterly, 42–49.
Hilda Polanco, C.P.A., is founder and CEO of FMA, a
lead-ing financial management firm partnerlead-ing with nonprofits
and foundations. Correspondence concerning this article
should be addressed to Hilda Polanco, FMA, 440 Park Avenue South, 3rd Floor, New York, NY 10016 (email: [email protected])
Luther K. Snow, M.B.A., is a private consultant to
nonprofits and author who specializes in generative leader