Sensory and consumer-oriented studies on the
effect of fat in different food matrices
A comparison between yoghurt, vanilla custard,
Lyon-style and liver sausages
Dissertation zur Erlangung des Doktorgrades der
Naturwissenschaften (Dr. rer. nat.)
Fakultät Naturwissenschaften
Universität Hohenheim
Hochschule für Angewandte Wissenschaften Hamburg
Fakultät Life Sciences
Department Ökotrophologie
Universität Hohenheim
Fakultät Naturwissenschaften
Institut für Lebensmittelwissenschaft und Biotechnologie
Fachgebiet: Lebensmittel tierischer Herkunft
vorgelegt von
Maja Tomaschunas
aus Hamburg
2013
Dekan: Prof. Dr. Heinz Breer
1. berichtende Person: Prof. Dr. Mechthild Busch-Stockfisch
2. berichtende Person: Prof. Dr.-Ing. Jörg Hinrichs
3. berichtende Person: Prof. Dr. Jochen Weiss
Eingereicht am: 19.08.2013
Mündliche Prüfung am: 13.12.2013
Die vorliegende Arbeit wurde am 07.11.2013 von der Fakultät Naturwissenschaften der Universität Hohenheim als „Dissertation zur Erlangung des Doktorgrades der
„Jede Erkenntnis beginnt mit den Sinnen.“
IV
Danksagung
Zu Beginn möchte ich mich bei Frau Prof. Dr. Mechthild Busch-Stockfisch für die langjährige Betreuung sowie die fachliche Unterstützung während der gesamten Promotionszeit, aber auch für die tollen Erfahrungen, welche ich im Rahmen des Forschungsprojektes sammeln konnte, bedanken.
Prof. Dr. Jörg Hinrichs danke ich ebenfalls für die Betreuung und die damit verbundene Möglichkeit, an der Universität Hohenheim zu promovieren. Ferner bedanke ich mich für die fachlichen Ratschläge und die Unterstützung bei der Erstellung der Veröffentlichungen. Desweiteren möchte ich Prof. Dr. Weiss als Drittgutachter für dessen Betreuung und Unterstützung herzlich danken.
Ein großer Dank gilt auch Herrn Ehrhard Köhn, welcher mich mit Herzlichkeit, viel Zeit und Geduld in statistischen Fragen und Aufgabenstellungen tatkräftig unterstützt hat und mir zudem den Spaß an der Statistik näher gebracht hat.
Barbara Heikel danke ich für die gemeinsame Zeit während der Promotion, welche neben der tollen Zusammenarbeit und dem fachlichen Austausch, durch Spaß und Leichtigkeit geprägt war.
Alina Krzeminski danke ich für die angenehme Zusammenarbeit, für den Austausch über das Doktorandenleben sowie für die stets verlässliche fachliche Unterstützung.
Als „Vorbild“ gebührt auch Andrea Maaßen ein Dankeschön, welche mir desweiteren mit Rat, Tat sowie seelischer und moralischer Unterstützung zur Seite stand.
Eva Hartmann, Anna Raupach, Sabine Rojahn, Lucia Röwekamp, Anika Scharping und Rebecca Zörb danke ich für die tatkräftige Unterstützung im Rahmen Ihrer Bachelor- und Masterarbeiten.
Meinen Panelistinnen und Panelisten möchte ich für ihre stets zuverlässige Teilnahme an den vielen Verkostungen über den gesamten Forschungszeitraum danken, aber vor allem für die Freude, die sie mir im Laufe der Panelarbeit bereitet haben.
Zu guter Letzt verdienen ganz besondere Menschen einen Dank: Danuta Tomaschunas, Witold Tomaschunas und Gregor Kruszewski, ohne dessen seelische Unterstützung sowie deren Verständnis über die lange Zeit vieles erschwert und nicht erreichbar gewesen wäre. Das Forschungsvorhaben (AiF 15963 N) wurde im Programm zur Förderung der „Industriellen Gemeinschaftsforschung (IGF)” vom Bundesministerium für Wirtschaft und Technologie (via AiF) über den Forschungskreis der Ernährungsindustrie e.V. (FEI) gefördert.
V
Coauthors
Parts of this thesis were conducted in cooperation with other scientists. Prof. Dr. Mechthild Busch-Stockfisch supervised the thesis, whereas Prof. Dr. Jörg Hinrichs co-supervised the thesis. Both contributed significantly to its contents and structuring.
CHAPTER 2: Ehrhard Köhn was involved in the statistical analyses of this chapter.
CHAPTER 3: Alina Krzeminski prepared most parts of the written version of this chapter
and provided the texture data. Ehrhard Köhn assisted with the statistical analyses. Jochen Weiss supported the discussion and supervised this chapter.
CHAPTER 4: Regarding this chapter, Ehrhard Köhn supported the statistical analyses.
CHAPTER 5: Ehrhard Köhn assisted in the statistical analyses, whereas Petra Bennwitz was
involved in the studies which are presented in this chapter.
CHAPTER 6: This chapter bases on the master thesis of Rebecca Zörb. Jürgen Fischer
assisted in the description of the production process of this chapter. Ehrhard Köhn was involved in the statistical analyses of this chapter.
VI
List of publications
Parts of this thesis have been previously published with the approval of both supervisors. Peer reviewed publications
Tomaschunas, M., Hinrichs, J., Köhn, E., & Busch-Stockfisch, M. (2012). Effects of casein-to-whey protein ratio, fat and protein content on sensory properties of stirred yoghurt.
International Dairy Journal, 26(1), 31-35.
Krzeminski, A., Tomaschunas, M., Köhn, E., Busch-Stockfisch, M., Weiss, J., & Hinrichs, J. (2012). Relating creamy perception of whey protein enriched yogurt systems to instrumental data by means of multivariate data analysis. Journal of Food Science, 78(2), S314-319.
Tomaschunas, M., Köhn, E. Bennwitz, P., Hinrichs, J., & Busch-Stockfisch, M. (2013). Quantitative and qualitative variation of fat in model vanilla custard desserts: Effects on sensory properties and consumer acceptance. Journal of Food Science, 78(6), S894-901.
Tomaschunas, M., Zörb, R., Fischer, J., Köhn, E., Hinrichs, J., & Busch-Stockfisch, M. (2013). Changes in sensory properties and consumer acceptance of reduced fat pork Lyon-style and liver sausages containing inulin and citrus fiber as fat replacers. Meat Science, 95(3), 629-640.
Other publications
Krzeminski, A., Großhable, K., Tomaschunas, M., Busch-Stockfisch, M., & Hinrichs, J. (2011). Structural properties and sensory perception of stirred yoghurt systems. EDM - European Dairy Magazine, 23, 12-17.
Tomaschunas, M., & Busch-Stockfisch, M. (2012). Analytische und konsumentenorientierte sensorische Untersuchungen und Wahrnehmungen an ausgewählten Matrices und
Lebensmitteln mit unterschiedlichen Fettgehalten, In: Fettwahrnehmung und
Sättigungsregulation: Ansatz zur Entwicklung fettreduzierter Lebensmittel: Zentrale
Ergebnisse des gleichnamigen DFG/AiF-Clusterprojektes, Forschungskreis der
VII Poster presentations
Krzeminski, A., Tomaschunas, M., Busch-Stockfisch, M., & Hinrichs, J. (2010). Structural and sensory properties of yoghurt systems depending on casein to whey protein ratio. Food Oral Processing - Physics, Physiology and Psychology of Eating, July 2010, Leeds, UK. Tomaschunas, M., & Busch-Stockfisch, M. (2010). Influence of different fat contents on the sensory profiles of selected plain yoghurts. 4th European Conference on Sensory and Consumer Research, September 2010, Vitoria-Gasteiz, Spain.
Tomaschunas, M., & Busch-Stockfisch, M. (2010). Influence of different fat contents on perception of fat-related attributes and consumer acceptance of starch-based vanilla custards, 4th European Conference on Sensory and Consumer Research, September 2010, Vitoria-Gasteiz, Spain.
Tomaschunas, M., & Busch-Stockfisch, M. (2010). Influence of different fat contents on the sensory profiles of selected plain yoghurts. DLG-Lebensmitteltage, September 2010, Darmstadt, Germany.
Tomaschunas, M., Köhn, E., Krzeminski, A., Hinrichs, J., & Busch-Stockfisch, M. (2011). Effect of fat, protein and casein to whey protein ratio on sensory properties of plain stirred
yoghurt. 9th Pangborn Sensory Science Symposium, September 2011, Toronto, Canada.
Tomaschunas, M., Scharping, A., Köhn, E., & Busch-Stockfisch, M. (2011). Effect of fat content on long-term acceptability of dairy products: a comparison between plain stirred yoghurt and vanilla custard. 9th Pangborn Sensory Science Symposium, September 2011, Toronto, Canada.
Tomaschunas, M., Köhn, E., Krzeminski, A., Hinrichs, J., & Busch-Stockfisch, M. (2011). Effect of fat, protein and casein to whey protein ratio on sensory properties of plain stirred yoghurt. NIZO - Dairy Conference, September 2011, Papendal, The Netherlands.
Tomaschunas, M., Köhn, E., Krzeminski, A., Hinrichs, J., & Busch-Stockfisch, M. (2011). Effect of fat, protein and casein to whey protein ratio on sensory properties of plain stirred yoghurt. DLG-Lebensmitteltage, September 2011, Darmstadt, Germany.
VIII
Tomaschunas, M., Scharping, A., Köhn, E., & Busch-Stockfisch, M. (2011). Effect of fat content on long-term acceptability of dairy products: a comparison between plain stirred yoghurt and vanilla custard. DLG-Lebensmitteltage, September 2011, Darmstadt, Germany. Tomaschunas, M., Zörb, R., Fischer, J., Köhn, E., Hinrichs, J., & Busch-Stockfisch, M. (2012). Veränderung der sensorischen Eigenschaften und Konsumentenakzeptanz durch Fettreduzierung in Lyoner und Leberwurst. 1. HAW Forschungstag, June 2012, Hamburg, Germany.
Tomaschunas, M., Zörb, R., Fischer, J., Köhn, E., Hinrichs, J., & Busch-Stockfisch, M. (2012). Veränderung der sensorischen Eigenschaften und Konsumentenakzeptanz durch Fettreduzierung in Lyoner und Leberwurst mittels Inulin, Reisstärke und Citrusfasern. Deutscher Sensoriktag, November 2012, Neustadt (a.d. Weinstraße), Germany.
Oral presentations
Tomaschunas, M., Zörb, R., Fischer, J., & Busch-Stockfisch, M. (2012). How substitution of fat with citrus fibre and different carbohydrates in Lyon and liver sausages influences sensory properties and consumer acceptance. 5th International Dietary Fibre Conference, May 2012, Rome, Italy.
IX
Table of contents
1 Introduction, scope and outline ... 1
1.1 INTRODUCTION ...2
1.1.1 Overweight, obesity and consumers’ attitudes towards fat and fat reduced foods ...2
1.1.2 The role of fat in foods and the importance of the matrix ...2
1.2 SCOPE ...3
1.3 OUTLINE ...5
2 Effects of casein-to-whey protein ratio, fat and protein content on sensory properties of stirred yoghurt ... 8
2.1 INTRODUCTION ...9
2.2 MATERIALS AND METHODS... 10
2.2.1 Samples ... 10
2.2.2 Sensory evaluation... 10
2.2.3 Statistical analysis ... 12
2.3 RESULTS AND DISCUSSION ... 12
2.3.1 Characterization of and similarities between samples ... 13
2.3.2 Effects of and interactions between CF, CP and c/w ... 14
2.4 CONCLUSIONS ... 17
3 Relating creamy perception of whey protein enriched yoghurt systems to instrumental data by means of multivariate data analysis ... 21
3.1 INTRODUCTION ... 22
3.2 MATERIALS AND METHODS... 23
3.2.1 Stirred yoghurt preparation ... 23
3.2.2 Structural analysis ... 24
3.2.3 Sensory evaluation... 25
3.2.4 Data analysis ... 26
3.3 RESULTS AND DISCUSSION ... 26
3.3.1 Structural difference from control results ... 26
3.3.2 Sensory differences from control results ... 28
3.3.3 Correlations between instrumental and sensory data ... 29
3.3.4 Prediction of sensory attributes from instrumental data ... 32
3.4 CONCLUSIONS ... 35
4 Consumer acceptance and its relationship to sensory properties of model yoghurt systems with various casein-to-whey protein ratios, fat and protein contents ... 39
4.1 INTRODUCTION ... 40
4.2 MATERIALS AND METHODS... 41
4.2.1 Samples ... 41
4.2.2 Consumer testing ... 42
X
4.3 RESULTS AND DISCUSSION ... 43
4.3.1 Effects of CF, CP and c/w on liking... 43
4.3.2 Relation between sensory attributes and liking ... 44
4.4 CONCLUSIONS ... 47
5 Quantitative and qualitative variation of fat in model vanilla custard desserts: Effects on sensory properties and consumer acceptance ... 50
5.1 INTRODUCTION ... 51
5.2 MATERIALS AND METHODS... 52
5.2.1 Samples ... 52
5.2.2 Sensory analysis ... 53
5.2.3 Statistical analysis ... 56
5.3 RESULTS AND DISCUSSION ... 56
5.3.1 Sensory descriptive analysis ... 56
5.3.2 Consumer acceptability test ... 64
5.3.3 Relationships between sensory attributes and consumer ratings and the effect of fat on consumers’ acceptability ... 65
5.4 CONCLUSIONS ... 66
6 Changes in sensory properties and consumer acceptance of reduced fat pork Lyon-style and liver sausages containing inulin and citrus fiber as fat replacers ... 71
6.1 INTRODUCTION ... 72
6.2 MATERIALS AND METHODS... 74
6.2.1 Products ... 74
6.2.2 Sensory evaluation... 77
6.2.3 Statistical analysis ... 83
6.3 RESULTS AND DISCUSSION ... 84
6.3.1 Selected samples for descriptive analysis and consumer testing ... 84
6.3.2 Panel quality ... 86
6.3.3 Sensory profiles ... 87
6.3.4 Consumers’ acceptability ... 97
6.4 CONCLUSIONS ... 99
7 Concluding remarks, practical applicability and outlook ... 108
7.1 CONCLUDING REMARKS ... 109
7.1.1 Comparing the effects of fat on the sensory properties of the different matrices ... 109
7.1.2 Comparing the effects of fat on liking of the different matrices ... 114
7.1.3 Comparing the drivers of liking and disliking of different matrices ... 115
7.1.4 Suitability of the applied methods to substitute fat ... 118
7.2 PRACTICAL APPLICABILITY OF THE RESULTS ... 118
7.3 OUTLOOK ... 119
SUMMARY ... 122
XI
S
YMBOLS AND ABBREVIATIONS
Symbols Definition Units
c/w casein-to-whey protein ratio w/w [%]
CF fat content w/w [%]
CP protein content w/w [%]
d3,2 sauter mean diameter µm
d75,3 particles of the 75th percentile µm
d90,3 particles of the 90th percentile µm
ηapp apparent viscosity Pas
1
s rad 10
G' storage modulus at 10 rad s-1 Pa
Loop Area area of hysteresis loop Pa/s
1 s 50 τ shear stress at 50 s-1 Pa 1 s 100 τ shear stress at 100 s-1 Pa Abbreviations A appearance
AIC Akaike’s Information Criteria
ANOVA analysis of variance
BIB balanced incomplete block
CF citrus fiber
CL cluster
CRE coefficient of the regression equation
DoD Drivers of disliking
DoL Drivers of liking
I inulin
IC information criteria
MFA multiple factor analysis
n.s. not significant
O odor
PC principal component
XII
QDA quantitative descriptive analysis
Quadr. quadratic
RS rice starch
Ta taste
Te texture
UHT ultra high temperature
1
2
1.1 Introduction
1.1.1 Overweight, obesity and consumers’ attitudes towards fat and fat reduced foods
Since 1980, obesity has nearly doubled all over the world (WHO, 2013) and in at least 13 countries, more than half of the adult population is overweight (Sassi, 2010). Overweight and obesity promote the risk for cardiovascular diseases, diabetes, musculoskeletal disorders and cancer (WHO, 2013). Current data showed that 67% of men and 53% of women in Germany are overweight, with 23% of men and 24% of women being obese. This may result from an imbalance between energy intake and physical activity as well as partially from a high sugar consumption and an increased daily fat intake (35% of total calories instead of the recommended 30%), which may be caused by an increased consumption of meat and meat products as well as milk and dairy products (Heseker, 2012). Besides the responsibility of the individual for increasing the frequency of physical activity and for paying more intention to a healthier diet, the food industry can play an important role in promoting healthy diets by means of reducing sugar and fat in food (WHO, 2013). As dietary fats provide twice as much energy as proteins or carbohydrates, the reduction of fat in foods helps to reduce the total energy intake. However, the palatability of foods is often related to their fat content and consequently high-fat products are often preferred and their consumption is difficult to give up (Drewnowski, 1992; Drewnowski & Almiron-Roig, 2010), because fat contributes to appearance, texture, mouth feel and flavor properties of foods (Drewnowski, 1987). Nevertheless, consumers’ interest for energy reduced food is increasing, but nonetheless they want the products to be palatable (Akoh, 1998; Drewnowski, 1992). Therefore a similar sensory quality is needed in reduced fat foods.
1.1.2 The role of fat in foods and the importance of the matrix
The perception of fat is food-specific or rather system-specific (Drewnowski, Shrager, Lipsky, Stellar, & Greenwood, 1989; Mela, 1990; Tepper, Shaffer, & Shearer, 1994) and the effect of fat reduction depends on the type and structure of the product as well as on the extent of fat reduction (Jones, 1996). There are differences in the perception of the fat content between solids and liquids, because fat can mainly be detected by texture and mouth feel attributes, which are easier to perceive in liquid foods; in solid foods, fat tends to be hidden (Cooper, 1987; Drewnowski et al., 1989; Tepper et al., 1994). Depending on the food matrix, fat imparts various textural properties such as hard, soft, oily, juicy, elastic, thick, flaky,
3 heavy, viscous, smooth, crunchy, creamy, crispy and rich(Drewnowski, 1987; Miller & Rolls, 1996). Hence, different foods represent different matrices and in different matrices, fat exerts different effects on sensory properties, leading to different ways and options to reduce fat. Furthermore, different foods imply different consumer expectations concerning sensory properties.
What sensory properties does fat contribute to the full-fat variant? Which changes are caused due to the reduction of fat? Which food ingredients or methods are suitable to provide similar sensory properties to the full-fat counterparts? What do consumers’ expect and what are their preferences?
1.2 Scope
Since fat perception is food-specific, a detailed approach, adjusted to a particular product, is needed to meet consumers’ expectations of fat reduced foods. This study aimed to evaluate and to contrast the various effects of fat and fat reduction on sensory properties and consumer acceptance of popular meat and dairy products and to evaluate the suitability and acceptability of adapted innovative methods to reduce or rather to substitute fat. Furthermore, the drivers of liking and disliking for the different food variants were aimed to be determined.
For this purpose, a similar methodology was applied in the different surveys, illustrated in Figure 1.1: a) selection of different matrices, b) selection and application of innovative, adapted methodologies to reduce and substitute fat, c) evaluation of changes in sensory properties caused by fat reduction using descriptive analysis, d) evaluation of consumers’ acceptability of products with varying fat contents by means of consumer testing, e) determination of drivers of liking and disliking by means of relating descriptive and consumer data, and f) examination of the acceptability/suitability of the applied adapted methods to reduce fat.
Selection of the food types for the current study based on general popularity of the products, their contribution to an increased daily fat intake (by means of being a meat or dairy product) as well as on differences in the structure between the foods:
Plain stirred yoghurt. Plain stirred yoghurt is a natural dairy product and is considered as a semi-solid. The semi-solid consistency appears due to the acid coagulation of casein at the isoelectric point. In the current study, variations in the fat content were achieved by adjusting the fat content of the used milk, ranging from 0.1% to 12.0%. Sensory changes caused by fat
4
reduction were tried to be compensated by means of changing the protein content as well as by adding whey protein to the formulation, resulting in modified casein-to-whey protein ratios.
Starch-based vanilla custard. Starch-based vanilla custards are dairy dessert products and are considered as sweet jellified milk with a semi-solid consistency, which occurs due to the water binding capacity of the stabilizer. Because of their simple structure and the relatively small number of ingredients (milk, sucrose, thickeners, colorants and aroma), they are considered as useful model foods. The fat content of the model custards was modified by using milk with varying fat content as well as by adding dairy cream or a vegetable fat cream. The fat content ranged between 0.1% and 15.8%.
Lyon-style sausage. Lyon-style sausages are meat products and they are considered as soft-solids because they require chewing, but do not have “crispy” attributes (Foegeding et al., 2011). In our surveys, fat was substituted by substituting parts of back fat by lean meat as well as by adding combinations of dietary fibers (inulin and citrus fiber) as well as partially rice starch. The fat content of the sausages was varied between 3.0% and 25.0%.
Liver sausage. Liver sausage is a spreadable meat product. “A spreadable material is characterized by a more or less plastic rheology. Very loosely stated, a plastic material is a solid-like material” (Bot, Flöter, Lammers, & Pelan, 2003). In our examinations, fat was substituted by combinations of dietary fibers (inulin and citrus fiber) and partially rice starch. Fat contents of the liver sausage samples ranged between 3.0% and 30.0%.
It was hypothesized that (i) depending on the specific food, different sensory attributes are influenced by fat, (ii) that, depending on the food matrix, there are certain attributes which are affected by fat in different directions, (iii) that certain attributes are more important for consumers for some foods but less important for others, and (iv) that high-fat products are often preferred by consumers and therefore, the sensory profile of the fat reduced counterparts has to be adapted to the high-fat profile.
5
Figure 1.1: Illustration of the applied methodology to evaluate yoghurt, vanilla custard, Lyon-style and liver sausages.
1.3 Outline
This thesis focuses on the effects of fat on sensory properties and consumer acceptance of different food matrices.
CHAPTER 2
... evaluates the effects of variations in fat, protein and casein-to-whey protein ratio on sensory properties of stirred yoghurt. Additionally, it was evaluated whether fat-related properties may be imitated by variations in protein and whey protein addition.
CHAPTER 3
... presents the relationships between sensory mouth feel data and instrumental data of the stirred yoghurt systems evaluated in chapter 2.
Selection of the food matrix
Adjusted fat substitution and fat contents
Sensory evaluation: Effects of fat on sensory properties
Consumer testing: Effects of fat on liking
Relating sensory and consumer data: Identification of drivers of liking / disliking
6
CHAPTER 4
... studies the effects of variations in fat, protein and casein-to-whey protein ratio on consumers’ acceptability of the stirred yoghurt systems evaluated in chapter 2. Furthermore, drivers of liking and disliking for plain stirred yoghurt are presented.
CHAPTER 5
... describes the influence of quantitative and qualitative variations in fat on sensory properties and consumer liking of model vanilla custard desserts. Drivers of liking and disliking for vanilla custard are additionally presented.
CHAPTER 6
... identifies the effects of fat and fat reduction and the addition of inulin, citrus fiber and partially rice starch as fat replacers on sensory properties and consumers’ acceptability of Lyon-style and liver sausages. Additionally, drivers of liking and disliking for both sausage types are discussed.
CHAPTER 7
…contrasts the obtained results of the effects of fat in plain stirred yoghurt, starch-based vanilla custard as well as in Lyon-style and liver sausages and illustrates their practical applicability. Furthermore, an outlook for future research is given.
References
Akoh, C.C. (1998). Fat replacers. Food Technology, 52(3), 47-53.
Bot, A., Flöter, E., Lammers, J.G., & Pelan, E. (2003). Controlling the texture of spreads, In:
B.M. McKenna (Ed.), Texture in food. Volume 1: Semi-solid foods (pp 350-372). New York:
CRC Press.
Cooper, H.R. (1987). Texture in dairy products and its sensory evaluation. In H.R. Moskowitz (Ed.), Food texture (pp 217-250). New York: Marcel Dekker.
Drewnowski A. (1987). Fats and food acceptance: Sensory, hedonic and attitudinal aspects. In: J. Solms, D. A. Booth, R. M. Pangborn, & O. Raunhardt (Eds.), Food acceptance and nutrition (pp. 189-204). New York: Academic Press.
7 Drewnowski, A., Shrager, E.E., Lipsky, C., Stellar, E., & Greenwood, M.R.C. (1989). Sugar and fat: Sensory and hedonic evaluation of liquid and solid foods. Physiology & Behavior, 45(1), 177-183.
Drewnowski, A. (1992) Sensory properties of fats and fat replacements. Nutrition Reviews, 50(4), 17-20.
Drewnowski, A., & Almiron-Roig, E. (2010). Human perceptions and preferences for fat-rich foods. In: J. LeCoutre & J.-P. Montmayeur (Eds.), Fat detection: taste, texture and post-ingestive effects (pp. 265-291). Boca Raton, FL: CRC Press.
Foegeding, E.A., Daubert, C.R., Drake, M.A., Essick, G., Trulsson, M., Vinyard, C.J., & van de Velde, F. (2011). A comprehensive approach to understanding textural properties of semi- and soft-solid foods. Journal of Texture Studies, 42(2), 103-129.
Heseker, H. (2012). Ernährungssituation in Deutschland, In: Deutsche Gesellschaft für
Ernährung e.V. (Ed.), 2012: 12. Ernährungsbericht, (pp.19-136). Bonn: Deutsche
Gesellschaft für Ernährung e.V.
Jones, S.A. (1996). Physical, chemical, and sensory aspects of fat replacement. In: S. Roller, & S. A. Jones (Eds.), Handbook of fat replacers (pp 59-86). Boca Raton, FL: CRC Press. Mela, D.J. (1990). Sensory preferences for fats: What, who, why? Food Quality and Preference, 2(2), 95-101.
Miller, D.L., & Rolls, B.J. (1996). Implications of fat reduction in the diet, In: S. Roller, & S.A. Jones (Eds.), Handbook of fat replacers (pp 27-44). Boca Raton, FL: CRC Press.
Sassi, F. (2010). Obesity and the economics of prevention: Fit not fat. Paris: OECD Publishing.
Tepper, B.J., Shaffer, S.E., & Shearer, C.M. (1994). Sensory perception of fat in common foods using two scaling methods. Food Quality and Preference, 5(4), 245-251.
WHO (2013). Obesity and overweight. Fact sheet no. 311. Available online at http://www.who.int/mediacentre/factsheets/fs311/en/ [Accessed 2013 July 19].
8
2
Effects of casein-to-whey protein ratio, fat
and protein content on sensory properties
of stirred yoghurt
Maja Tomaschunas, Jörg Hinrichs, Ehrhard Köhn, and Mechthild
Busch-Stockfisch
Originally published in International Dairy Journal 2012, 26(1), 31-35.
AbstractThe effects of fat, protein and casein-to-whey protein ratio on sensory properties of stirred yoghurt and interactions between these three components were examined using descriptive analysis. Furthermore, the possible enhancement of fat-related sensory properties by variations in protein content and whey protein addition was studied. A study with 14 defined yoghurts was carried out. Variations in fat content (CF = 0.1, 3.5, 6.0 and 12.0%), protein concentration (CP = 3.5, 4.5 and 6.0%) and casein-to-whey protein ratio (c/w = 80/20, 60/40 and 40/60) were chosen to determine effects and relations of CF, CP and c/w for a wide product range. Results demonstrated decreasing effects concerning the attributes aromatic, sour and astringent, and increasing effects regarding graininess and yellow color, with decreasing c/w and increasing CP. An increase in CF reduced the effect of c/w. Creamy taste and texture, visual and textural viscosity, as well as fatty mouth feel, increased with increasing CF, CP and c/w. The effect of CP decreased with increasing CF. An increase in CP enhanced fat-related sensory properties whereas whey protein addition resulted in the opposite effect.
9 2.1 Introduction
The production of reduced-fat products is a high priority issue for the food industry. However, fat in food exerts important influence on appearance, flavor and texture (Drewnowski, 1987). Therefore, it is important to understand how fat may influence sensory properties and how it can be replaced or imitated.
In recent years, the consumption of fermented dairy products, like yoghurt, increased due to their dietary benefits and flavor properties (Kaminarides, Stamou, & Masouras, 2007). Consumer acceptance of dairy products is strongly affected by textural properties (Frost & Janhoj, 2007), as well as the fat content (Folkenberg & Martens, 2003a). Folkenberg and Martens (2003b) showed a strong influence of fat on odor, flavor, taste and texture attributes in stirred yoghurts. Consequently, there is a need to know how to imitate fat in reduced-fat yoghurts.
The addition of milk ingredients such as whey proteins is an alternative to affect textural properties of dairy products. Textural and physical properties of yoghurts fortified with whey protein concentrate (WPC) were examined by a number of researchers (Aziznia, Khosrowshahi, Madadlou, & Rahimi, 2008; Guzmán-González, Morais, Ramos, & Amigo, 1999; Jelen, Buchheim, & Peters, 1987; Remeuf, Mohammed, Sodini, & Tissier, 2003; Sodini, Montella, & Tong, 2005). Effects of microparticulated whey proteins, WPC or whey protein isolate addition on sensory properties of yoghurt were also reported by several authors (Isleten & Karagul-Yuceer, 2006; Modler, Larmond, Lin, Froehlich, & Emmons, 1983; Torres, Janhoj, Mikkelsen, & Ipsen, 2011). Effects of variations in fat and/or protein contents on sensory properties in yoghurt have been examined as well (Janhoj, Petersen, Frost, & Ipsen, 2006; Mistry & Hassan, 1992). However, little is known about sensory effects of whey protein addition with simultaneous variation in fat and protein content.
Krzeminski, Großhable, and Hinrichs (2011) examined microstructural and physical properties of whey protein-enriched yoghurts at varying fat and protein contents. The present study analyzed these samples sensorially. Hence, including a wide range of milk composition variations, the objective of this study was to evaluate effects and interactions of fat, protein and casein-to-whey protein ratio and associated changes on sensory sensations in stirred yoghurts. Additionally, another aim was to evaluate if fat-related properties could be enhanced by means of variation in protein and whey protein addition.
10
2.2 Materials and methods
2.2.1 Samples
A total of 14 yoghurt samples with compositions as outlined in Table 2.1, were prepared as described by Krzeminski et al. (2011).
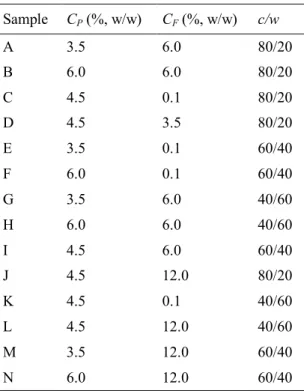
Table 2.1: Protein content (CP), fat content (CF) and casein-to-whey protein ratio (c/w) of the
evaluated yoghurt samples.
Sample CP (%, w/w) CF (%, w/w) c/w A 3.5 6.0 80/20 B 6.0 6.0 80/20 C 4.5 0.1 80/20 D 4.5 3.5 80/20 E 3.5 0.1 60/40 F 6.0 0.1 60/40 G 3.5 6.0 40/60 H 6.0 6.0 40/60 I 4.5 6.0 60/40 J 4.5 12.0 80/20 K 4.5 0.1 40/60 L 4.5 12.0 40/60 M 3.5 12.0 60/40 N 6.0 12.0 60/40
Yoghurt was filled into 500 mL odorless plastic containers and stored at 10 °C. Samples were evaluated within one week after production.
2.2.2 Sensory evaluation
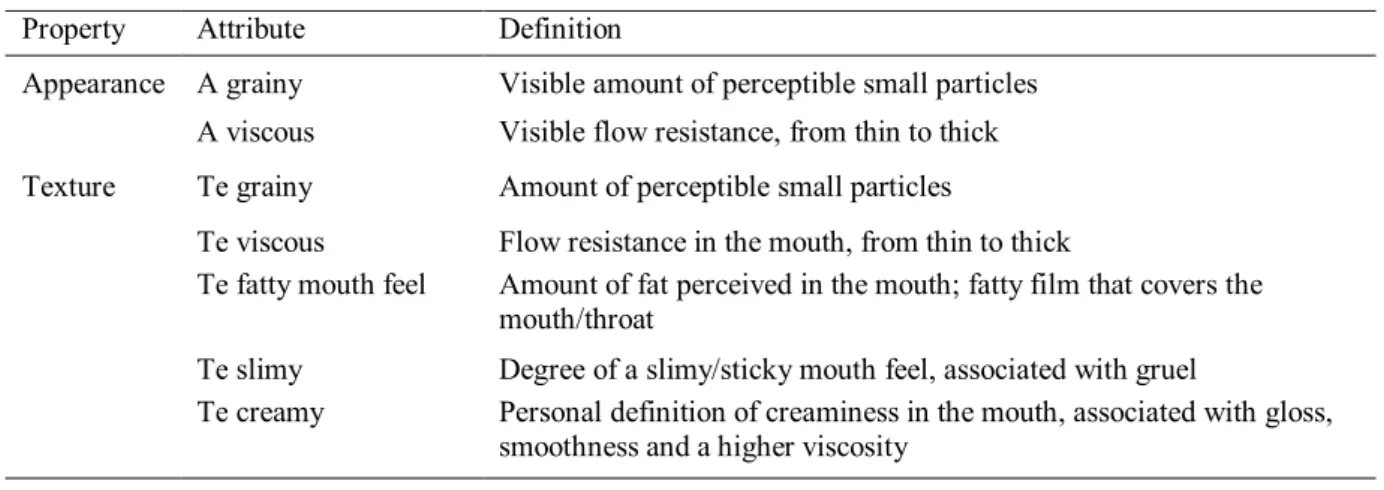
In order to receive a detailed description of sensory properties and differences between the samples, descriptive analysis according to international standards (ISO, 2003) was applied. A group of 22 trained panelists (4 males, 18 females, aged between 21 and 25 years, and selected on the basis of availability, previous training and liking of yoghurt) generated a list of terms with 14 appearance, taste and texture attributes, focusing on terms that discriminated
11 among samples. Selected terms were verbally defined and trained with suitable references. Attributes and definitions are given in Table 2.2.
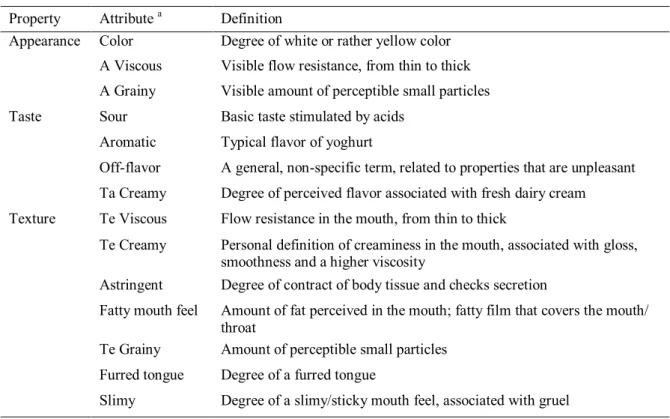
Table 2.2: List of the sensory attributes used for the evaluation of the yoghurts with definitions.
Property Attribute a Definition
Appearance Color Degree of white or rather yellow color
A Viscous Visible flow resistance, from thin to thick
A Grainy Visible amount of perceptible small particles
Taste Sour Basic taste stimulated by acids
Aromatic Typical flavor of yoghurt
Off-flavor A general, non-specific term, related to properties that are unpleasant
Ta Creamy Degree of perceived flavor associated with fresh dairy cream
Texture Te Viscous Flow resistance in the mouth, from thin to thick
Te Creamy Personal definition of creaminess in the mouth, associated with gloss,
smoothness and a higher viscosity
Astringent Degree of contract of body tissue and checks secretion
Fatty mouth feel Amount of fat perceived in the mouth; fatty film that covers the mouth/
throat
Te Grainy Amount of perceptible small particles
Furred tongue Degree of a furred tongue
Slimy Degree of a slimy/sticky mouth feel, associated with gruel
a A, appearance; Ta, taste; Te, texture.
In order to familiarize the panelists with the attributes as well as with the scaling procedure, they were trained with pilot tests. To eliminate the influence of the impression of the first sample, for example strong sourness or astringency, a commercial warm-up yoghurt sample was provided to be tasted just prior to the evaluation of the samples. During the sensory evaluation, a commercial yoghurt (CP = 4.4%, CF = 3.5%, c/w = 75/25) was additionally evaluated in each session in order to study the panel performance, as well as to allow for a comparison of the high number of samples. Sensory analysis was carried out comparatively in triplicate for each sample, with three or four yoghurts being served per session, using an eleven-point categorical scale. The order of attributes among sessions and panelists was the same. Attribute definition sheets were provided, as well as filtered tap water and matzo for neutralization. From a wide range of commercially available yoghurts, panelists chose two reference samples to represent the lowest and the highest intensity (0 and 10) for each attribute, respectively, to clarify the diversity of the product space of the descriptors. Finally,
12
as some of the yoghurts represented the lowest or highest intensity for several attributes, a total of ten different yoghurts were provided as references in each session.
All sensory assessments took place at the Sensory Laboratory at University of Applied Sciences, Hamburg, Germany, equipped with separate booths according to international standards for test rooms (ISO, 2007). At a sample temperature of 10 °C, yoghurt samples were analyzed at room temperature (21 °C 2 °C). Panellists received 60 g of each sample in 100 mL odourless and transparent plastic vessels (Bunzl Verpackungen GmbH, Gelsenkirchen, Germany), coded with three-digit random numbers. Samples were presented in randomized order among panellists according to Williams Latin Square (MacFie, Bratchell, Greenhoff, & Vallis, 1989). Sensory data collection was conducted using FIZZ (vs. 2.31G, Biosystèmes, Couternon, France).
2.2.3 Statistical analysis
Data were analyzed by a one-factor analysis of variance (ANOVA) with interaction to examine the product effect. Multiple comparisons of means were performed using Tukey’s test (P < 0.05). Cluster analysis was conducted to group samples with similar sensory properties. In order to reduce the sensory dimensions as well as to gain information about differences and similarities between samples, principal component analysis (PCA) with varimax rotation (Abdi, 2003) was applied. Statistical calculations were performed using XLSTAT (vs. 2011.2.04, Addinsoft, Andernach, Germany). In order to detect interactions and to quantify the influence of the three milk composition variables on sensory properties, ANOVA models were applied and compared using commercially available Design of Experiment Software. For the purpose of studying the panel performance, data of the commercial yoghurt sample were also analyzed by means of ANOVA and Tukey’s test.
2.3 Results and discussion
Mean values of sensory profiling and significant differences for each attribute are shown in Table 2.3. Comparing the 14 samples, results revealed significant differences in all descriptors. Data of the commercial yoghurt sample were excluded from statistical analysis, as it only served to control the panel performance and to allow for a comparison between all samples (a reliable reproducibility of the data has been determined, data not shown).
13
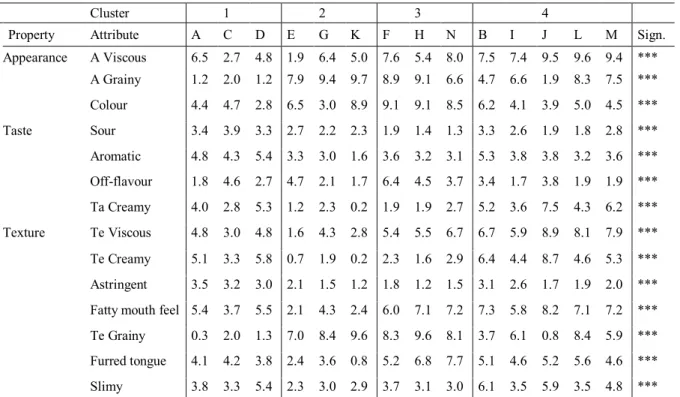
Table 2.3: Results of ANOVA, showing means and significance for each attribute, categorized in groups obtained from Cluster Analysis.
Cluster 1 2 3 4
Property Attribute A C D E G K F H N B I J L M Sign. Appearance A Viscous 6.5 2.7 4.8 1.9 6.4 5.0 7.6 5.4 8.0 7.5 7.4 9.5 9.6 9.4 *** A Grainy 1.2 2.0 1.2 7.9 9.4 9.7 8.9 9.1 6.6 4.7 6.6 1.9 8.3 7.5 *** Colour 4.4 4.7 2.8 6.5 3.0 8.9 9.1 9.1 8.5 6.2 4.1 3.9 5.0 4.5 *** Taste Sour 3.4 3.9 3.3 2.7 2.2 2.3 1.9 1.4 1.3 3.3 2.6 1.9 1.8 2.8 *** Aromatic 4.8 4.3 5.4 3.3 3.0 1.6 3.6 3.2 3.1 5.3 3.8 3.8 3.2 3.6 *** Off-flavour 1.8 4.6 2.7 4.7 2.1 1.7 6.4 4.5 3.7 3.4 1.7 3.8 1.9 1.9 *** Ta Creamy 4.0 2.8 5.3 1.2 2.3 0.2 1.9 1.9 2.7 5.2 3.6 7.5 4.3 6.2 *** Texture Te Viscous 4.8 3.0 4.8 1.6 4.3 2.8 5.4 5.5 6.7 6.7 5.9 8.9 8.1 7.9 *** Te Creamy 5.1 3.3 5.8 0.7 1.9 0.2 2.3 1.6 2.9 6.4 4.4 8.7 4.6 5.3 *** Astringent 3.5 3.2 3.0 2.1 1.5 1.2 1.8 1.2 1.5 3.1 2.6 1.7 1.9 2.0 *** Fatty mouth feel 5.4 3.7 5.5 2.1 4.3 2.4 6.0 7.1 7.2 7.3 5.8 8.2 7.1 7.2 *** Te Grainy 0.3 2.0 1.3 7.0 8.4 9.6 8.3 9.6 8.1 3.7 6.1 0.8 8.4 5.9 *** Furred tongue 4.1 4.2 3.8 2.4 3.6 0.8 5.2 6.8 7.7 5.1 4.6 5.2 5.6 4.6 *** Slimy 3.8 3.3 5.4 2.3 3.0 2.9 3.7 3.1 3.0 6.1 3.5 5.9 3.5 4.8 ***
Intensities were scored on an eleven-point categorical scale. Identification of samples can be seen in Table 2.1.
A, appearance; Ta, taste; Te, texture; Sign., significance; ***, P < 0.001.
2.3.1 Characterization of and similarities between samples
The 14 samples were clustered in four groups, each showing similarities in sensory properties. Cluster 1 (samples A, C and D) consisted of yoghurts with high c/w (80/20). Cluster 2
(samples E, G and K) and cluster 3 (samples F, H and N) grouped yoghurts with lower c/w
(60/40 and 40/60), whereas samples of cluster 3 also had protein contents of 6.0%. In contrast, samples of cluster 4 (samples B, I, J, L and M) were characterized by high CF (6.0% and 12.0%).
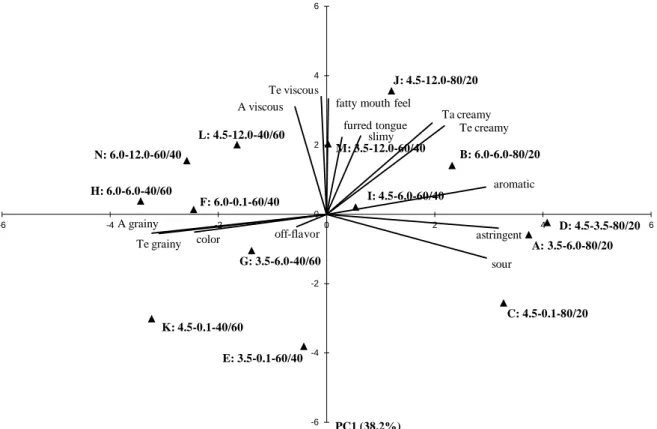
Figure 2.1 displays the PCA biplot with the first two principal components explaining 74.1% of the variance (principal component 1 (PC1) = 38.2%, principal component 2 (PC2) = 35.9%). Attributes correlating negatively with PC1 were grainy (appearance and texture) and color. Those correlating positively with PC1 were ‘typical yoghurt attributes’ (astringent, sour and aromatic). PC2 was characterized by ‘fat-related attributes’ (creamy (taste and texture), viscous (appearance and texture) and fatty mouth feel), which correlated positively with PC2. Regarding Figure 2.1 and Table 2.3, samples of cluster 1 (high c/w) showed the highest intensities in ‘typical yoghurt attributes’, the lowest scores in graininess and color and
14 A: 3.5-6.0-80/20 B: 6.0-6.0-80/20 C: 4.5-0.1-80/20 D: 4.5-3.5-80/20 E: 3.5-0.1-60/40 F: 6.0-0.1-60/40 G: 3.5-6.0-40/60 H: 6.0-6.0-40/60 I: 4.5-6.0-60/40 J: 4.5-12.0-80/20 K: 4.5-0.1-40/60 L: 4.5-12.0-40/60 M: 3.5-12.0-60/40 N: 6.0-12.0-60/40 A viscous A grainy color sour aromatic off-flavor Ta creamy Te viscous Te creamy astringent fatty mouth feel
Te grainy furred tongue slimy -6 -4 -2 0 2 4 6 -6 -4 -2 0 2 4 6 PC1 (38.2%) P C 2 (3 5 .9 % )
medium values in ‘fat-related attributes’. In contrast, cluster 2 samples (lower c/w) and cluster 3 samples (lower c/w, high CP) were characterized by an intensive graininess as well as strong yellow color and thus by a low ‘typical yoghurt character’. However, here, cluster 3 samples showed higher intensities in ‘fat-related attributes’ than cluster 2 samples. Samples of cluster 4 (high CF) were very high in ‘fat-related attributes’ and showed low to medium intensities in ‘typical yoghurt attributes’, graininess and color.
Figure 2.1: Principal component biplot with the first two principal components (PCs). showing the relation between the yoghurt samples and the accordant sensory attributes. Samples are presented in order of sample letter, protein content, fat content and casein-to-whey protein ratio. A, appearance; Ta, taste; Te, texture.
2.3.2 Effects of and interactions between CF, CP and c/w
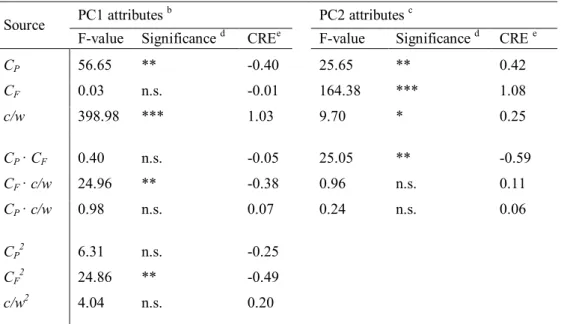
Using CF, CP and c/w as independent variables, different ANOVA models were applied and compared, with factor scores PC1 and PC2 as dependent variables. Table 2.4 is a summary of corresponding F-values, significances and coefficients of the regression equations (CRE) explaining extent and direction of influence.
15 Results indicated significant main effects of c/w and CP, a quadratic relation of CF (CF2)and an interaction between CF and c/w concerning PC1 attributes. The influence of c/w was about twice as large as the effect of CP, CF2 and the interaction between CF and c/w (Table 2.4). An increase in protein and whey protein content generally increased graininess and color, and decreased ‘typical yoghurt attributes’. Results concerning CP can be compared to previous studies where increased graininess and/or flat flavor in yoghurt were found due to higher protein contents (Johansen, Laugesen, Janhoj, Ipsen, & Frost, 2008; Mistry & Hassan, 1992).
Table 2.4: Significance of the effects of protein (CP), fat (CF)and casein-to-whey protein ratio
(c/w) on PC1 and PC2 attributes.a
Source PC1 attributes
b PC2 attributes c
F-value Significance d CREe F-value Significance d CRE e
CP 56.65 ** -0.40 25.65 ** 0.42 CF 0.03 n.s. -0.01 164.38 *** 1.08 c/w 398.98 *** 1.03 9.70 * 0.25 CP · CF 0.40 n.s. -0.05 25.05 ** -0.59 CF · c/w 24.96 ** -0.38 0.96 n.s. 0.11 CP · c/w 0.98 n.s. 0.07 0.24 n.s. 0.06 CP2 6.31 n.s. -0.25 CF2 24.86 ** -0.49 c/w2 4.04 n.s. 0.20
a ANOVA for PC1 was calculated by a quadratic model, whereas the one for PC2 was assessed by a linear model
with interaction; b PC1 attributes: grainy (appearance and texture), color, ‘typical yoghurt attributes’ aromatic,
sour, astringent; c PC2 attributes: ‘fat-related attributes’ viscous (appearance and texture), creamy (taste and
texture), fatty mouth feel; d Significance: n.s., not significant; * P < 0.05; ** P < 0.01; *** P < 0.001; e CRE,
coefficient of the regression equation.
Due to a strong relation between larger particle size and sensory graininess (Cayot, Schenker, Houzé, Sulmont-Rossé, & Colas, 2008) our results concerning the effect of c/w on graininess are comparable to earlier studies, where increased particle sizes or graininess were found with increasing whey protein content (Beaulieu, Pouliot, & Pouliot, 1999; Kücükcetin, 2008; Lucey & Singh, 1997; Lucey, 2004; Puvanenthiran, Williams, & Augustin, 2002). Krzeminski et al. (2011) found larger particle diameters within the same samples with increasing whey protein and protein content, which complies with our findings.
16
It is a well known fact that flavor and texture interact with each other. As the attributes sour and aromatic decreased and graininess increased with increasing whey protein content, we assume a decrease in flavor attributes due to increasing particle amounts and sizes and an accordant change in flavor release and retention. Isleten and Karagul-Yuceer (2006) suggested flavor-binding properties of whey proteins as a reason for lower fermented flavor in yoghurts fortified with whey protein isolate.
Changes in color could be explained by different concentrations of skim milk powder and sweet whey ultra-filtration permeate when protein content was varied, as yellow color increased with increasing CP and both were inherently yellowish. González-Martinez et al. (2002) determined higher scores in yellow color in yoghurt samples containing whey powder.
CF exerted influence by means of the quadratic term and the interaction with c/w. The interaction implied a reduced effect of whey protein concerning PC1 attributes at simultaneous high CF. Consequently, lowest graininess and yellow colour and highest scores in ‘typical yoghurt attributes’ could be found in yoghurts with high c/w and high CF. The opposite effect could be seen for yoghurts with low c/w and low CF. With reference to graininess, the findings agree with the results of Krzeminski et al. (2011), who ascertained the smallest particles in yoghurt based on high CF and high c/w and the largest particles at low CF and low c/w. In addition, Brauss, Linforth, Cayeux, Harvey, and Taylor (1999) determined decreasing particle sizes in yoghurt when fat content increased.
With respect to PC2 attributes results demonstrated significant main effects of CF, CP and c/w, in descending order of influence, as well as a significant interaction between CP and CF (Table 2.4). An increase of each factor led to increasing intensities in ‘fat-related properties’. Consequently, samples with high CF, CP and c/w showed the highest intensities in creamy (taste and texture), viscous (appearance and texture) and fatty mouth feel.
Milk fat plays an important role concerning flavor and texture of dairy products (Kaminarides et al., 2007). Our results are consistent with the findings of other studies who found increasing viscosity, firmness, creamy flavor and mouth feel with increasing fat content (Brauss et al., 1999; Folkenberg & Martens, 2003b), low creaminess in low-fat samples as well as a correlation between creaminess, creamy flavor and fatty after mouth feel (Janhoj et al., 2006). With regard to the effect of CP, results are comparable to several studies where increased sensory firmness or viscosity of yoghurt was found due to increased protein contents (Janhoj et al. 2006; Johansen et al., 2008; Mistry & Hassan, 1992; Modler et al., 1983). Torres et al. (2011) showed that texture characteristics of low-fat yoghurts were more similar to those of full-fat samples when protein contents were high.
17 As ‘fat-related properties’ decreased with decreasing c/w and thus with increasing whey protein content, and graininess simultaneously increased, we conclude a negative correlation between ‘fat-related properties’ and graininess, comparable to Cayot et al. (2008).
The interaction found between CF and CP, led to the conclusion that the effect of CP decreased with increasing CF. Intensities in creamy taste and texture, visual and textural viscosity and fatty mouth feel at low to medium CF could be increased by high CP. However, really high intensities can only be achieved with high CF.
2.4 Conclusions
Results showed, that ‘typical yoghurt attributes’ (aromatic, sour and astringent) decreased with decreasing c/w and increasing protein content, whereas graininess and yellow color were increased. However, high fat content reduced the effect of c/w.The effect of c/w was nearly twice as large as the effect of protein and its interaction with fat.
‘Fat-related attributes’ (creamy taste and texture, visual and textural viscosity as well as fatty mouth feel) increased with increasing fat content, protein content and c/w. However, the effect of protein decreased with increasing fat content. Fat was the most influential component, followed by its interaction with protein, the effect of protein and the effect of c/w.
The results showed that high intensities in ‘typical yoghurt attributes’ and low intensities in graininess and yellow color in a non-fat yoghurt could be achieved with increased c/w and decreased CP. ‘Fat-related properties’ could be enhanced by increasing the c/w and CP. Thus, the addition of the native whey protein isolate did not enhance fat-related sensory properties. Non-fat yoghurt enhanced in fat-related properties could be obtained by means of high c/w
and CP. However, as graininess increased with increasing CP, a medium CP is recommended. Acknowledgements
This research project was supported by the German Ministry of Economics and Technology (via AiF) and the FEI (Forschungskreis der Ernährungsindustrie e.V., Bonn). Project AiF 15963 N.
18
References
Abdi, H. (2003). Factor rotations in factor analyses. In: M. Lewis-Beck, A. Bryman, & T. Futing (Eds.), Encyclopedia of Social Sciences Research Methods (pp. 1-8). Thousand Oaks: Sage.
Aziznia, S., Khosrowshahi, A., Madadlou, A., & Rahimi, J. (2008). Whey protein concentrate and gum tragacanth as fat replacers in nonfat yogurt: Chemical, physical, and microstructural properties. Journal of Dairy Science, 91(7), 2545-2552.
Beaulieu, M., Pouliot, Y., & Pouliot, M. (1999). Thermal aggregation of whey proteins in model solutions as affected by casein/whey protein ratios. Journal of Food Science, 64(5),
776-780.
Brauss, M.S., Linforth, R.S.T., Cayeux, I., Harvey, B., & Taylor, A.J. (1999). Altering the fat content affects flavour release in a model yogurt system. Journal of Agricultural and Food Chemistry, 47(4), 2055-2059.
Cayot, P., Schenker, F., Houzé, G., Sulmont-Rossé, C., & Colas, B. (2008). Creaminess in relation to consistency and particle size in stirred fat-free yogurt. International Dairy Journal, 18(3), 303-311.
Drewnowski, A. (1987). Fats and food acceptance: Sensory, hedonic and attitudinal aspects. In: J. Solms, D.A. Booth, R.M. Pangborn, & O. Raunhardt (Eds.), Food acceptance and nutrition (pp. 189-204). New York: Academic Press.
Folkenberg, D.M., & Martens, M. (2003a). Sensory properties of low fat yoghurts. Part B: Hedonic evaluations of plain yoghurts by consumers correlated to fat content, sensory profile and consumer attitudes. Milchwissenschaft, 58, 154-157.
Folkenberg, D.M., & Martens, M. (2003b). Sensory properties of low fat yoghurts. Part A: Effect of fat content, fermentation culture and addition of non-fat dry milk on the sensory properties of plain yoghurts. Milchwissenschaft, 58, 48-51.
Frost, M.B., & Janhoj, T. (2007). Understanding creaminess. International Dairy Journal, 17(11), 1298-1311.
19 González-Martinez, C., Becerra, M., Cháfer, M., Albors, A., Carot, J.M., & Chiralt, A. (2002). Influence of substituting milk powder for whey powder on yoghurt quality. Trends in Food Science & Technology, 13(9-10), 334-340.
Guzmán-González, M., Morais, F., Ramos, M., & Amigo, L. (1999). Influence of skimmed milk concentrate replacement by dry dairy products in a low fat set-type yoghurt model system. I: Use of whey protein concentrates, milk protein concentrates and skimmed milk powder. Journal of the Science of Food and Agriculture, 79(8), 1117-1122.
Isleten, M., & Karagul-Yuceer, Y. (2006). Effects of dried dairy ingredients on physical and sensory properties of nonfat yogurt. Journal of Dairy Science, 89(8), 2865-2872.
ISO (2003). Sensory analysis – Methodology – General guidance for establishing a sensory
profile. ISO 13299:2003. Geneva, Switzerland: International Organization for Standardization.
ISO (2007). Sensory analysis – General guidance for the design of test rooms. ISO 8589:2007. Geneva, Switzerland: International Organization for Standardization.
Janhoj, T., Petersen, C.B., Frost, M.B., & Ipsen, R. (2006). Sensory and rheological characterization of low-fat stirred yogurt. Journal of Texture Studies, 37(3), 276-299.
Jelen, P., Buchheim, W., & Peters, K.-H. (1987). Heat stability and use of milk with modified casein: whey protein content in yoghurt and cultured milk products. Milchwissenschaft, 42,
418-421.
Johansen, S.M.B., Laugesen, J.L., Janhoj, T., Ipsen, R.H. & Frost, M.B. (2008). Prediction of sensory properties of low-fat yoghurt and cream cheese from surface images. Food Quality and Preference, 19(2), 232-246.
Kaminarides, S., Stamou, P., & Masouras, T. (2007). Comparison of the characteristics of set type yoghurt made from ovine milk of different fat content. International Journal of Food Science and Technology, 42(9), 1019-1028.
Krzeminski, A., Großhable, K., & Hinrichs, J. (2011). Structural properties of stirred yoghurt as influenced by whey proteins. LWT – Food Science and Technology, 44(10), 2134-2140. Kücükcetin, A. (2008). Effect of heat treatment and casein to whey protein ratio of skim milk on graininess and roughness of stirred yoghurt. Food Research International, 41(2), 165-171.
20
Lucey, J.A., & Singh, H. (1997). Formation and physical properties of acid milk gels: a review. Food Research International, 30(7), 529-542.
Lucey, J.A. (2004). Cultured Dairy products: an overview of their gelation and texture properties. International Journal of Dairy Technology, 57(2-3), 77-84.
MacFie, H.J., Bratchell, N., Greenhoff, K., & Vallis, L.V. (1989). Designs to balance the effect of order of presentation and first-order carry-over effects in hall tests. Journal of Sensory Studies, 4(2), 129-148.
Mistry, V.V., & Hassan, H.N. (1992). Manufacture of nonfat yogurt from a high milk protein powder. Journal of Dairy Science, 75(4), 947-957.
Modler, H.W., Larmond, M.E., Lin, C.S., Froehlich, D., & Emmons, D.B. (1983). Physical and sensory properties of yogurt stabilized with milk proteins. Journal of Dairy Science, 66(3), 422-429.
Puvanenthiran, A., Williams, R.P.W., & Augustin, M.A. (2002). Structure and visco-elastic properties of set yoghurt with altered casein to whey protein ratios. International Dairy Journal, 12(4), 383-391.
Remeuf, F., Mohammed, S., Sodini, I., & Tissier, J.P. (2003). Preliminary observations on the effects of milk fortification and heating on microstructure and physical properties of stirred yogurt. International Dairy Journal, 13(9), 773-782.
Sodini, I., Montella, J., & Tong, P.S. (2005). Physical properties of yogurt fortified with various commercial whey protein concentrates. Journal of the Science of Food and Agriculture, 85(5), 853-859.
Torres, I.C., Janhoj, T., Mikkelsen, B.O., & Ipsen, R. (2011). Effect of microparticulated whey protein with varying content of denatured protein on the rheological and sensory characteristics of low-fat yoghurt. International Dairy Journal, 21(9), 645-655.
21
3
Relating creamy perception of whey
protein enriched yoghurt systems to
instrumental data by means of
multivariate data analysis
Alina Krzeminski, Maja Tomaschunas, Ehrhard Köhn, Mechthild
Busch-Stockfisch, Jochen Weiss, and Jörg Hinrichs
Originally published in Journal of Food Science 2013,78(2), S314-S319.
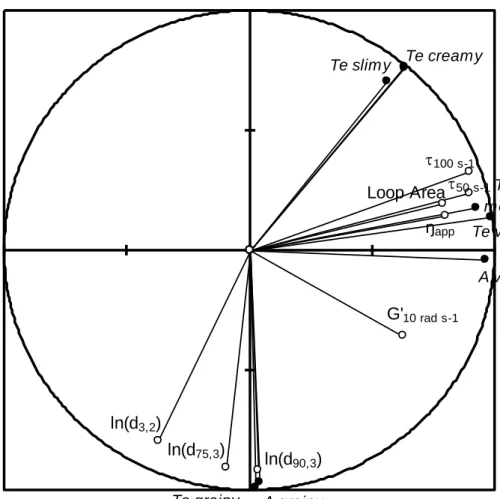
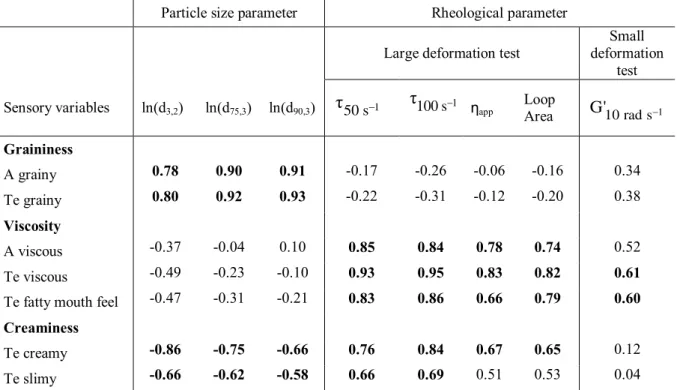
AbstractYoghurts differing in fat content, protein content and casein-to-whey protein ratio were produced, and structurally as well as sensorially examined. The objective of the current research was to evaluate the predictive value of rheological and particle size measurements concerning sensory appearance and texture attributes in 13 differently composed stirred yoghurt systems, with a focus on graininess, viscosity and creaminess. Structural and sensory analyses showed large differences in texture properties between the tested yoghurt systems. Both data sets were correlated by means of multivariate statistical methods. Sensory graininess was highly correlated with particle size-related parameters, sensory viscosity was highly correlated with destructive rheological parameters and creamy perception was highly correlated with particle size-related parameters and destructive rheological parameters, but was not as well described by any oscillatory parameter. Best predictive ability (r² > 0.89) was found for creaminess combining particle-size related and destructive rheological parameters tested within this study.
Practical application
Knowing the instrumental parameters describing sensory textural attributes provides important information for having a better understanding of the underlying processes during consumers’ perception. Knowledge about the sensory behavior of a product and its oral processing imparts an opportunity to fasten the product development process. By means of yoghurt systems, instrumental parameters derived from particle size analysis and rheological measurements were correlated with sensory attributes in order to determine the main factors leading to the mouth feel sensations grainy, viscous and creamy of semisolid milk products.
22
3.1 Introduction
The description of creaminess by studying the relationship of sensory and instrumental texture data is a highly interesting and much debated topic. Creaminess is a complex sensation and is related to multiple food properties including textural attributes (Szczesniak, 1987), smoothness and thickness (Kokini, 1987), fattiness, flavor perception, and pleasantness (Tournier, Martin, Guichard, Issanchou, & Sulmont-Rossé, 2007) and overall liking (Richardson-Harman et al., 2000).
As reported by Janhøj, Petersen, Frøst, and Ipsen (2006), a moderate predictive ability of the sensory attribute creaminess was shown for a large set of rheological data and parameters derived from Posthumus funnel measurements for plain stirred yoghurts. However, it has been demonstrated that consumers’ rated perception of creaminess is not only strongly correlated to bulk rheological parameters but also to the presence of particles (Kilcast & Clegg, 2002). For example, stirred low-fat yoghurt is perceived as creamy when small gel particles and high thickness are given as presented by Cayot, Schenker, Houzé, Sulmont-Rossé, and Colas (2008). It is a well-known fact that the incorporation of whey proteins into a yoghurt matrix leads to increased values of thickness (Britten & Giroux, 1991; Krzeminski, Großhable, & Hinrichs, 2011; Lucey & Singh 1997; Torres, Janhøj, Mikkelsen, & Ipsen, 2011) and to increased particle sizes (Beaulieu, Pouliot, & Pouliot, 1999; Krzeminski et al., 2011; Küçükçetin, 2008). Recently, structural properties of a set of 13 stirred yoghurts as a function of compositional parameters (fat and protein content, casein-to-whey protein ratio) were characterized by means of rheology and particle size analysis (Krzeminski et al., 2011). The structural data revealed different thickness properties (storage modulus G’ = 0.18 – 2.95 kPa) and particle size classes (d3,2 = 12 – 125 µm) for the studied yoghurt samples. Corresponding sensory results demonstrated that “fat-related attributes” (visual and textural viscosity, fatty mouth feel and creamy texture) increased with increasing fat content, protein content and casein-to-whey protein ratio (Tomaschunas, Hinrichs, Köhn, & Busch-Stockfisch, 2012) which is consistent with other findings (Brauss, Linforth, Cayeux, Harvey, & Taylor, 1999; Folkenberg & Martens 2003).
The intention of this study was to examine the predictive value of instrumental data derived from rheology and particle size measurements, with a particular view to the concept of creaminess. Thus, a wide range of differently composed yoghurt systems have been investigated texturally to examine which instrument or rather which combination of instruments will best predict relevant sensory attributes. The primary objective of the present study was to find structural and sensory differences from full-fat control results testing if the
23 range of studied textural parameters was wide enough for response differences. The secondary objective was to correlate both data sets by means of PCA and multiple linear regressions in order to gain knowledge about the predictive ability of generated models to sensory attributes.
3.2 Materials and methods
3.2.1 Stirred yoghurt preparation
The production of stirred yoghurt systems differing in their composition was carried out at Dairy for Research and Training of University of Hohenheim as described by Krzeminski et al. (2011). Chosen response surface design (Box-Behnken-Design) is also described in detail by Krzeminski et al. (2011). Three factors were varied in each case at three levels: protein content (CP = 3.5, 4.5 and 6.0%, w/w), casein-to-whey protein ratio (c/w = 80/20, 60/40 and
40/60) and fat content (CF = 0.1, 6.0 and 12.0%, w/w), giving a total of 13 differently
composed samples.
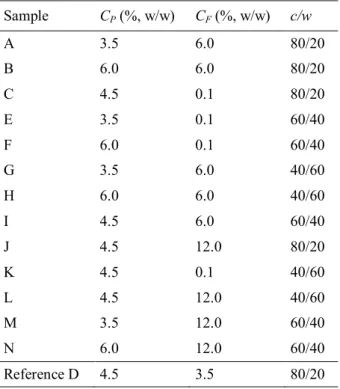
Table 3.1: Protein content (CP), fat content (CF) and casein-to-whey protein ratio (c/w) of the
evaluated yoghurt samples, order of experiments was fully randomized.
Sample CP (%, w/w) CF (%, w/w) c/w A 3.5 6.0 80/20 B 6.0 6.0 80/20 C 4.5 0.1 80/20 E 3.5 0.1 60/40 F 6.0 0.1 60/40 G 3.5 6.0 40/60 H 6.0 6.0 40/60 I 4.5 6.0 60/40 J 4.5 12.0 80/20 K 4.5 0.1 40/60 L 4.5 12.0 40/60 M 3.5 12.0 60/40 N 6.0 12.0 60/40 Reference D 4.5 3.5 80/20
The factors and levels were selected in order to generate a wide range of structural and sensory properties in the stirred yoghurt systems. One of the yoghurts was selected as a
24
control formulation (central point of the experimental design) which has been produced in triplicate to test the reproducibility of the manufacturing conditions. Representing a yoghurt texture that is desired by customers, yoghurt with 3.5%, w/w, fat and 4.5%, w/w, protein with casein-to-whey protein ratio of 80/20 was produced additionally and regarded as reference yoghurt sample. Table 3.1 outlines the composition of the yoghurt samples which were used within the present study.
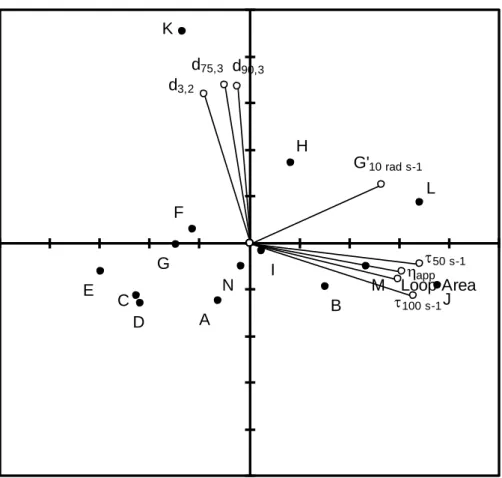
3.2.2 Structural analysis
Particle size distribution of microgel particles in stirred yoghurts was determined by laser light scattering using a Beckman Coulter LS230 (Beckmann Coulter, Small Volume Mode, Fullerton, USA), modified according to Ciron, Gee, Kelly, and Auty (2010). Rheological measurements (small and large deformation testing) of stirred yoghurt systems were carried out using a stress-controlled AR2000 rheometer (TA instruments, Eschborn, Germany) with a searle-type coaxial cylinder measuring system. Full description of applied analysis methods and structural data of the evaluated yoghurt samples can be found in Krzeminski et al. (2011). Prior to structural analysis, yoghurt systems were maintained at 10 °C for 24 h. All measurements were performed at 10 °C. Particle size analysis has been replicated three times, rheological assessment twice.
Representative parameters from instrumental data were identified for further analysis and correlations with sensory attributes. Sauter mean diameter (d3,2) corresponding to fine microgel particles, particles of the 75th percentile (d75,3) and particles of the 90th percentile (d90,3) corresponding to coarse gel particles, were identified from particle size analysis. Small deformation test provided the representative parameter storage modulus at an angular frequency of 10 rad s-1 (G'10rads1). Large deformation test revealed the representative
parameters shear stress at a shear rate of 50 s-1 (τ50s1) or rather at 100 s-1 (τ100s1).
According to Skriver, Holstborg, and Qvist (1999) and Shama and Sherman (1973) this shear rate regime reflects the best correlation to describe oral perception during the consumption of semisolid milk products, e.g. yoghurt. In addition, the apparent viscosity (ηapp) and the area of
hysteresis loop (Loop Area) between the upwards and downwards flow curve (0 to 500 s-1, peak hold step at 500 s-1, 500 to 0 s-1, 3 min per step) were evaluated.