THE INFLATION AND EXCHANGE RATE IN THE FIVE
BALKAN COUNTRIES FROM MAASTRICHT
CONVERGENCE CRITERIA PROSPECT
1Vlastimir VUKOVIĆ2, Aleksandar ZDRAVKOVIĆ3
Abstract
In the focus of this research of the inflation and exchange rate from the Maastricht convergence criteria prospect are five Balkan countries, former
Yugoslav republics: Bosnia and Herzegovina, Croatia, Macedonia, Montenegro
and Serbia. Comparative analysis of the price and exchange rate stability in these countries was done by comparing to the EU average and certain Member States from Central, Eastern and Southeastern Europe (CESE). The basic goal was to determine the degree of nominal convergence, disregarding the fact that Maastricht convergence criteria are not the conditions for getting the status of the EU Member State, but for joining Economic and Monetary Union (EMU), or Euro zone. The subjects of the research were also the determinants of the price and exchange rate stability in this group of countries, and especially monetary policy strategy. Corresponding recommendations were given at the end to the analyzed countries and European Central Bank (ECB).
Key words: transition economies, Balkan, inflation, exchange rate, Maastricht convergence criteria, monetary policy, dollarization.
INTRODUCTION
The five Balkan countries, which originated from former Yugoslavia, are on their way to the European Union (EU). Each of these countries - Bosnia and Herzegovina, Croatia, Macedonia, Montenegro and Serbia – is closer or further
1 This paper is a part of research projects numbers 47009 (European integrations and
social and economic changes in Serbian economy on the way to the EU) and 179015 (Challenges and prospects of structural changes in Serbia: Strategic directions for economic development and harmonization with EU requirements), financed by the Ministry of Science and Technological Development of the Republic of Serbia.
2 PhD, Senior Research Associate, Institute of Economic Sciences, Belgrade. 3 M.Sc., Research Assistant, Institute of Economic Sciences, Belgrade.
from the desired goal. The duration of the accession process is very uncertain, but their determination to join the EU is undeniable.
It is essential for these countries (Balkan-5) to achieve and preserve macroeconomic stability during the accession to the EU. Without a stable macroeconomic environment it is not only impossible to fulfill the conditions required for the European integration, but it is also impossible to achieve a faster economic growth. The foundation of macroeconomic stability is seen, above all, in stable prices and exchange rates.4
Therefore, it is understandable why the maintenance of price stability is the primary objective of the ECB (ECB, 2011) and central banks of most countries in the world (Mishkin, 2007) including the countries from the Balkan-5 group. Despite the significance of keeping a low and stable inflation, it is not a condition for getting the status for the EU Member State, but for joining the Economic and Monetary Union (EMU) or Euro Zone. The same applies to the fluctuations in exchange rates, which are determined by the multilateral arrangement, known as ERM II (Exchange Rate Mechanism II). It is shown, strictly formal, that a country can become the EU member even if it has two-figure inflation and high fluctuations in the national currency exchange rate to euro and other currencies from the non-euro area and the EU Member States. In a real situation, this kind of country would be undesirable, which becomes clear if we bear in mind the officially confirmed benefits of the price stability.5
4 See: Burda Michael and Charles Wiplosz (2005), Macroeconomics: A European text, 4th
edition, Oxford University Press; Blanchard Olivier (2008), Macroeconomics, 5th edition, Prentice Hall; and other.
5 The objective of price stability refers to the general level of prices in the economy and
implies avoiding both prolonged inflation and deflation. There are several ways in which price stability contributes to achieving high levels of economic activity and employment.
First, price stability makes it easier for people to disentangle changes in relative prices (i.e. movements in prices of any individual good or service) from changes in the general price level. Second, if creditors can be sure that prices will remain stable in the future, they will not demand an „inflation risk premium “to compensate them for the risks associated with holding nominal assets over the longer term. Third, the credible maintenance of price stability also makes it less likely that individuals and firms will divert resources from productive uses in order to hedge against inflation. Fourth, tax and welfare systems can create perverse incentives which distort economic behaviour. Fifth, inflation acts as a tax on holdings of cash. In an inflationary environment, households have an incentive not to use cash as often in order to reduce transaction costs. Sixth, maintaining price stability prevents the considerable and arbitrary redistribution of wealth and income that arises in inflationary as well as deflationary environments, where price trend change in unpredictable ways (e.g. redistribution effects from creditors to debtors).
The Balkan-5 countries are suitable for comparative analysis, because they are relatively homogeneous by their economic development, openness, financial deepening, dollarization and economic transition, which they are still passing through. The focused period is from 2005 to 2010, considering that the eight transition countries of the Central and Eastern Europe (CEE) got their EU Member State status on May 1, 2004. The data for 2005 and 2006 are related to EU-25 Member States, and from 2007, when Bulgaria and Romania joined the EU, the data comprise EU-27. In order to assure data comparison for different countries, national statistics were not used as sources, but firstly Data and Statistics of IMF and European Central Bank (ECB) statistics.
Research of the general price movement and fluctuations in the exchange rates in these countries is most commonly done by analysis of multi-year time series, or actual trends (central banks) and comparison to Regional Peers (IMF). Contrary to the usual practice, Maastricht convergence criteria are used for the analysis of the price stability and exchange rates. Beside this, the comparison was done with the average in the EU, as well as with the Member States from Central, Eastern and Southeastern Europe (CESE). That is why the Convergence Criteria were first examined and then Prices Stability and Exchange Rate Stability in these countries. Determinants are analyzed in the following part. At the end, Conclusion and Recommendations are given, for the central banks and governments, and as well as for the European Central Bank (ECB).
CONVERGENCE CRITERIA
The convergence criteria are defined in the Treaty on the Functioning of the European Union (Article 140), often called as Maastricht Treaty, so this is the reason for the title Maastricht convergence criteria. Fulfilling these criteria is the condition to participate in Stage Three of EMU (ECB 2010, p. 5). The criteria relate to the economic and legal convergence.
Maastricht Treaty determined four fundamental criteria for economic convergence: 1) price stability, 2) fiscal criteria (fiscal balances and debt ratios), 3) exchange rate stability, and 4) long-term interest rate. The goal of these criteria is to promote a more lasting monetary and fiscal stability necessary for the efficient functioning of the monetary union with the minimal costs.6
banking sector balance sheets and decrease households’ and firms’ wealth. (ECB 2011, p. 56-57)
6 The establishment of a stability culture was necessary to enable the European Central
For the analysis of the inflation movement and exchange rate in the Balkan-5 countries, the most relevant are the first and the third convergence criteria; of course, it does not mean that the government fiscal position and long-term interest rate do not have influence on the general price movement and exchange rates. This is the reason why it is necessary to determine how these criteria are normatively defined by the Treaty and the way of application of Treaty provisions. Beside this, quantitative definition of price stability is particularly important, which is determined by ECB according to the Treaty, as well as quantification of general fluctuation margins (ERM II).
Price stability criterion
Treaty provisions – Article 140(1), first indent, of the Treaty requires: “the achievement of a high degree of price stability; this will be apparent from a rate of inflation which is close to that of, at most, the three best performing Member States in term of price stability” (ECB 2010, p. 9).
It is apparent that the Treaty has not been burdened by defining the price stability, but only with high degree of price stability basically related to the three best performing Member States in term of price stability. This kind of determination explicitly reflects the EU need to minimize considerable differences in inflation rates in the future, which existed between the EU-12 Member States. Namely, at the beginning of the 1990s, traditional discrepancy in the inflation speed was still noticeable between the northern (low inflation) and southern (high inflation) EU countries, which could get in danger the monetary union that was being under construction. Only after inflation curbing there could be expected some price levels convergence in the EU. At the end, the Treaty reflects the prospect that all of the twelve Member States will participate in the EMU in the future.
Protocol No 13 – Article 1 of Protocol (No 13) on the convergence criteria referred to in Article 140 of the Treaty stipulates that: “the criterion on price stability referred to in the first indent of Article 140(1) of the Treaty of the Functioning of the European Union shall mean that a Member States has a price performance that is sustainable and an average rate of inflation, observed over a period of one year before the examination, that does not exceed by more than 1½
percentage points that of, at most, the three best performing Member States in term of price stability. Inflation shall be measured by means of the consumer price index on a comparable basis taking into account differences in national definitions” (ECB 2010, p. 9).
The above mentioned determination of price stability criterion clearly shows that the possibilities for deflation or decreasing in the general price levels were not
predicted? Therefore, it was not determined whether the countries with negative inflation (deflation) could be classified as the „best performing Member States in term of price stability. “ This kind of imprecise determination in the Protocol caused the unavoidable interpretation of the expression “best performing“ in the times of economic crisis and recession, characterized by deflation. It is sufficient to emphasize the danger of discretionary decision making in monetary policy or more precisely the lack of rules.
Application of Treaty provisions – The ECB applies the Treaty provisions as outlined below: First, with regard to “an average rate of inflation, observed over a period of one year before the examination“, the inflation rate has been calculated using the change in the latest available 12-month average of the HICP over the previous 12-month average. […] Second, the notion of „at most, the three best performing Member States in term of price stability”, which is used for the definition of the reference value, has been applied by taking the unweighted arithmetic average of the rate of inflation (ECB 2010, p. 9).
In order to ensure the reference information for the application procedure, it is advisable to show how the reference value in successive report periods is calculated, starting from 2004 and bearing in mind that this research focuses on the period from 2005 to 2010.
The reference period: September 2003 to August 2004. The three best performing Member States: Finland (0.4%), Denmark (1.0%) and Sweden (1.3%). The average rate is 0.9% and, adding 1½ percentage points, the reference value is 2.4% (ECB 2004, p.8)
The reference period: April 2005 to March 2006. The three best performing MS: Sweden (0.9%), Finland (1.0%) and Poland (1.5%). The average rate: 1.1%. The reference value: 2.6% (ECB 2006 May, p. 13).
The reference period: November 2005 to October 2006. The three best performing MS: Poland (1.2%), Finland (1.2%) and Sweden (1.5%). The average rate: 1.3%. The reference value: 2.8% (ECB 2006, p. 8).
The reference period: April 2006 to March 2007. The three best performing MS: Finland (1.3%), Poland (1.5%) and Sweden (1.6%). The average rate: 1.5%. The reference value: 3.0% (ECB 2007, p. 8).
The reference period: April 2007 to March 2008. The three best performing MS: Malta (1.5%), the Netherlands (1.7%) and Denmark (2.0%). The average rate: 1.7%. The reference value: 3.2% (ECB 2008, p. 8).
The reference period: April 2009 to March 2010. The three best performing MS: Portugal (-0.8%), Estonia (-0.7%) and Belgium (-0.1%). The average rate: -0.5%. The reference value: 1.0% (ECB 2010, p. 9).
Discretionary decision making is applied in the first (2004) and the last (2010) report. From the first period, Lithuania (-0.2%) was excluded from the calculations and the key argument for this was that the reference value as an economically meaning full benchmark (ECB 2004, p. 8).7 In the last report, Ireland (-2.3%) was excluded, with the same argumentation as Lithuania in 2004, but countries with deflation or negative inflation were categorized as three best performing Member States? Due to this fact, the average negative rate was -0.5%. Discretion was also confirmed by the official stance that misleading to mechanically exclude all Member States with negative inflation rates at a time when several EU countries record such rates as a consequence of negative global price shocks or a highly synchronised strong downturn (ECB 2010, p. 10).
The primary problem is the ambiguity in ECS’s quantitative definition of price stability as “a year-on-year increase in the Harmonised Index of Consumer Prices (HICP) for the euro area of below 2% […] over the medium term” (ECB 2011, p. 64). Does it mean that the negative inflation is categorized in the best performance and up to what level? If it is officially stated that deflation is inconsistent with price stability,8 why are countries with the negative inflation categorized in best performing. At the end, a conclusion can be derived that this is about an implicit target range of 0-2%(Wiplosz 2006, p. 241).
Dishonouring deflation as desirable and even less as the best performance in benchmarking is confirmed by the two strong arguments. Firstly, the periods of economic contraction – recession and depression – are characterized by deflation. The problems caused by deflation can be best illustrated in the example of Japan during the last two decades. Secondly, no country in the world, not even EU, targets deflation, while the targeted inflation corridors are in the zone of positive values. For instance, for The Bank of England, the actual inflation target is 2%, with the acceptable fluctuations of +/-1%, in other words, in the corridor from 1 to 3%. The Sveriges Riksbank’s inflation target is also 2%, and other central banks have quite the same inflation targets, including the ECB with below 2%.
7 The price developments in Lithuania over the reference period, which resulted in a
12-month average rate of -0.2% due to the accumulation of specific factors, have been judged to be an outlier (ECB 2004, p. 8).
8 By referring to „an increase in the HICP of below 2%“ the definition makes clear that
not only inflation above 2% but also deflation, i.e. a self-sustaining fall in the broad price index, is inconsistent with price stability (ECB 2011, p. 66).
Based on the facts and arguments it can be determined that EU Member States with negative inflation should be excluded from the reference value calculation, because deflation is inconsistent with price stability. If the proposed rule was accepted, for the period from January to December 2010, by the IMF data from 2011, the three best performing Member States would be Slovak Republic (0.7%), the Netherlands (0.9%) and Germany (1.2%) the average rate would be 0.9% and the reference value 2.4%.
Following the rules, in this case, understands symmetry, which means that the countries with the inflation above 2% should not be included in the reference value calculation.
Ambiguities are also present in the calculation of the benchmark on the basis of all the countries that are in the EU rather than only those that are in EMU (Mihaljek 2006, p. 29). However, actual differences in the inflation rates among the best performing EMU and non-EMU countries are so small that changing the basis for setting would not bring almost any changes in the reference value. For instance, among the above mentioned 18 best performing Member States in the reports (6x3) from 2004 to 2010, non-EMU countries are shown 7 times! The final argument is the global disinflation process: Of the hundred and twenty-three countries, one hundred and ninety-three currently have annual inflation rates less than or equal to 10%, while one hundred and forty-nine have annual inflation rates less than or equal to 5% (Mishkin 2006, p. 1).
Exchange rate stability criterion
Treaty provisions – Article 140(1), third indent, of the Treaty requires: “the observance of the normal fluctuation margins provided for by the exchange-rate mechanism of the European Monetary System, for at least two years, without devaluing against the euro” (ECB 2010, p. 13-14).
This statement is in accordance to the character of the exchange-rate mechanism (ERM II) as a multilateral arrangement.
Protocol No 13 – Article 3 of Protocol (No 13) on the convergence criteria referred to in Article 140 of the Treaty stipulates that: “The criterion on participation in the exchange rate Mechanism of the European Monetary System ...“ which is irrelevant for the comparative analysis of the exchange rates movement in the Balkan-5 countries.
ECB application is important for this analysis in the part where the way of using indicators such as exchange rate volatility vis-a-vis the euro and its trend are determined (ECB 2010, p. 14). The indicator exchange rate vis-a-vis the euro is
the average annual percentage change. By doing this, a positive number denotes an appreciation vis-a-vis the euro and the negative number depreciation vis-a-vis the euro (ECB 2010, p. 42). For exchange rate stability in the Balkan-5 it is more purposeful to use a more rigorous narrower interval of margins: +/- 2.25%.
PRICE STABILITY
Price stability in the focused countries from the Balkan-5 group was comparatively examined in relation to the described reference values for EMU and average inflation in the EU. The following table shows the inflation dynamics by years for each country individually, reference value and EU average.
Due to deviations from the calendar year, reference values from the above mentioned Convergence Reports could not be used, so they had to be calculated by the ECB methodology. For 2005: Finland (0.8), Sweden (0.8%) and the Netherlands (1.5%); the average rate: 1.0%; the reference value: 2.5%. For 2006: Poland (1.0%), Finland (1.3%) and Sweden (1.5%); the average rate: 1.3%; the reference value: 2.8%. For 2007: Malta (0.7%), the Netherlands (1.6%) and Finland (1.6%); the average rate: 1.3%; the reference value: 2.8%. For 2008: the Netherlands (2.2), Portugal (2.7%) and Germany (2.8%); the average rate: 2.6%; the reference value: 4.1%. For 2009: Portugal (-0.9%), Spain (-0.2%) and Estonia (-0.1%); the average rate: -0.4%; the reference value: 1.1%. For 2010: Latvia (-1.2), Slovak republic (0.7%) and the Netherlands (0.9%); the average rate: 0.1%. The reference value: 1.6%.9
The EU average was calculated as the unweighted arithmetic average of the annual rate of inflation. Due to the changes in the EU Member States number, the average for the first two years relates to the EU-25, and for the previous three years it comprises the EU-27.
The changes in the general price level for the Balkan-5 countries during the period 2005 – 2010 are characterized by disinflation, excluding 2008. It is normally characteristic that the inflation rates are by the rule 5% except Serbia. Compared to the reference value and the EU average by years, one can see a high degree of dependency between the inflation dynamics in the Balkan-5 countries and the movement of the general price levels in the EU. At the first glance, it can be noticed that the analyzed countries had maximum inflation in 2008 and minimal growth or price drop in 2009, which matches with the years of maximum and minimum reference value and the EU average.
9 Respecting the ECB discretionary opinion, Ireland was excluded from the 2009 and
Table 1. Price stability (HICP inflation in percent) Country / Year 2005 2006 2007 2008 2009 2010 Bosnia and Herzegovina 3.6 6.1 1.5 7.4 -0.4 2.1
Croatia 3.3 3.2 2.9 6.1 2.4 1.0 Macedonia 0.5 3.2 2.3 8.4 -0.8 1.5 Montenegro 3.4 3.0 4.2 8.5 3.4 0.5 Serbia 17.3 12.7 6.5 12.4 8.1 6.2 Reference value 2.5 2.8 2.8 4.1 1.1 1.6 EU average 2,5 2.7 3.3 5.3 1.3 2.1 Source: IMF 2011
Analyzed by the Balkan-5 countries, the inflation below the reference value was mostly recorded in Macedonia (2005, 2007, 2009 and 2010), then Bosnia and Herzegovina (2007 and 2009), Croatia (2010) and Montenegro (2010). The results are even better when they are compared to the EU average, especially from 2007. Deflation could be noticed in Macedonia and Bosnia and Herzegovina in 2010, which was atypical for Southeastern Europe. Serbia is the only country with the highest inflation rates in this group, noticeably above the reference value and EU average.
Expressed stability10 of the low inflation rate in the Balkan-5 countries is even more impressive due to the fact it came after hyperinflation at the beginning of the transition. In most of these countries, the disinflation process that started in the half of the 1990s was ended by the end of the same decade and it was denoted as the initial stabilization stage (Begg 1998, p.102). During the last decade, the international studies confirmed the obvious result: low inflation in almost the entire region (Herzberg and Watson 2007, p. 32).
Average growth rates of the general price level during the period from 2005 to 2010 (Graph 1), show that Serbia is the only country which fell behind the regional trend of disinflation.
10 Relatively low variations in the annual inflation rates in most of the analyzed countries
Graph 1. Average HICP inflation 2005-2010 (in percent)
Remarkable slowing down of inflation was confirmed by the information that all of the Balkan-5 countries, except Serbia, had lower average inflation rate than the six EU Member States: Estonia (4.7%), Lithuania (4.8%), Hungary (5.1%), Bulgaria (6.4%), Romania (6.7%) and Latvia (6.8%). General estimate is extre-mely favourable: Bosnia and Herzegovina, Croatia, Macedonia and Montenegro have already achieved respectable price stability, by reference value for EMU and the EU average. Above average inflation in Serbia binds the economic and monetary policy creators to lower the inflation and anchor it below 4%.
EXCHANGE RATE STABILITY
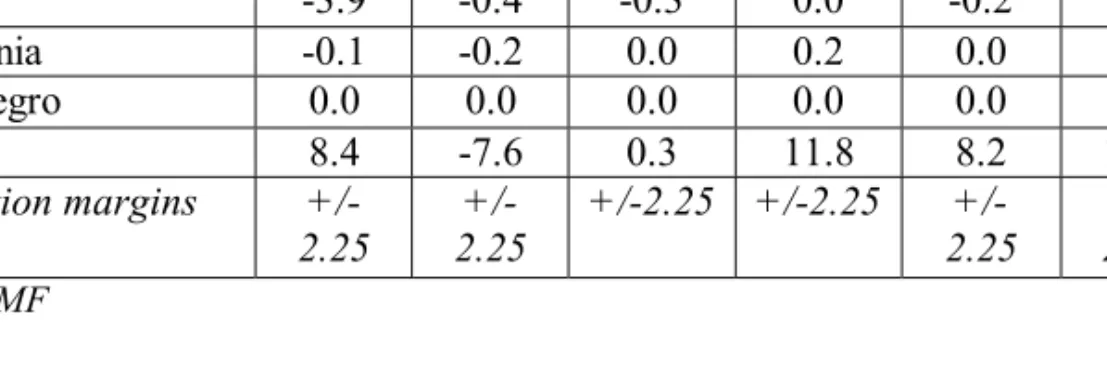
The exchange rate stability measured by the changes in the values of national currencies vis-à-vis euro was extremely high (Table 2). This result was achieved thanks to the choice of suitable exchange rate regimes. There are various models of exchange rate regimes among the analyzed Balkan-5 countries, such as official euroization (Montenegro), currency board (Bosnia and Herzegovina), conventional fixed peg (Macedonia) and managed floating (Croatia, Serbia).11 Significant differences were exposed by applying these models, which was also shown in the example of Croatia with de facto fixed exchange rate and Serbia with the extremely fluctuating exchange rate.
Table 2: Exchange rate vis-à-vis euro Country / Year 2005 2006 2007 2008 2009 2010 Bosnia and Herzegovina 0.0 0.0 0.0 0.0 0.0 0.0 Croatia -3.9 -0.4 -0.3 0.0 -0.2 1.1 Macedonia -0.1 -0.2 0.0 0.2 0.0 0.4 Montenegro 0.0 0.0 0.0 0.0 0.0 0.0 Serbia 8.4 -7.6 0.3 11.8 8.2 10.0 Fluctuation margins +/-2.25 +/-2.25 +/-2.25 +/-2.25 +/-2.25 +/-2.25 Source: IMF
Fixed exchange rate is the result of the official euroization in Montenegro and currency board in Bosnia and Herzegovina. Fluctuations in the exchange rate in Macedonia and Croatia were negligible and in narrower interval of margins: +/- 2.25%. There was a tendency of a slight depreciation in Croatia during the all years, except in 2008 and 2010, and in Macedonia during the first two years, while in the previous years it had minimal appreciation. Serbia had significant exchange rate fluctuations, although they were also in the wider interval of margins from +/-15%.
Exchange rate fluctuations vis-à-vis the euro in 2008 and 2009 were incomparably more visible12 in most of the non-EMU countries: Czech Republic 10.2% and -6.0%, Hungary -0.1% and 11.5%, Poland 7.2% and -23.2%, Romania -10.4% and -15.1%, and Sweden -3.9% and -10.4%.13
The rest of the non-EMU countries with fixed or minimally fluctuating exchange rate had the status currency participating in ERM II (Estonia, Latvia and Lithuania), while Bulgaria, which applies fixing using the currency board, stayed out of the EMU. Estonia, which also had currency board, is the member of the EMU starting from this year.
12 Two of these Member States, namely Denmark and the United Kingdom, gave
notification that they would not participate in Stage Three of EMU. As a consequence, Convergence Reports for these two Member States only have to be provided if they so request (ECB 2010, p. 5).
13 A positive (negative) number denotes an appreciation (depreciation) vis-à-vis the euro
Following the exchange rate movement in the Balkan-5 countries by the narrower interval of margins and their comparison with the EMU and non-EMU Member States clearly shows extraordinary exchange rate stability in Bosnia and Herzegovina, Croatia, Macedonia and Montenegro. Considerable fluctuations in the exchange rate in Serbia remained in a wide range interval of margins.
Determinants
All of the analyzed countries, which chose exchange rate targeting, achieved a dramatic disinflation and succeeded in accomplishing price stability in a longer period of time. Realizing low and stable inflation, these countries created a good environment to stabilize their economies, after which a faster or slower economic growth occurred.
Targeting fixed exchange rate or minimal fluctuation corridor for most European transition countries, even for the Balkan-5 group, represented the only fast and efficient strategy for exiting the whirlpool of hyperinflation.14 There are three indirect reasons for this kind of choice: first, the influence of the exchange rate on demand in small open economies tends to be large; second, the exchange rate often constitutes a key variable for private sector expectations about inflation; third, exchange rate changes produce large balance sheet effects in those economies where households and firms have foreign currency assets and liabilities (Mohanty and Turner 2008, p. 15).
Strategy for targeting exchange rate especially helped the Balkan-5 countries, which traditionally had a high level of euroization. At that, euroization does not comprise only the deposits and private sector loans, but also the very large euro cash holdings. High euroization in these countries was confirmed by all researches made during the transition process until the present moment. It is also characteristic that the euroization is significantly higher in these countries than in the rest of the CESE countries (Dvorsky et al. 2008, p. 51-54).
High euroization is confirmed by the newest IMF data about euroization of loans and deposits in these countries and other CESE countries, which is illustrated in the following graph.
14 In countries whose political and monetary institutions are particularly weak and who
therefore have been experiencing continued bouts of hyperinflation, a characterization that applies to many emerging market (including transition) countries, exchange rate targeting may be the only way to break inflationary psychology and stabilize the economy (Mishkin 2007, p. 484).
Graph 2: Euroization of Loans and deposits in CESE, 2010
Source: IMF 2011a, p. 21.1/ 2009 data.
Advantages of exchange rate targeting have not dissimulated central banks of some countries with the highest euroization, as Serbia, to choose the inflation targeting strategy. However, it has been clearly shown that this kind of monetary policy cannot be credible if it is followed by significant exchange rate fluctuations.
The above average growth of general price level in Serbia confirmed that targeting inflation in the extremely dollarized economies leads to a restrictive monetary policy without a stable exchange rate. Monetary contraction is an attempt to substitute the lacking of bank credibility. So far experience with this kind of policy indicates that expectations about inflation cannot be anchored even at a cost of some drastic submonetization of the economy, measured by the M2/GDP ratio (Vuković 2009, p. 25-34).
High level of price stability in the Balkan-5 countries implies the conclusion about generally positive monetary policy perception as credible. Exchange rate stability is of primary importance, while the credibility of central bank and its reputation is secondary. Undeniable confirmation is the fact that currency board automatism substitutes the central bank, that is, it can function without it. At the
end, it is obvious that countries with fixed or minimally fluctuating exchange rate have the lowest inflation rates. The same is valid for the unilateral official euroization.15
If one bears in mind that the Balkan-5 group is consisted of the countries with hyperinflation episodes in the past, inflation psychology and inadequate financial literacy, it is clear that low and stable inflation could not be achieved in any different way than by stabilizing or fixing the exchange rate. 16 Experience with the inflation targeting in other transition countries gives evidence that a stable exchange rate is the only efficient anchor (Vuković 2007, p. 41).
Additional evidence is given by the unsuccessful attempts of lowering a high level of euroization, or de-dollarization. This was not succeeded even by those transition countries who participated in ERM II. Poland, the most successful among the CESE countries, succeeded to lower the level of euroized loans on one third of the total loans, and euro deposits to approximately 10% (Graph 2). Econometric researches, done by the experts from the National Bank of Serbia, proved that the inflation rate in Serbia is determined by the inflation rate movement (Palić and Tasić, 2008). At that, it is shown that the exchange rate influence on the inflation is asymmetric – considerably greater in the period of depreciation, than during appreciation (Dragutinović, 2008).
Exiting strategy for the Balkan-5 countries with the stable exchange rate can be seen in already mentioned experience of Estonia, which transferred from the currency board regime into Euro zone. The examples of the CESE countries, which have already members of the EMU, are also inspirational, confirming that we can solve a problem for countries who wish to simultaneously hit the inflation and exchange rate criteria (Lewis 2007, p. 32).
The most important argument against exchange rate fixity is the nonresistance to crisis, because only the countries with immaculate resume (without vulnerable spots and with highly credible central bank) can be considered immune to speculative attacks.17 It is also emphasized that the exchange rate has tended to be
15 It is hard to deny the statement that unilateral de jure euroization is inconsistent with the
EU Treaty (Barisitz 2008, p. 384). However, the European Commission and European central Bank have not asked from Montenegro to give up from the official euroization.
16 The fixed exchange rate regimes were recommended on the grounds that they provided
“nominal anchors” for domestic price stabilization. The nominal-anchor approach offered important advantages at the start of stabilization(Petkovski 2006, p. 273).
17 Burda, M. and Wiplosz, C. (2005), Macroeconomics: A European text, 4th edition,
a source of shock (Backe 2009, p. 80) and vulnerability to speculative attacks (Ponsot 2006, p. 40). This argument was refuted by the experience: the transition countries in the region showed their resilience not only to speculative attacks, but also towards the world financial crisis and recession. The Balkan-5 countries showed resilient not only from most of the advanced economies, but also from many other CESE countries – EU Member States.
The second argument is impossibility to determine the balanced exchange rate, or the danger of appreciation. From the past experience, the exchange rate fixity caused real appreciation mostly during the first couple of years of applying this strategy.18
Beside this, it is also indicated that a stable exchange rate dissimulates export, encourages import and worsens the balance on current account. The latest IMF data (IMF, 2011) show that several countries from the Balkan-5 group with exchange rate fixity have negative balance (in GDP percent) compared to the countries from the same region with fluctuating exchange rate. Analyses done in Serbia proved that export elasticity coefficient on real exchange rate is around 0.5. Therefore, a conclusion can be derived that exchange rate growth can be of a slight assistance to exporters. On the other hand, there was no confirmation about some long-term relationship between the exchange rate and export (Tasić and Zdravković, 2008).
A usual complaint is that the exchange rate fixity and financial stability do not correspond to some faster economic growth of these countries. However, it is generally shown that the financial stability favours the growth of transition economies (Gillman and Harris, 2010). Likewise, the exchange rate fixity does not reduce economic growth in the (South) Eastern and Central European countries (De Grauwe and Schnabl 2008, p. 546).
At the end, it is obvious that the fundamental determinant of price stability and exchange rate stability is the choice of exchange rate regime, which secures long-term stability and anchoring public expectations about inflation in the frames of approximate reference value for EMU.
18 If the higher inflation is due to the Balassa-Samuelson effect, i.e., to the faster
productivity growth in the NMS, then the implied real appreciation of the exchange rate is competitiveness neutral, an important consideration once a country has adopted the euro (Darvas and Szapary 2008, p. 14).
CONCLUSION AND RECOMMENDATIONS
Investigation of general price movement and exchange rate fluctuation in the five Balkan countries - Bosnia and Herzegovina, Croatia, Macedonia, Montenegro and Serbia, using Maastricht convergence criteria and comparison with the EU average and certain CESE Member States gave apparently surprising results. High price stability and extreme exchange rate stability was determined in the unstable Balkan region.
The analyzed Balkan-5 countries achieved respectable price stability according to the reference value for the EMU and the EU average. Serbia is the only country that fell behind the regional trend of disinflation. Remarkable price stability was confirmed by the information that the first four countries from this group had a lower average inflation rate in the period from 2005 to 2010 than the six EU Member States: Estonia, Lithuania, Hungary, Bulgaria, Romania and Latvia! Bosnia and Herzegovina, Croatia, Macedonia and Montenegro have the extreme exchange rate stability, measured by the narrower interval of margins (+/-2.25%) and compared to the EMU and non-EMU EU Member States. Considerable exchange rate fluctuations in Serbia remain in the frames of wider interval of margins (+/-15%).
A remark can be put here that expressing the nominal convergence, regulated by the Maastricht criteria, blurs the significance of real convergence (Lavrač 2010, p. 10). However, GDP and income per capita growth, growing export, sustainable fiscal deficit and non-alarming debt ratios, visible financial deepening, continuation of institutional reforms and other indicators show that the real convergence (catch-up process) proceeds together with the nominal, but slightly harder and slower. The basic macroeconomic problem is high unemployment rate. However, the fact is that these countries showed above average resilience to the attacks of the still actual economic crisis.
Therefore, the most important recommendation to these countries would be to preserve price and exchange rate stability, while a stronger stability policy is needed in Serbia. Having low and stable inflation and stable exchange rates, the countries that belong to the Balkan-5 group can count on a bigger inflow of direct foreign investments and more successful business of their domestic companies after the global economic recovery.
At the end, the recommendation for the ECB would be to exclude EU Member States with negative inflation from the calculation of reference value, even minimal, because deflation is inconsistent with price stability. On the other hand, countries with the inflation above 2% should not be included in the calculation of reference value. We think that the proposed solution is methodological and practically more accurate from the suggestion that the reference value be defined
as the euro level HICP plus 1.5 percentage points (Darvas and Szapary 2008, p. 67), where accepting this suggestion would mean changing the Maastricht Treaty? The second suggestion to calculate it so as to avoid the influence of the business cycle, which periodically makes the criterion very tight (Bulir and Hurnik 2006, p. 21) is contrary to the fundamental principles of a credible monetary policy.
References
[1] Backe Peter (2009), The Monetary Integration of CESEE EU Member States: Achievements and Prospects, Focus on European Economic Integration, Special Issue, National bank of Austria, Vienna, p. 73-81.
[2] Barisitz S (2008), Paths of Monetary Transition and Modernization: Exchange Rate Regimes and Monetary Policy in Southeastern Europe including Turkey from the 1990s to 2006, Workshop No. 13, National Bank of Austria, p. 349-386. [3] Begg David (1998), Disinflation in Central and Eastern Europe: The Experience to
Date, In: Cottarelli, C. and Szapary, G. (ed.), Moderate inflation: the experience of transition economies, IMF & National Bank of Hungary.
[4] Bulir Aleš and Jaromir Hurnik (2006), The Maastricht Inflation criterion: How Unpleasant is Purgatory? IMF WP, No. 154, International Monetary Fund, Washington.
[5] Darvas Zsolt and Gyorgy Szapary (2008), Euro area enlargement and euro adoption strategies, Economic Papers 304, European Commission, Brussels. [6] De Grauwe Paul and Gunther Schnabl (2008), Exchange Rate Stability, Inflation
and Growth in (South) Eastern and Central Europe, Review of Development Economics, 12 (3), p. 530-549.
[7] Dragutinović Diana (2008), Moć i nemoć monetarne politike u uspostavljanju ravnoteže između platnobilansnih ciljeva i ciljeva inflacije, Radni papiri, Narodna banka Srbije, Beograd.
[8] Dvorsky Sandra, Scheiber Thomas and Helmut Stix (2008), Euroization in Central and Southeastern Europe – First Results from the New OeNB Euro Survey, Focus on European Economic Integration, No. 1, National Bank of Austria, p. 48-60. [9] EBRD (2010), Transition Report 2010: Recovery and Reform, European Bank for
Reconstruction and Development, London.
[10] EC (2010), Convergence report 2010, European Economy 3/2010, European Commission, Brussels.
[11] ECB (2004), Convergence report 2004, European Central Bank, Frankfurt. [12] ECB (2006), Convergence report May 2006, European Central Bank, Frankfurt. [13] ECB (2006), Convergence report December 2010, European Central Bank,
Frankfurt.
[14] ECB (2007), Convergence report May 2007, European Central Bank, Frankfurt. [15] ECB (2008), Convergence report May 2008, European Central Bank, Frankfurt. [16] ECB (2010), Convergence report, May 2010, European Central Bank, Frankfurt. [17] ECB (2011), The monetary policy of the ECB 2011, European Central Bank,
[18] Faulend Michael, Lončarek Davor, Curavić Ivana and Ana Šabić (2005), EU Criteria with Special Emphasis on the Economic Convergence Criteria – Where is Croatia? Surveys S-13, Croatian National Bank, Zagreb.
[19] Gillman Max and Mark Harris (2010), The effect of inflation on growth: Evidence from a panel of transition countries, Economic of transition, Vol. 18 (4), p. 697-714.
[20] Herzberg Valerie and Max Watson (2007), Economic convergence in South-eastern Europe: Will the financial sector deliver? SUERF Studies 2007/2, Vienna: SUERF – The European Money and Finance Forum.
[21] IMF (2011), World Economic Outlook: Slowing Growth, Rising Risks, September 2011. International Monetary Fund, Washington.
[22] IMF (2011a), Republic of Serbia: Request for Stand-By Arrangement, IMF Country Report, No. 11/311, October 2011, International Monetary Fund, Washington.
[23] Kraft, E. (2003), Monetary policy under Dollarisation: The Case of Croatia, Comparative Economic Studies, No. 45, p. 256-277.
[24] Lavrač Vladimir (2010), Inclusion of Slovenia in the Euro area and perspectives of enlargement after the global financial crisis, Working Paper, No. 51, Institute for Economic Research, Ljubljana.
[25] Lewis John (2007), Hitting and Hoping? Meeting the Exchange Rate and Inflation Criteria during a Period of Nominal Convergence, CESifo WP, No. 192, Munich. [26] Mihaljek Dubravko (2006), Are the Maastricht Criteria Appropriate for Central
and Eastern Europe? In: Motamen-Samadian Sima, ed. Economic Transition in Central and Eastern Europe, Palgrave Macmillan, New York, p. 6-29.
[27] Mishkin Frederic (2006), Monetary Policy Strategy: How Did We Get Here? WP 12515, NBER, Cambridge (MA/US).
[28] Mishkin, Frederic (2007), The Economics of Money, Banking, and Financial Markets, Eighth Edition, Pearson Addison Wesley, Boston (US).
[29] Mohanty M S and Turner Philip (2008), Monetary policy transmission in emerging market economies: What is new? In: Transmission mechanisms for monetary policy in emerging market economies, BIS Papers No. 35, Basel, p. 1-65.
[30] Palić Mirjana and Nikola Tasić (2008), Efikasnost stope obavezne rezerve kao instrumenta monetarne politike, Radni papiri, Narodna banka Srbije, Beograd. [31] Petkovski Mihail (2006), Real Echange Rate in Transition Countries, Transition
Studies Review, Vol. 13(2), p. 270-279.
[32] Ponsot Jean-Francois (2006), European Experiences of Currency boards: Estonia, Lithuania, Bulgaria and Bosnia and Herzegovina, In: Vernengo Matias (ed.), Monetary integration and dollarization: no panacea, Edward Elgar, Cheltenham (UK), p. 28-60.
[33] Vuković, Vlastimir (2007), Nestandardne mere i kredibilnost monetarne politike NBS, u: Izazovi ekonomske politike Srbije u 2007. godini, Naučno društvo ekonomista Srbije sa AEN i Ekonomski fakultet u Beogradu, p. 33-44.
[34] Vuković, Vlastimir (2009), Strukturne promene i performance bankarstva Srbije: 2002-2008, Institut ekonomskih nauka, Beograd.
[35] Wyplosz Charles (2006), European monetary union: the dark sides of a major success, Economic policy, April 2006, CEPR, London, p. 208-261.