Student Performance, Page 1
Student Performance in Online Quizzes as a Function of Time in
Undergraduate Financial Management Courses
Oliver Schnusenberg The University of North Florida
ABSTRACT
An interesting research question in light of recent technological developments is an investigation of the relationship between the time remaining to complete online quizzes and quiz scores. The data consist of over 4,000 individual quiz scores for six sections of Financial
Management at The University of North Florida taught between the Summer of 2004 and the Summer of 2005. Over 50% of the time, students take online quizzes when they have less than 10% of the total time allocated for the quiz remaining. Moreover, students reduce the time available to them for later quizzes as the semester progresses. The most successful students take the quizzes shortly after the material has been covered in class. Regression analysis reveals a strong positive relationship between the time remaining until the quiz deadline and the quiz score. For every additional 10% of the total time available to take a quiz, the quiz score increases by approximately 1.1 points, on average. Also, students perform better for higher number
quizzes, particularly if they allow themselves a large amount of time to take the quiz. In addition, students with either a low previous average or a failing average continue to perform poorly, particularly if they allow themselves relatively little time to complete a quiz. Fourth, the relationship between the previous amount of time students budgeted to take a quiz and the current quiz score is positive and marginally significant. However, students who budgeted less time for quizzes early in the semester benefit on the last quiz by earning a higher quiz score. This is particularly true for students who do not allow themselves a lot of time to take the current quiz. Lastly, students who allow themselves the least amount of time to take a quiz could increase their quiz scores by about 12 points for every additional percentage point of available time they budget for themselves to take the quiz. The results reported here are interesting not only for Financial Management courses at The University of North Florida, but offer some interesting implications for Financial Management courses across the country and for projects in any other class.
Student Performance, Page 2
Purpose and Motivation
Technological teaching and assessment aids such as the Blackboard System have become commonplace in academia. Students these days are capable of using the Web to obtain learning materials and to complete tasks for a given course. Smith and Rupp (2004), for example, report that 80 percent of their student sample consider themselves to be either intermediate or advanced computer users. Descriptions of usage of various technology (hardware, software, etc.) in the classroom are ample in recent years. Edling (2000) and Webb (2001) provide two examples of how technology can enhance the classroom environment.
Possibly as a result of developing student skills in managing technological aids in the classroom, there is some evidence that traditional and web-assisted methods of teaching produce no different results, at least in terms of student grades (see, for example, Priluck [2004] and Dellana, Collins, and West [2000]), which may leave web-assisted or even online courses as cost-effective alternatives to the traditional methods of teaching. Nevertheless, Serwatka (2003) points out that subjective testing is problematic in an on-line setting, partly because it is difficult to identify who is taking the test.
Research also indicates that seating in particularly large classes affects student grades. Benedict and Hoag (2004) find that students who sit in the back have a 23 percent increased probability of receiving Ds or Fs. Online courses do not face this issue and web-assisted courses may mitigate this issue, although it remains unclear whether information is lost without face-to-face communication between instructor and student.
Given the continued research into web-assisted and online courses, continued research into the effects of web-assisted learning on student outcomes is therefore important and necessary. Whether students learn equally well in a web-assisted course undoubtedly affects course and program outcomes, a criterion that has received great attention from the Association to Advance Collegiate Schools of Business (AACSB).1
The purpose of this study is to investigate the relationship between the time remaining to complete online quizzes and the quiz score for six sections of Financial Management Courses at The University of North Florida. Given the increased focus of web-assisted learning in academia and the focus on outcomes by the AACSB, such an investigation is warranted. However, an investigation of web-assisted testing methods is also important because it may gain insight into whether students retain and apply knowledge, whether students budget their time more
effectively as the semester progresses, and whether anxiety is reduced or eliminated as additional online quizzes are taken. These factors are discussed below.
The nature of the Financial Management course is highly cumulative, and it is important to investigate whether students retain and apply the knowledge learned throughout the semester and whether a web-assisted testing approach is sufficiently student-centered to be used in introductory finance courses in order to satisfy AACSB expectations and requirements. Recent studies, such as the ones by Taylor et al (2004) and Doyle and Wood (2005) point out that the AACSB has increased its focus on student outcomes and a student-centered approach. If students retain the knowledge learned early in the semester and demonstrate that knowledge through online quiz performance throughout the semester, then web-assisted testing may be a viable alternative to classroom testing.
Another interesting aspect of investigating the relationship between the time a quiz is taken and quiz performance is whether students budget their time more effectively as the
1
Student Performance, Page 3 semester progresses and learn from their previous mistakes. That is, if a student decides to take a quiz at the last possible minute and is unable to complete the quiz, will that student correct his or her mistake on a subsequent quiz and take that quiz earlier? Such a finding would indicate that a web-assisted testing approach is student-centered and would not disadvantage the student by separating the testing environment from the classroom.
It is also possible that web-based testing reduces students’ test anxiety. Burns (2004) finds that grade expectations by students can increase anxiety at the time of the final exam, which may in turn affect the actual grade the student receives. Based on this research, we suspect that students taking quizzes outside of the classroom will experience less anxiety than they do with a traditional testing format. Nonetheless, to the extent that students still experience anxiety and dread taking online quizzes, it is possible that students will postpone taking an online quiz until the last possible minute, which may negatively affect quiz grades. While this has not been tested in previous research, a finding that less remaining time to complete a quiz will result in lower performance would confirm this deliberation. Conversely, Jadali (1999) suggests that student performance may increase as students focus more on the task at hand because of the new technology.
Perhaps the most interesting aspect of investigating the relationship between available time and quiz performance is the fact that such a relationship may gain insight into student performance on other, subjective, projects, such as research projects and essays. For example, a finding that quiz performance is highly positively correlated to time availability would indicate that students who complete other projects early perform better, on average, than those who wait until the last minute to complete a project.
The remainder of this paper is organized as follows. Section 2 presents a description of the setup of Financial Management courses at The University of North Florida (UNF). Expected findings and related literature are discussed in Section 3. Section 4 presents the data and
methodology. Results are discussed in Section 5. Section 6 concludes.
A Description of Online Quizzes in the Financial Management Course at UNF
The present study investigates the relationship between available time to complete a quiz and quiz score for Financial Management (FM) undergraduate courses at The University of North Florida (UNF).
FM courses at UNF are capped at about 180 students per section. We investigate the time-performance relationship for six sections of FM, including the Summer of 2004 (one
section), the Fall Semester 2004 (two sections), the Spring Semester 2005 (two sections), and the Summer 2005 (one section). Two professors at UNF taught the FM sections over this time period.
In each of the FM sections, the professors provided students with in-class examinations. In addition, students had to complete eight quizzes throughout the semester that were posted on Blackboard. Students had one work week to complete the quiz, with the quiz becoming available on Blackboard on a Monday morning at 8:00 am and remaining available to students until the following Saturday at 11:00 pm (Fall Semester 2004) or 10:00 pm (Spring Semester 2005). Students were informed about this procedure twice during the first week of classes. In addition, the timing of the quizzes and the quiz schedule was published in the syllabus. Lastly, an
announcement for the quiz was posted on Blackboard once a quiz was posted. The format of the quizzes was multiple choice, with five to six questions focusing on one particular chapter.
Student Performance, Page 4 Students had advance knowledge of the chapters covered in the quiz. In general, in-class
coverage of the chapter ended on either the Monday or the Wednesday of the week during which the quiz was posted.
Importantly, students were informed several times in class that the quizzes would literally disappear at the expiration time. For example, students were aware that they could not log onto Blackboard at 9:59 pm during the Spring Semester of 2005, as the quiz would disappear at 10:00 pm and they would be unable to complete the quiz.
Additional formatting options for quizzes and tests are available on Blackboard. For the quizzes in the FM sections investigated here, the questions were presented to students in a randomized order. Furthermore, students could not backtrack (i.e., once they answered a
question, they could not change the answer) and were not allowed to take a quiz multiple times. This information was communicated to students in class and was included with the directions for each quiz. These directions are visible to students when they take a quiz on Blackboard.
Students were neither encouraged nor discouraged to work together on the quizzes. However, students were not prohibited from working together if they chose to.
Expected Findings and Review of Related Literature
Throughout the semester, we expect that students who wait to take the quiz until shortly before the quiz expires on Blackboard will perform more poorly than those who decide to take a quiz early, for several reasons. First, early in the semester, students may have a difficult time assessing how long it will take them to complete a quiz. Consequently, if a student waits until shortly before the quiz expires, he or she may misjudge the time necessary to work the quiz and be unable to complete it. Second, students who wait until the last minute to take the quiz will not have been exposed to the material in class for several days, whereas those that decide to take the quiz right after the last lecture for that chapter will be closer to the material covered on the quiz. Thus, we hypothesize:
H1: Students who have more available time to take the quiz will perform better than those who have less available time to take the quiz.
As the semester progresses and additional quizzes are taken, it is possible that students will change their study habits, which may result in individual students taking quizzes earlier than previous quizzes and in improved quiz performance. Conversely, quiz grades throughout the semester may decrease, as the material is cumulative and becomes more difficult, and as students become overly confident as a result of good performance on previous quizzes.
There are several reasons to believe that individual students’ grades may increase as additional quizzes are taken throughout the semester. First, students probably start working together to take quizzes. Young, Klemz, and Murphy (2003), for example, find that encouraging supportive class behaviors can increase self-report performance and the course grade. While it is possible that some students perceive working together on quizzes as cheating, West,
Ravenscroft, and Shrader (2004) find that the relationship between moral judgment scores and actual cheating behavior is insignificant, leading us to believe that students will work together on quizzes even if they believe such behavior constitutes cheating.2
Second, students may budget their time more effectively as the semester progresses and may refrain from taking quizzes at the last minute even if they have previously done so.
2
A similar finding is reported by Chapman et al (2004), who find that business students cheat more than their peers in other disciplines.
Student Performance, Page 5 Rabinowitz (2001), for instance, suggests that students budget their time and learn from their mistakes as a successful learning strategy. Third, students may adjust and increase their study time and habits as they learn what is required to achieve a better grade throughout the semester; Okpala, Okpala, and Ellis (2000) find that academic achievement is positively related to
academic efficacy and habit variables, although study time by itself is not an explanatory variable. Furthermore, Pope and Ma (2004) argue that students care about grade-risk, the potential for the loss of points on examinations, quizzes, and other assignments. Consequently, students are motivated to achieve a higher grade.
Another reason why individual students’ grades may increase as the semester progresses is that students may learn how to manage interruptions better. FM students at UNF can take online quizzes on their home computer, in the library, at a friends’ house, etc. As the semester progresses, students may adjust the setting in which they take quizzes in order to minimize interruptions. Speier, Valacich, and Vessey (1999) and Speier, Vessey, and Valacich (2003) find that interruptions improve decision-making on simple tasks and lower performance on complex tasks. Moreover, the authors report that the frequency of interruptions and the dissimilarity of content between the primary and interruption tasks was found to exacerbate that effect for complex tasks. To the extent that FM quizzes are complex tasks and that interruptions while taking the quiz are not related to the class material, students who manage to reduce interruptions throughout the semester should perform better as the semester progresses.
Yet another reason why students may perform better on FM quizzes later in the semester is that those students who are not familiar with the technology early in the semester may become used to it as the semester progresses. Stoel and Lee (2003) find that experience with technology positively influences perceived ease of use, and perceived ease of use in turn positive influences attitudes toward the technology and its usage.
The arguments above lead to the following hypotheses:
H2: As individual students take additional quizzes throughout the semester, their quiz score increases, especially if their quiz average is low and if they have a failing quiz average.
H3: Individual students who waited until the last minute to take quizzes early in the semester will adjust their study habits to take quizzes earlier as the semester progresses, resulting in a higher quiz score.
A counterargument to H2 and H3 above is presented by Christensen, Fogarty, and Wallace (2002), who find that the more conservative a student’s self-efficacy is, the higher subsequent exam scores and the final course grade will be. This implies that more optimistic students will perform worse on subsequent quizzes and more pessimistic students will perform better on subsequent quizzes. Consequently, while students who perform poorly early in the semester may adjust their study habits to increase their grades, those who perform well early in the semester may let their study habits deteriorate, leading to reduced quiz scores. This is also supported by Krohn and O’Connor (2005), who find that students respond to higher midterm scores by reducing the number of hours they subsequently allocate to studying for the course.
Regarding H3, Conte, Mathieu, and Landy (1998) suggest that time urgency (which includes an increasing concern with the passage of time) may be difficult to alter through training and may thus have a predictable effect on performance. In the current study, this study suggests that students may not adjust the available time they allocate themselves to complete a quiz as the semester progresses, thereby negating H3.
Student Performance, Page 6
Data and Methodology
For each section taught in the Fall of 2004 (2 sections) and the Spring of 2005 (2
sections), quiz scores were collected for each student for each of the eight quizzes given in each section of FM at UNF. This resulted in an initial sample of 4,512 quiz scores for 564 students.
At UNF, the administration automatically deletes students from the Blackboard system if they withdraw from the course. Consequently, the sample presented here is subject to
survivorship bias, as only the students that completed the course are analyzed. We believe this to be an appropriate sample for analyzing the relationship between quiz scores and time
availability, as those students that withdraw from the course might not have taken the course seriously or might have outside influences (which caused them to withdraw from the course) affecting the time at which they take the quizzes.
Furthermore, several students either did not take the quiz at all (resulting in a quiz score of zero) or signed on too late to answer even one question (also resulting in a quiz score of zero). Many of the students who did not take the quiz at all also never completed any other assignment and later withdrew from the course. Since these observations may seriously bias our results in favor of finding a positive relationship between quiz scores and time availability, and since our focus here is on the relationship between time management of students and quiz performance for students who are actually attempting to complete an assignment, they were eliminated from the sample, leaving a total sample of 4,001 quiz scores.3
Blackboard was used to identify the time at which a student completed a given quiz. Each of the 4,001 quiz scores was manually recorded together with the time at which the quiz was completed. This time was then used to compute the time still available to take the quiz at the time a student completes the quiz. This available time was then expressed as a fraction of the total time available to take the quiz. For example, if a student in the Spring Semester of 2005 completed a quiz at 5 p.m. on Saturday, then she would still have had five hours to take the quiz once she completed it, since the quiz expired at 10 p.m. From Monday at 8 a.m. to Saturday at 10 p.m. is a total of 134 hours to take the quiz.4 Thus, the fraction of time still available for this student to take the quiz once she completed it was 5/134 = 0.037.
Figure 1 presents the distribution of available time to take the quizzes once the quizzes are completed for all six sections of FM, in fractions of total time available to take the quiz. From Figure 1, over 50% of the time, students choose to take a quiz when they have between 0 and 10% of the total time available to them remaining! Interestingly, the next most frequent class occurs when students have between 20 and 30% of the total time remaining to take the quiz. This occurs 14.2% of the time. This is not surprising, and indicates that some students choose to wait to take a quiz until the material is covered in class. The next two most frequent classes are 10 to 20% and 50 to 60% of the time, with frequencies of 9.5% and 9.0%, respectively. Interestingly, students take the quiz very early, with 90 to 100% of the total time available remaining. This constitutes only 1.2% of the total.
3
Note that this sample does include quiz scores of zero by students who answered all questions. Moreover, it includes quiz scores other than zero of students who ran out of time while taking the quiz. We also repeated the analysis by including all 4,512 observations, and the results were similarly pronounced.
4
Two unusual quizzes should be mentioned. Quizzes 3 and 4 in the two section in the Fall Semester of 2004 had a total time of 303 and 207 hours to complete the quiz, respectively. This occurred because of class cancellations and quiz extensions. These extensions were communicated to the students 1) via email, 2) through a Blackboard announcement, and 3) via a class announcement.
Student Performance, Page 7
Figure 1. Available Time Remaining to Take a Quiz in Six Sections of FM at UNF Between Summer 2004 and Summer 2005.
0 500 1000 1500 2000 2500 0 - 0.1 0.1 - 0.2 0.2 - 0.3 0.3 - 0.4 0.4 - 0.5 0.5 - 0.6 0.6 - 0.7 0.7 - 0.8 0.8 - 0.9 0.9 - 1.0
Fraction of Total Time Remaining to Complete a Quiz
N u m b e r o f S tu d e n ts
Figure 2 shows the distribution of remaining available time to complete the quiz by quiz number. The Figure clearly shows that students allow themselves more time early in the semester to complete a quiz. This makes sense, as students become used to the quizzes and are better able to assess the time needed to complete a quiz as the semester progresses. Interestingly, the time fraction appears to level off at about quiz number 4, indicating that students have determined the optimal time to take a quiz and see no reason to change it again. A notable exception is quiz number 8, which students seem to take fairly early, almost as early as the first quiz, on average. A possible explanation for this is that quiz 8 was one of the last assignments left to complete by students; students may thus choose to take the quiz early to complete the semester.
Figure 2. Available Time Remaining to Take a Quiz in Six Sections of FM at UNF Between Summer 2004 and Summer 2005, by Quiz Number.
0 0.05 0.1 0.15 0.2 0.25 0.3 1 2 3 4 5 6 7 8 Quiz Number F ra c ti o n o f T o ta l T im e R e m a in in g
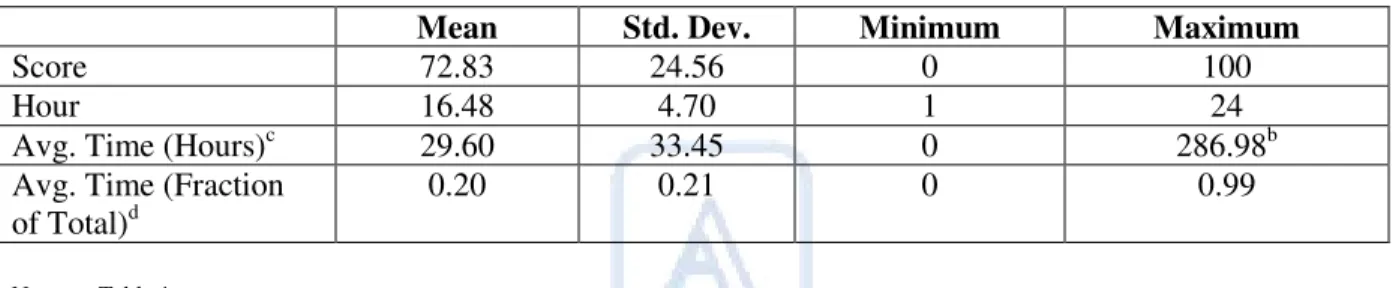
Student Performance, Page 8 Table 1 shows the descriptive statistics for the 4,001 quiz scores. As shown in the Table, the quiz average across the four sections is 72.84, with a standard deviation of 24.56 points. As would be expected, quiz scores range from 0 to 100%. Table 1 also shows that students tend to take quizzes in the late afternoon, finishing them around 4:30 p.m., on average. The standard deviation for the time at which quizzes are taken is a relatively high 4.7 hours, confirming that students literally take quizzes “around the clock,” as indicated by the minimum and maximum.
Table 1. Descriptive Statistics for 4,001a Quiz Scores in FM at UNF.
Notes to Table 1:
a A total of 4,512 quiz scores were available. To avoid an upward bias in the relationship between time availability and quiz score, those
observations where the student did not take a quiz at all or signed on too late to complete even one question on the quiz (resulting in a score of zero) were deleted.
b In the Fall Semester of 2004, students had from 8 a.m. on Monday to 11 p.m. on the following Saturday to take a quiz (a total of 134 hours available). In the Spring Semester of 2005, students had from 8 a.m. to 10 p.m. on the following Saturday to take a quiz (a total of 135 hours). Quizzes 3 and 4 in the Fall Semester of 2004 were extended due to cancelled classes, resulting in a total available time of 303 hours and 207 hours, respectively.
c This is the average time a student would still have had to complete a quiz at the time he or she finishes taking the quiz. d Computed as the average time (in hours) divided by the total amount of time a student had to complete the quiz.
The average time that remains to take the quiz after students finish taking them is 29.60 hours, on average. This means that the average student takes the quiz on the day before is expires. However, the standard deviation for the average available time is also very wide, with 33.45 hours. Moreover, the minimum of 0 indicates that sometimes students run out of time when taking a quiz, and the maximum of 286.98 hours indicates that some students take the quiz very early.5 When the remaining time available to take a quiz is expressed as a percentage of the total amount of time available, the average student allows him- or herself 20% of the total time allotted for the quiz to complete it. As with the time remaining in hours, the standard deviation is very large, with about 22%, and the range of available time as a percentage of the total is from 0% to 99%.
Table 2 shows the descriptive statistics for the quizzes by section, quiz number, and decile. Panel A shows the descriptive statistics by section, Panel B shows the descriptives by quiz number, and Panel C shows the descriptives by decile.
As shown in Panel A of Table 2, classes taught in the Spring Semester of 2005 (Sections 446 and 452) performed better, on average, than classes taught in the Fall Semester of 2004. The average quiz score in the Spring Semester is about 75.0, while the average score in the Fall Semester is only about 70.0.6 Furthermore, students in the Spring Semester allowed themselves more time to complete the quizzes, with an average fraction of available time remaining of about 23% at quiz completion. Conversely, for the Fall Semester classes, that fraction is only about 17%.
5
Recall that students had a total of 303 hours to take the third quiz during the Spring 2005 semester. 6
Students in the Spring Semester had additional materials available to them to prepare for the quizzes, such as practice quizzes and exams.
Mean Std. Dev. Minimum Maximum
Score 72.83 24.56 0 100
Hour 16.48 4.70 1 24
Avg. Time (Hours)c 29.60 33.45 0 286.98b
Avg. Time (Fraction
of Total)d
Student Performance, Page 9 Panel A of Table 2 also reveals that the day classes (Sections 434 and 446) which begin before 5 p.m. complete the quizzes earlier on the day a quiz is taken than the night classes (Sections 440 and 452). The day classes complete the quizzes around 4 p.m., on average, while the night classes complete the quizzes closer to 5 p.m., on average.
Statistics for the 4,001 quizzes by quiz number are shown in Panel B. There are several interesting observations to be gleaned from the table. First, the average quiz score tends to increase for higher quiz numbers. While quiz 1 has the highest average of almost 80, quizzes 2, 3, and 5 have averages in the mid-60s. Conversely, quizzes 6, 7, and 8 have averages in the mid- to high-70s, even though the chapter content of the quizzes is of a harder nature and incorporates more cumulative material. This indicates that students become more comfortable with the
material as the semester progresses and are maybe more in tune with the process of taking a quiz. Panel B of Table 2 also shows a clearly discernible decrease in the average time
available, expressed as a fraction of total time available to take a quiz, students allow themselves to take a quiz; for quiz 1, students allow themselves almost 27% of the total time. However, this fraction steadily decreases through quiz 6, where this fraction is only 15.4%. For quizzes 7 and 8, the average time is 17.4% and 24.8%, respectively. A possible explanation for this observation is that students are anticipating the end of the semester, and try to complete especially the last quiz to be able to focus on finals and projects in their other classes.
Panel C of Table 2 shows the statistics by time fraction decile.7 As shown in Table 2, decile 1 has an average remaining available time to complete a quiz (once students are done taking the quiz) of only 0.3% of the total available time. For quizzes in the Spring Semester of 2005, where students had 134 hours to complete a quiz, this translates to a time of only 24 minutes. Conversely, decile 10 has an average of 67.5%, which translates to approximately 90 hours and 30 minutes, or almost four days.
There are some other interesting observations in Panel C. First, the hour of the day at students complete quizzes steadily decreases from decile 1, for which students finish the quiz at about 10 p.m., to decile 5, for which students finish the quiz around noon. For higher-order deciles, the time stabilizes between 3 and approximately 5 p.m.
While it is not surprising that decile 1 students complete quizzes at such a late hour, it is surprising that the time would decreases between deciles 2 and 5. However, insofar students take the quiz on the same day, this result simply indicates that an earlier hour leaves students more time (as indicated by the higher decile) to take the quiz. Nevertheless, using this logic we would expect students to also take the quiz at an even earlier hour for deciles 6 through 10, which is not the case. What we do observe, however, is that the average quiz score is fairly steadily increasing as the deciles increase. Interpreting these results simultaneously, a possible interpretation is that
7
The 4,001 observations were placed in deciles according to the fraction of time available. This was accomplished by sorting all observations according to the time fraction, in ascending order and identifying the cutoff point for each decile.
Student Performance, Page 10
Table 2. Statistics for Quizzes of Four Sections of FM at UNF.
Notes to Table 2:
a This is the average time a student would still have had to complete a quiz at the time he or she finishes taking the quiz. b Computed as the average time (in hours) divided by the total amount of time a student had to complete the quiz. c Day class (i.e., starts before 5 p.m.)
d
Night class (i.e., starts after 5 p.m.)
e The 4,001 observations were placed in deciles according to the fraction of time available. This was
accomplished by sorting all observations according to the time fraction, in ascending order and identifying the cutoff point for each decile.
students who do better tend to 1) allow themselves more time to complete the quiz and 2) budget their time to take the quiz in the late afternoon, probably right after their day class (or before their night class). This is further supported by the fact that decile 9, which has the highest average quiz score of 81.87, has an average time fraction of 46.9%, which translates to a time of about 63 hours, or almost three days. This means that the most successful students take their quizzes late on Wednesday or early on Thursday. Since coverage of the necessary material is
Panel A – By Section
Section
Number/Variable
Score Hour Avg. Time (Hours)a
Avg. Time (Fraction of Total)b N 434c 70.46 16.15 28.44 0.175 1,007 440d 70.39 17.19 28.27 0.174 1,002 446c 74.27 15.91 27.16 0.203 1,018 452d 76.32 16.69 34.69 0.259 974
Panel B – By Quiz Number
Quiz Number/Variable Score Hour Avg. Time (Hours)
Avg. Time (Fraction of Total) N 1 79.94 15.92 36.21 0.269 511 2 64.51 16.48 32.17 0.239 506 3 64.22 16.48 42.22 0.204 505 4 78.12 16.82 26.44 0.165 512 5 65.82 16.51 21.75 0.162 496 6 79.22 16.69 20.75 0.154 496 7 75.70 16.42 23.36 0.174 485 8 75.22 16.53 33.38 0.248 490 Panel C – By Decilee
Decile/Variable Score Hour Avg. Time (Hours)
Avg. Time (Fraction of Total) N 1 60.12 21.55 0.55 0.003 400 2 68.16 19.66 2.37 0.015 400 3 71.88 17.48 4.57 0.030 400 4 73.58 14.96 7.04 0.050 400 5 71.04 12.08 11.05 0.076 400 6 71.91 15.08 25.29 0.154 400 7 76.28 15.71 33.15 0.228 400 8 77.24 15.72 46.62 0.320 400 9 81.87 16.49 67.48 0.469 400 10 76.31 16.13 97.67 0.675 401
Student Performance, Page 11 typically finished on Wednesdays, this result is not surprising and is encouraging from a teaching perspective.
Table 3. Quiz Statistics by Hour of Day and Day of the Week for Four Sections of FM at UNF.
Notes to Table 3:
a Zulu time is used. For example, hour 13 is 1p.m.
b In the Fall Semester of 2004, students had from 8 a.m. on Monday to 11 p.m. on the following Saturday to take a quiz (a total of 134
hours available). In the Spring Semester of 2005, students had from 8 a.m. to 10 p.m. on the following Saturday to take a quiz (a total of 135 hours). Quizzes 3 and 4 in the Fall Semester of 2004 were extended due to cancelled classes, resulting in a total available time of 303 hours and 207 hours, respectively. This is the reason Sunday has some observations.
Panel A – By Hour
Hour Takena/Variable Score N
1 66.77 44 2 60.81 16 3 66.60 5 4 58.00 2 5 68.00 5 6 90.75 4 7 81.63 8 8 68.55 20 9 70.67 52 10 75.53 142 11 76.63 186 12 73.63 214 13 73.81 242 14 73.56 240 15 76.41 270 16 72.63 296 17 74.16 296 18 73.82 268 19 74.69 366 20 72.44 400 21 68.79 386 22 68.92 355 23 73.61 133 24 67.27 51 Panel B – By Day
Day of Weekb/Variable Score N
Monday 79.51 145 Tuesday 76.12 250 Wednesday 79.78 422 Thursday 80.59 434 Friday 72.67 754 Saturday 68.21 1,975 Sunday 75.43 21
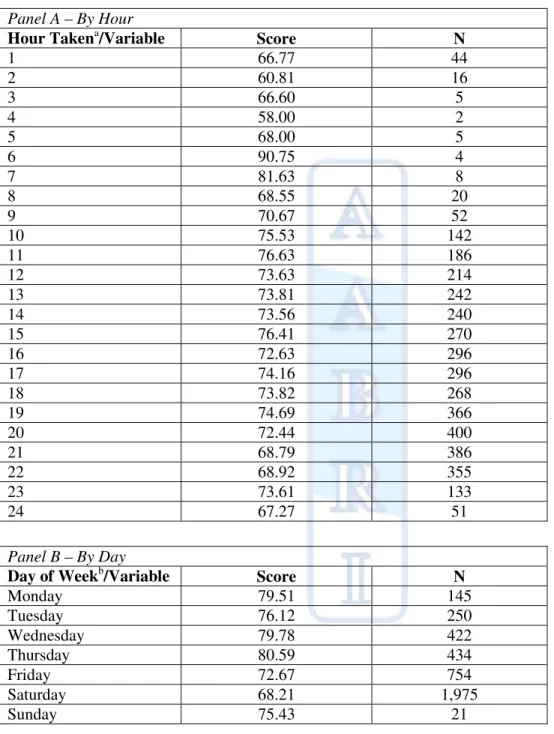
Student Performance, Page 12 Table 3, Panel A presents the quiz statistics by hour of completion. Looking in the last column, 10% of the total sample (or 400 students) complete the quiz between 8 and 9 p.m. Moreover, the number of students finishing quizzes is steadily increasing from 10 a.m. to 10 p.m. on a given day. These students tend to perform reasonably well, on average, with quiz scores in the 70s, although the students taking the quiz between 9 and 10 p.m. and between 10 and 11 p.m. have an average only in the high 60s. Although only few students tend to do so, those taking the quiz between 1 and 6 a.m. (night owls) tend to perform poorly, with quiz averages between 58 and 68, while those few students taking the quiz between 6 and 8 a.m. (early risers) tend to perform well, with quiz averages ranging from 82 to 91.
The average quiz scores and number of students taking a quiz by day of the week are presented in Table 3, Panel B. The most observations are recorded for Saturday, typically the last day to take the quiz; about 49% of students complete the quiz on Saturday. Ironically, these students also achieve the lowest quiz average of only 68.21. As would be expected, the students that perform the best take the quiz on either Wednesday or Thursday, with quiz averages of 79.78 and 80.59, respectively. These students allow themselves enough time to complete the quiz by the time it expires on Saturday, yet benefit from the fact that all the necessary material has been covered in class. Those students taking quizzes on Monday also do relatively well with an average quiz score of 79.51.
Methodology
Once the data were obtained, the following regression model was estimated to test hypotheses 1 through 3: i t i t i t i t i t i t t
i FRACT NUMBER PAVG PTIME FAVG
QSCORE, =α0 +α1 , +α2 , +α3 , +α4 , +α5 , +ε , , (1)
where
=
i t
QSCORE, the score on the quiz after student i takes the quiz at time t;
=
i t
FRACT, the amount of available time remaining to take a quiz when it is completed
by student i at time t, expressed as a fraction of the total time available to take a quiz;
=
i t
NUMBER, the number of the quiz student i takes at time t, ranging from 1 to 8; =
i t
PAVG, the average for all quizzes student i has taken prior to time t;
=
i t
PTIME, the average fraction of total time remaining student i had to complete all
quizzes taken prior to time t;
=
i t
FAVG, a dummy variable equal to unity if student i had a failing quiz average at
time t and zero otherwise.
A positive and significant
α
1 coefficient would indicate that students who allowthemselves less time to complete the quiz perform worse and that those students who allow themselves more time to complete the quiz perform better. Such a finding would support H1. The coefficients
α
2,α
3,and5
α
are used to test H2, that students’ quiz scores increase as theyStudent Performance, Page 13 low or if they are have a failing quiz average. The predicted sign for these coefficients are
positive, negative, and positive, respectively. The coefficient
α
4 is used to test H3, that studentswho allowed themselves not enough time to take previous quizzes will perform better on subsequent quizzes. The predicted sign of
α
4 is negative.Regression Results
The regression results from estimating Equation (1) are presented in Table 4. To avoid
multicollinearity between the variables, several models are presented. Since the variables PTIME
and PAVG, the average time on previous quizzes and the average on previous quizzes,
respectively, are undefined for the first quiz, the total number of observations is reduced to 3,422 quiz scores. The adjusted R-squared coefficient is presented for each model in the last column. As can be seen from Table 4, the adjusted R-squared ranges from 2.41% to 13.01%, depending on the model used.
The variable FRACT has the expected positive and significant coefficient in every model. For example, in the full model (Model 1), FRACT has a coefficient of 10.57. This indicates that the quiz score will increase by approximately 1.1 points, on average, for every additional 10% of the total time available students allow themselves to complete the quiz. The magnitude of
FRACT ranges from 10.57 in Model 1 to 18.66 in Model 3, and the variable is significant at the 1% level in every model. This provides strong support for Hypothesis 1, that students who allow themselves more time to take a quiz perform better than those that do not.
The quiz numbers (NUMBER), the average on previous quizzes taken (PAVG), and the existence of a failing average on previous quizzes (FAVG) are used to test Hypothesis 2, that students’ quiz scores will increase with higher number quizzes, especially if their previous quiz average was low and if they have a failing quiz average. Recall that the expected coefficients of the three variables are positive, negative, and positive, respectively. Looking back at Table 4, the variable NUMBER has the expected positive and significant coefficient in every model in which it is included, ranging from 1.92 in Model 3 to 2.47 in Model 1. This indicates that, on average, quiz scores are higher for quizzes taken later in the semester, which supports H2. Moreover, since there are eight quizzes in a given semester, this indicates that the difference between Quiz 8 and Quiz 2 is more than a letter grade, on average.
PAVG is included in two models and has a positive and significant coefficient in both cases. This indicates that the higher the average on previous quizzes, the higher will be the quiz score on the next quiz. Thus, it appears that those students who perform well perform better as the semester progresses and that those students who perform poorly perform worse as the semester progresses. This result is unexpected in light of the Christensen, Fogarty, and Wallace (2002) and Krohn and O’Connor (2005), who argue indirectly that the better-performing students do worse subsequently and vice versa. A possible explanation for this result is that the FM
courses at UNF are of a very high difficulty level. Consequently, students who struggle with the early material will do even worse later in the semester, while those who do well early continue to improve their performance, perhaps because they choose a more favorable environment to study in or because they begin studying in groups. This is particularly true given the cumulative nature of the material in this course; a good grasp of the early material benefits students in later quizzes. This would also explain the significant positive coefficient that is observed for FAVG, the
Student Performance, Page 14
Table 4. Regression Results for Quiz Scores in Four Sections of FM at UNF (t-statistic in parentheses).a,b
Model/ Variable
Intercept FRACT NUMBER PAVG PTIME FAVG Adj. R2
Model 1 39.75 (12.24)*** 10.57 (5.06)*** 2.47 (11.97)*** 0.29 (7.97)*** 1.51 (0.61) -4.28 (-3.04)*** 13.01% Model 2 68.60 (120.02)*** 18.36 (9.24)*** -- -- -- -- 2.41% Model 3 58.91 (48.79)*** 18.66 (9.50)*** 1.92 (9.08)*** -- -- -- 4.68% Model 4 32.05 (16.92)*** 11.15 (5.79)*** 2.41 (11.81)*** 0.38 (17.89)*** -- -- 12.81% Model 5 57.30 (42.63)*** 16.23 (7.52)*** 2.01 (9.40)*** -- 6.99 (2.70)*** -- 4.85% Model 6 64.02 (53.07)*** 12.84 (6.66)*** 2.41 (11.71)*** -- -- -13.44 (-16.15)*** 11.41% Notes to Table 4:
a The model is:
i t i t i t i t i t i t t
i FRACT NUMBER PAVG PTIME FAVG
QSCORE, =α0 +α1 , +α2 , +α3 , +α4 , +α5 , +ε , , (1) where
=
i t
QSCORE, the score on the quiz after student i takes the quiz at time t;
=
i t
FRACT, the amount of available time remaining to take a quiz when it is completed
by student i at time t, expressed as a fraction of the total time available to take a quiz;
=
i t
NUMBER, the number of the quiz student i takes at time t, ranging from 1 to 8;
=
i t
PAVG, the average for all quizzes student i has taken prior to time t;
=
i t
PTIME, the average fraction of total time remaining student i had to complete all quizzes taken prior to time t;
=
i t
FAVG, a dummy variable equal to unity if student i had a failing quiz average at time t and zero otherwise.
b
Since both PAVG and PTIME are equal to zero for quiz 1 by definition, all quiz 1 observations drop out in the regression analysis. This results in a total sample of 3,422 usable quiz scores.
* Significant at the 10% level. ** Significant at the 5% level. *** Significant at the 1% level.
PTIME, the previous average available time expressed as a percentage of the total time available, is used to test whether students who do not budget their time effectively early in the semester will adjust their study habits to take quizzes earlier and earn a higher quiz average. As shown in Table 4, PTIME is positive and significant in one of the two models in which it was included. It appears that students who have a budgeted more time for previous quizzes continue to perform well on the next quiz, and that those students who have not budgeted enough time for early quizzes will perform even worse on later quizzes. This supports the argument by Conte, Mathieu, and Landy (1998) that time urgency may be difficult to alter through training.
Student Performance, Page 15
Table 5. Regression Results for Quiz Scores in Four Sections of FM at UNF, by Quiz Number and Decile (t-statistic in parentheses).a,b,c
Panel A – By Quiz Number
Quiz/ Variable
Intercept FRACT PAVG PTIME FAVG Adj. R2
2 31.59 (3.22)*** 8.28 (1.63) 0.38 (3.46)*** 1.69 (0.34) 3.02 (0.68) 6.56% 3 46.53 (6.19)*** -0.06 (-0.01) 0.29 (3.31)*** 6.35 (1.19) -7.66 (-2.05)** 14.35% 4 65.65 (10.77)*** 9.22 (1.82)* 0.23 (3.12)*** -5.82 (-1.07) -4.25 (-1.42) 11.33% 5 40.93 (4.10)*** 18.04 (2.20)** 0.30 (2.51)** 15.13 (1.61) -3.56 (-0.81) 9.70% 6 53.57 (7.68)*** 20.17 (3.19)*** 0.38 (4.66)*** -8.32 (-1.19) -1.82 (-0.59) 15.60% 7 47.66 (6.28)*** 15.22 (2.62)*** 0.40 (4.48)*** 2.95 (0.41) -4.19 (-1.30) 20.30% 8 41.19 (4.94)*** 22.75 (5.44)*** 0.51 (5.12)*** -26.77 (-3.12)*** -1.91 (-0.54) 20.03% Panel B – By Decile Decile/ Variable
Intercept FRACT NUMBER PAVG PTIME FAVG Adj. R2
1 36.65 (3.50)*** 1,177.15 (2.58)*** 1.29 (1.79)* 0.22 (1.90)* -20.09 (-2.05)** 2.41 (0.51) 3.56% 2 52.58 (4.94)*** 149.41 (0.41) 1.10 (1.55) 0.19 (1.86)* -2.17 (-0.25) -8.05 (-1.90)* 6.90% 3 54.97 (4.56)*** -32.48 (-0.13) 2.21 (3.14)** 0.16 (1.33) 5.12 (0.51) -8.83 (-2.11)** 7.95% 4 60.71 (4.17)*** -16.87 (-0.09) 1.58 (2.35)** 0.17 (1.40) -2.72 (-0.31) -10.58 (-2.34)** 9.94% 5 27.09 (1.92)* -39.47 (-0.29) 3.69 (5.93)*** 0.42 (3.77)*** -0.31 (-0.03) -2.47 (-0.57) 17.35% 6 57.19 (5.18)*** -90.31 (-2.17)** 1.72 (2.29)** 0.32 (3.05)*** 9.24 (1.15) -5.90 (-1.40) 12.33% 7 3.56 (0.16) 188.52 (2.32)** 1.44 (2.27)** 0.31 (2.79)*** 3.23 (0.43) -2.71 (-0.65) 9.29% 8 5.19 (0.38) 24.37 (0.98) 3.97 (5.67)*** 0.56 (4.61)*** 5.27 (0.70) 3.98 (0.84) 18.88% 9 22.88 (1.78)* 49.00 (2.69)*** 3.02 (5.64)*** 0.28 (2.50)** -3.83 (-0.61) 1.18 (0.28) 12.17% 10 39.71 (3.12)*** -11.51 (-1.24) 4.10 (8.04)*** 0.32 (2.69)*** -0.43 (-0.08) -3.23 (-0.68) 22.90%
Student Performance, Page 16 Notes to Table 5:
a The model below is estimated for each quiz (Panel A) and for each time fraction decile (Panel B):
i t i t i t i t i t i t t
i FRACT NUMBER PAVG PTIME FAVG
QSCORE, =α0 +α1 , +α2 , +α3 , +α4 , +α5 , +ε , , (1) where
=
i t
QSCORE, the score on the quiz after student i takes the quiz at time t;
=
i t
FRACT, the amount of available time remaining to take a quiz when it is completed
by student i at time t, expressed as a fraction of the total time available to take a quiz;
=
i t
NUMBER, the number of the quiz student i takes at time t, ranging from 1 to 8;
=
i t
PAVG, the average for all quizzes student i has taken prior to time t;
=
i t
PTIME, the average fraction of total time remaining student i had to complete all quizzes taken prior to time t;
=
i t
FAVG, a dummy variable equal to unity if student i had a failing quiz average at time t and zero otherwise.
b Since both PAVG and PTIME are equal to zero for quiz 1 by definition, all quiz 1 observations
drop out in the regression analysis. This results in a total sample of 3,422 usable quiz scores.
c The 4,001 observations were placed in deciles according to the fraction of time available. This was
accomplished by sorting all observations according to the time fraction, in ascending order and identifying the cutoff point for each decile. The deciles were formed based on the total of 4,001 observations that were available, and not on the 3,422 observations used in the regression analysis.
* Significant at the 10% level. ** Significant at the 5% level. *** Significant at the 1% level.
Table 5 presents the regression results by quiz number (Panel A) and by ascending available time decile (Panel B). As shown in Panel A, FRACT becomes significant at about quiz 4, and both the size of the coefficient and the significance increase through quiz 8. This indicates that the significant coefficient reported in Table 4 is more pronounced for later quizzes in the semester; students who budget their time more effectively late in the semester benefit to a greater extent than those who budget earlier in the semester. This finding makes sense, as time
budgeting becomes more important as the difficulty of the material increases. As in Table 4, the coefficient for PAVG is positive and significant for every quiz in Table 5, again indicating that students with a higher previous quiz average do better on subsequent quizzes, regardless of quiz number. Interestingly, although FAVG was negative and significant in the overall regression model (Table 4), it is only negative and significant for quiz 3.
PTIME, the previous average fraction of time students allow themselves to take a quiz, is very interesting in Panel A of Table 5. Although it was positive and significant in one instance in Table 4, it is negative and significant in Panel A of Table 5 only for quiz 8; it is insignificant in all other cases. This suggests that students who had previously budgeted less time to take a quiz will earn higher quiz scores on quiz 8, indicating that those students may adjust their study habits by the time the last quiz arrives. This complements the findings by Conte, Mathieu, and Landy (1998) nicely in that time urgency (including an increasing concern with the passage of time) may not change much throughout the semester, but changes drastically by the time the last quiz arrives. This makes sense, since the last quiz is the last chance for students to increase their quiz average.
Panel B of Table 5 presents the regression results by ascending decile fraction. Decile 1 has the least available time (students take the quizzes very late), while Decile 10 has the most available time (students take the quizzes very early). The results in Panel B are very interesting.
Student Performance, Page 17 First, FRACT has a very large and highly significant coefficient in Decile 1 of 1,177.15. This indicates that those students leaving themselves very little time to complete the quiz could increase their score by about 12 points if they increase the time available to them by 1% of the total time they have to take the quiz. Although FRACT is also positive and significant for deciles 7 and 9, it is insignificant for all other deciles except for Decile 6, in which the variable is
negative and significant.8
Second, the magnitude and significance of NUMBER is increasing fairly steadily across the time deciles. This indicates that students who already leave themselves a lot of time to
complete a quiz (high decile students) benefit particularly for quizzes later in the semester. Third,
PAVG is insignificant for lower deciles but positive and significant for deciles 5 through 10. This supports our earlier conjecture that those students who already have a high quiz average are more effective at budgeting their time, allow themselves sufficient time to complete a quiz, and
achieve a higher quiz score as a result. Another interesting finding reported in Panel B of Table 5 is that FAVG is negative and significant only in the lower deciles 2, 3, and 4. This means that the negative and significant coefficient for this variable reported in Table 4 is due to students who already have a failing quiz average and still do not budget more time to take the next quiz, resulting in a another failing (or low) quiz grade.
PTIME is only significant in Decile 1, with a coefficient of -20.09. Thus, for students who leave themselves very little time to take the current quiz, the less time a student budgeted for previous quizzes, the higher the quiz score on the current quiz will be, ceteris paribus. This is an interesting finding. One possible interpretation of this result is that students who consistently
leave themselves very little time to take a quiz learn how to operate better within the time window they allow themselves, even though they do not adjust the time window itself.
Conclusion
Technological innovations in academia are constant, and technology in the classroom has become commonplace. Thus, an interesting research question is to investigate the relationship between the time remaining to complete online quizzes and quiz scores for six sections of Financial Management at The University of North Florida. Given the increased focus by the AACSB and others on student outcome assessments, it is important to investigate whether students retain and apply the knowledge learned throughout the semester and whether a web-assisted testing approach is sufficiently student-centered to be used in introductory finance courses in order to satisfy AACSB expectations and requirements.
The data consist of over 4,000 individual quiz scores for six sections of Financial
Management taught between the Summer of 2004 and the Summer of 2005. The quiz scores and times were manually collected from the Blackboard system. An initial analysis of the data reveals that over 50% of the time, students take online quizzes when they have less than 10% of the total time allocated for the quiz remaining. Moreover, students reduce the time available to them for later quizzes as the semester progresses. Nevertheless, the average student allows himself 20% of the total time available to complete a quiz. The average quiz score is 72.84, with a standard deviation of about 25 points. On average, students tend to finish taking a quiz around 4:30 p.m., with a high standard deviation of almost 5 hours. Also, day-class students tend to take quizzes earlier than their night-time counterparts.
8
This may indicate that students in that decile may take the quiz too early, before all the necessary class material is covered.
Student Performance, Page 18 A more in-depth look at the data reveals the following. First, the average quiz score tends to increase for higher quiz numbers, indicating that students become more comfortable with the material as the semester progresses and become more accustomed to the process of taking a quiz. Second, the most successful students take the quizzes after the material has been covered in class, but shortly thereafter. Third, when quiz scores are sorted into deciles based on the fraction of time available to take a quiz, those students who allow themselves less time to complete a quiz finish taking the quiz at night, while those students who allow themselves more time finish taking the quiz in the late afternoon.
Regression analysis reveals some additional interesting relationships. First, there is a strong positive relationship between the time remaining to take a quiz and the quiz score. For every additional 10% of the total time available to take a quiz, the quiz score increases by approximately 1.1 points, on average. Second, students perform better for higher number quizzes, particularly if they allow themselves a large amount of time to take the quiz. Third, students with either a low previous average or a failing average continue to perform poorly, while those with an already high average perform well on subsequent quizzes. Moreover,
students who have a failing quiz average and allow themselves relatively little time to complete a quiz perform the worst. Fourth, the relationship between the previous amount of time students budgeted to take a quiz and the current quiz score is positive and marginally significant; students who managed their time more efficiently previously continue to perform well. However, students who budgeted less time for quizzes early in the semester benefit on the last quiz by earning a higher quiz score, possibly indicating that they have adjusted their study habits by the time of the last quiz and/or realize that this is their last chance to improve their quiz average. This is
particularly true for students who do not allow themselves a lot of time to take the current quiz, which suggests that students who consistently leave themselves very little time to take a quiz learn how to operate better within the time window they allocate themselves. Fifth, a regression analysis based on time fraction deciles reveals that students who allow themselves the least amount of time to take a quiz could increase their quiz scores by about 12 points for every additional percentage point of available time they budget for themselves to take the quiz.
The results reported here are interesting not only for Financial Management courses at The University of North Florida, but offer some interesting implications for Financial
Management courses across the country, since these tend to be very similar in content and nature. Furthermore, many of the findings reported here are also applicable to any project students have to complete on their own (or in groups) outside of the classroom. Given the drastically increasing use of technology in the classroom, time management by students left to their own devices and not forced to complete a quiz within the classroom deserves additional analysis, but we hope the approach taken here offers some suggestions for future research in this area.
Student Performance, Page 19
References
Benedict, M.E. and J. Hoag. 2004. “Seating location in large lectures: are seating preferences or location related to course performance?” Journal of Economic Education 35: 215-231.
Burns, D.J. 2004. “Anxiety at the time of the final exam: relationships with expectations and performance.” Journal of Education for Business 80: 119-124.
Chapman, K.J., R. Davis, D. Toy, and L. Wright. 2004. “Academic integrity in the business school environment: I’ll get by with a little help from my friends.” Journal of Marketing Education 26: 236-249.
Christensen, T.E., T.J. Fogarty, and W.A. Wallace. 2002. “The association between the directional accuracy of self-efficacy and accounting course performance.” Issues in Accounting Education 17: 1-26.
Conte, J.M., J.E. Mathieu, and F.J. Landy. 1998. “The nomological and predictive validity of time urgency.” Journal of Organizational Behavior 19: 1-13.
Dellana, S.A., W.H. Collins, and D. West. 2000. “On-line education in a management science course – effectiveness and performance factors.” Journal of Education for Business 76: 43-47.
Doyle, J.M. and W.C. Wood. 2005. “Principles course assessment, accreditation, and the depreciation of economic knowledge.” Journal of Education for Business 80: 165-171.
Edling, R.J. 2000. “Information technology in the classroom: experiences and recommendations.” Campus-Wide Information Systems 17: 10.
Jadali, F. 1999. “Paperless classrooms.” Tech Directions 59: 14-15.
Krohn, G.A. and C.M. O’Connor. 2005. “Student effort and performance over the semester.”
Journal of Economic Education 36: 3-28.
Okpala, A.O., Okpala, C.O., and R. Ellis. 2000. “Academic efforts and study habits among students in a principles of macroeconomics course.” Journal of Education for Business 75: 219-224.
Pope, N. and Y. Ma. 2004. “Grade-risk: an insurable event in the classroom.” Risk Management and Insurance Review 7: 189-195.
Priluck, R. 2004. “Web-assisted courses for business education: an examination of two sections of principles of marketing.” Journal of Marketing Education 26: 161.
Student Performance, Page 20 Serwatka, J.A. 2003. “Assessment in on-line CIS courses.” The Journal of Computer
Information Systems 44: 16.
Smith, A.D. and W.T. Rupp. 2004. “Managerial implications of computer-based online/face-to-face business education: a case study.” Online Information Review 28: 100.
Speier, C., I. Vessey, and J.S. Valacich. 2003. “The effects of interruptions, task complexity, and information presentation on computer-supported decision-making performance.” Decision Sciences 34: 771-797.
Speier, C., J.S. Valacich, and I. Vessey. 1999. “The influence of task interruption on individual decision making: an information overload perspective.” Decision Sciences 30: 337-360.
Stoel, L. and K.H. Lee. 2003. “Modeling the effect of experience on student acceptance of web-based courseware.” Internet Research 13: 364-374.
Taylor, S.A., M. Humphreys, R. Singley, and G.L. Hunter. 2004. “Business student preferences: exploring the relative importance of web management in course design.” Journal of
Marketing Education 26: 42-49.
Webb, J.P. 2001. “Technology: a tool for the learning environment.” Campus-Wide Information Systems 18: 73-78.
West, T., S. Ravenscroft, and C. Shrader. 2004. “Cheating and moral judgment in the college classroom: a natural experiment.” Journal of Business Ethics 54: 173.
Young, M.R., B.R. Klemz, and J.W. Murphy. 2003. “Enhancing learning outcomes: the effects of instructional technology, learning styles, instructional methods, and student behavior.”