SOLUTIONS WHITE P
APER SERIES
Greenhouse Gas emissions
from aviation and marine
transportation: mitiGation
potential and policies
by
David McCollum
Gregory Gould
David Greene
Prepared for the Pew Center on Global Climate Change
by
David McCollum
Sustainable Transportation Energy
Pathways Program & Institute of
Transportation Studies
University of California, Davis
Gregory Gould
Department of Civil and
Environmental Engineering & Institute
of Transportation Studies
University of California, Davis
David Greene
Corporate Fellow
oak riDge national laboratory
December 2009
greenhoUse gas emissions
from aviation anD marine
transportation:
The authors and the Pew Center would like to thank the many reviewers for their time
and expertise. The authors would also like to acknowledge the support provided by the
Pew Center, particularly Steve Seidel’s insightful contribution to the policy discussion
and the valuable advice and guidance provided by Sanjana Ahmad and Judi Greenwald.
Any remaining errors or omissions are the sole responsibility of the authors.
The Pew Center gratefully acknowledges the following individuals for their review of
earlier drafts: Jasper Faber, CE Delft; Lew Fulton, IEA; Michael Rossell, UK Permanent
Representative to ICAO; and staff at the Federal Aviation Administration and the
U.S. Environmental Protection Agency. The views expressed are those of the authors
Contents
1. Introduction and Summary
1
2. Overview of Aviation and Marine Transportation
4
2.1 Current Emissions and Trends
4
2.2 Aviation and Marine Transportation Demand
7
2.3 Business-As-Usual Growth Projections
9
3. Technological Mitigation Options and Potential
13
3.1 Aviation
14
3.2 Marine Transportation
18
3.3 Alternative Fuels and Power
20
3.4 Alternative Modes of Transportation
21
4. Policy Options: Achieving Deep and Durable Reductions
24
4.1 Domestic Emissions
24
4.2 International Emissions
25
5. Conclusion
32
Appendix I: Expanded Discussion of Mitigation Technologies
34
References
43
1. Introduction and Summary
This paper provides an overview of greenhouse gas (GHG) emissions from aviation and marine transportation and the various mitigation options to reduce these emissions. Reducing global emissions by 50 to 80 percent below 1990 levels by 2050—reductions scientific studies suggest are necessary to stabilize the climate and avoid the most destructive impacts of climate change (IPCC 2007)—will require lowering GHG emissions across all sectors of the economy. Aviation and marine transportation combined are responsible for approximately 5 percent of total GHG emissions in the United States and 3 percent globally1 and are among the fastest growing modes in the transportation sector. Controlling the growth in aviation and marine transportation GHG emissions will be an important part of reducing emissions from the transportation sector. The Intergovernmental Panel on Climate Change (IPCC) reports that global demand for aviation increased by 5.9 percent and demand for marine transportation by 5.1 percent, during 2005 alone (IPCC 2007). Business-as-usual (BAU) projections for CO2 emissions from global aviation are estimated at 3.1 percent per year over the next 40 years, resulting in a 300 percent increase in emissions by 2050 (IEA 2008b). The projected growth rate of global marine transportation emissions is more uncertain. BAU growth projections by the IEA (2008b) and IMO (2008) are between 1 and 2 percent per year. By 2050, international marine transportation emissions are estimated to increase by at least 50 percent over 2007 levels.
There are several determinants of greenhouse gas emissions from any transportation mode. Schipper et al.’s (2001) “ASIF” identity (shown below) provides a useful framework for thinking about these drivers.
Transportation sector GHG Emissions = A • Si• Ii• Fi,j
In the identity, GHGs are a product of the following:
• A:the transportation sector’s total activity,
• Si: each subsector’s share of total activity,
• Ii:the energy intensity of vehicles used in each subsector, and
• Fi,j:the carbon intensity of thefuel types used in each subsector, where i:mode of transportation,
j: fuel type.
Reducing parameters A, Ii, or Fi,j reduces overall transportation sector emissions. Reducing Si reduces the
emissions from that particular subsector; however, whether it reduces overall emissions depends on whether that subsector’s share of transportation activity is shifted to a higher or lower GHG emitting mode. In the context of aviation and marine shipping, GHGs can be mitigated by reducing overall activity (A) (e.g.,
passenger-miles or freight-passenger-miles); reducing the mode share (S i) of a carbon-intensive mode by shifting to a transportation mode with lower emissions; increasing the mode share of a less carbon-intensive mode (Si) by shifting away from a transportation mode with higher emissions; reducing energy intensity (Ii) through improving vehicle fuel efficiency; and reducing the carbon intensity of the fuel used (Fi,j) by switching to low- or no- carbon energy sources such as biofuels, hydrogen, wind, and solar.
While aviation and marine shipping efficiencies have been steadily increasing over the past several decades, demand has grown more rapidly than efficiency improvements, causing GHG emissions from these subsectors to continue to increase (IEA 2008b; IMO 2008). Under a BAU scenario where the global economy continues to grow and there are no specific policies targeting aviation and marine transportation GHG emissions, these trends are expected to continue.
A range of near-, medium- and long-term mitigation options are available to slow the growth of energy consumption and GHG emissions from aviation and marine shipping. Improvements in operational efficiency (e.g., advanced navigation and air traffic management systems for aviation and slower marine vessel speeds) have the potential to reduce GHG emissions below BAU projections by about 5 percent for aviation and up to 27 percent for marine shipping in the near to medium term (to 2025). Looking out to 2050, advanced propulsion systems and new airframe designs could further reduce aviation CO2 emissions by up to 35 percent below BAU projections. For marine transport, larger ships, new combined cycle or diesel-electric engines, and optimized hull and propeller designs could provide an additional 17 percent reduction in emissions below BAU projections by 2050.
Reducing the carbon intensity of the energy sources used in aviation and marine transportation, by transitioning to alternative fuels and power sources, also could reduce GHG emissions over the medium to long term, although the level of potential reductions is uncertain. Aircraft and marine vessels could be powered by low-carbon biofuels or perhaps even hydrogen. While numerous technical challenges still exist, the main challenge to the use of alternative fuels will be the ability of aviation and shipping to compete with other transportation subsectors for a potentially limited supply of low-carbon biofuels. This could particularly be an issue with marine shipping, where the industry currently consumes the lowest-cost fuels available, namely residual fuel oil. Marine vessels could also benefit from switching to lower-carbon, conventional fossil fuels (e.g., liquefied natural gas and marine diesel oil) or to other renewable energy sources, such as wind or solar power.
Beyond technical measures, reducing the demand for aviation and shipping could achieve GHG reductions, though the potential impacts are probably limited. The challenge for these subsectors is that there are few suitable alternatives for the services provided by aviation and marine shipping. High speed rail could replace some passenger air travel, but currently there are few alternatives to marine shipping. Marine shipping is already the most efficient, lowest-cost form of transportation, aside from pipelines, which compete with shipping in just a few markets. With only modest cost increases likely to be achievable through policy intervention,2 and a limited
Globally, the majority of GHG emissions from the aviation and marine transportation are still unregulated. While some countries have enacted domestic policies, most have not. Independently, New Zealand, Australia, and the European Union have already taken steps to include aviation in their domestic GHG cap-and-trade programs. The United States does not yet regulate GHGs at the national level, although the U.S. Environmental Protection Agency may soon initiate such regulation under the federal Clean Air Act and there are legislative proposals under consideration in the U.S. Congress to incorporate these emissions in a domestic, economy-wide, GHG cap-and-trade program.
Addressing GHG emissions from international aviation and marine shipping is especially challenging, because they are produced along routes where no single nation has regulatory authority. Internationally, unlike other sources of GHG emissions, the Kyoto Protocol to the United Nations Framework Convention on Climate Change (UNFCCC) specifically excludes international emissions from aviation and marine transport from developed countries’ national targets. Instead, the Protocol calls for limitations or reductions in emissions from these sectors to be achieved by working through the International Civil Aviation Organization (ICAO) and the International Maritime Organization (IMO). In response to this mandate, both organizations have initiated activities aimed at addressing emissions from their respective sectors, but thus far neither has reached
agreement on substantive binding actions aimed at limiting GHG emissions, and many of the key issues remain unresolved. In response to the stalemate on this issue, some countries have proposed alternative options for addressing these emissions in a future climate agreement scheduled for conclusion in late 2009. Meanwhile, the EU has taken a unilateral measure to include international aviation in its GHG emission trading system (i.e., by covering emissions from all flights either landing at or departing from airports within the European Union).
In summary, the potential for mitigating GHG emissions from aircraft and marine vessels is considerable— reductions of more than 50 percent below BAU levels by 2050 from global aviation and more than 60 percent for global marine shipping are possible. For these reductions to be realized, however, international and domestic policy intervention is required. Developing an effective path forward that facilitates the adoption of meaningful policies remains both a challenge and an opportunity.
2. Overview of Aviation and Marine Transportation
There are three major types and uses of aircraft and marine3 vessels: commercial, recreational, and military. While all contribute to GHG emissions, of the three, commercial aviation and marine transportation account for the large majority of total aviation and marine emissions and are thus the focus of this paper. Commercial aviation and marine transportation demand and GHG emissions are also growing rapidly as a result of increasing international trade and economic growth (Table 1). Military and recreational aviation and marine transportation have vastly different objectives and employ somewhat different technologies; however, some of the mitigation options and policy solutions discussed herein may apply to these transportation modes as well.
Virtually all the fuels used in aviation and marine transport are petroleum-based. Kerosene-type jet fuel is by far the predominant aircraft fuel, accounting for about 99 percent of all aviation fuel consumed (EPA 2006). Domestic marine vessels consume a mix of distillate (diesel) fuel and residual fuel oil. International marine vessels predominantly use residual fuel oil. Aviation and marine fuels consumed during international trips are commonly referred to as “bunker fuels” to differentiate them from domestic uses of such fuels.4
2.1 Current Emissions and Trends
Domestic GHG emissions from ships and aircraft are those produced during trips between origins and destinations within the same country; emissions from trips between two different countries are considered international emissions. Emissions from domestic U.S. aviation and marine transport have been relatively stable since 1990 (Table 1), despite a lack of any policies regulating GHGs at the national level (EPA 2008a). Increasing energy efficiency in aviation (primarily motivated by market forces, e.g., fuel prices), and a decline in domestic shipping (driven by increasing competition from other modes), largely explain why this has been the case. Worldwide, international aviation and marine transportation emissions have been increasing steadily. This is largely due to globalization of the world economy and economic growth, which has made air travel affordable for a larger share of the population and contributed to an increased demand for traded goods, most of which are transported by marine vessels at some point in their supply chain, particularly to and from developing countries.
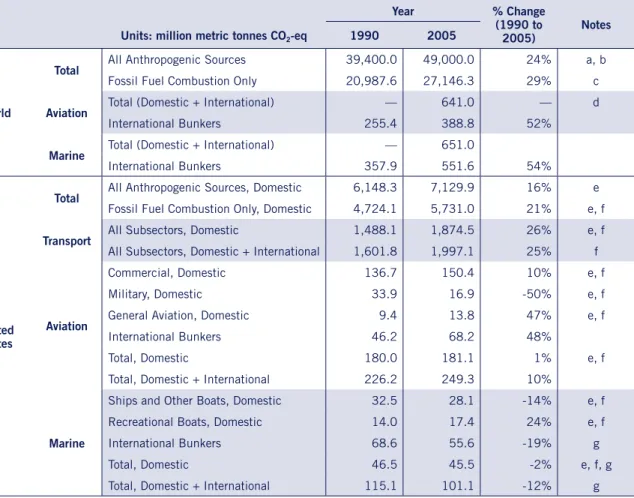
Table 1: U.S. And World Greenhouse Gas Emissions
Year % Change
(1990 to
2005) Notes
Units: million metric tonnes CO2-eq 1990 2005
World
Total All Anthropogenic Sources 39,400.0 49,000.0 24% a, b
Fossil Fuel Combustion Only 20,987.6 27,146.3 29% c
Aviation Total (Domestic + International) — 641.0 — d
International Bunkers 255.4 388.8 52%
Marine Total (Domestic + International) — 651.0
International Bunkers 357.9 551.6 54%
United States
Total All Anthropogenic Sources, Domestic 6,148.3 7,129.9 16% e
Fossil Fuel Combustion Only, Domestic 4,724.1 5,731.0 21% e, f
Transport All Subsectors, Domestic 1,488.1 1,874.5 26% e, f
All Subsectors, Domestic + International 1,601.8 1,997.1 25% f
Aviation
Commercial, Domestic 136.7 150.4 10% e, f Military, Domestic 33.9 16.9 -50% e, f General Aviation, Domestic 9.4 13.8 47% e, f International Bunkers 46.2 68.2 48%
Total, Domestic 180.0 181.1 1% e, f Total, Domestic + International 226.2 249.3 10%
Marine
Ships and Other Boats, Domestic 32.5 28.1 -14% e, f Recreational Boats, Domestic 14.0 17.4 24% e, f International Bunkers 68.6 55.6 -19% g Total, Domestic 46.5 45.5 -2% e, f, g Total, Domestic + International 115.1 101.1 -12% g
Notes
a Includes all GHG emissions due to human activities throughout the world: CO2 from fossil fuel use and other sources; CO2 from deforestation,
decay and peat; CH4 from agriculture, waste and energy; N2O from agriculture and others; and F-gases
b Data for 2005 not available; uses 2004 data instead
c Includes all GHG emissions due to fossil fuel combustion throughout the world d Does not include military or general aviation
e Does not include international aviation or marine bunker fuels, in keeping with UNFCCC guidelines
f Includes only CO2 emissions due to fossil fuel combustion. Does not include CH4, N2O, and HFCs, PFCs, or SF6
g Figures are not completely reliable due to potential data collection problems on reported residual fuel oil consumption and the difficulty in differentiating between domestic and international fuel consumption Sources: EPA 2008a; IEA 2008a; IPCC 2007
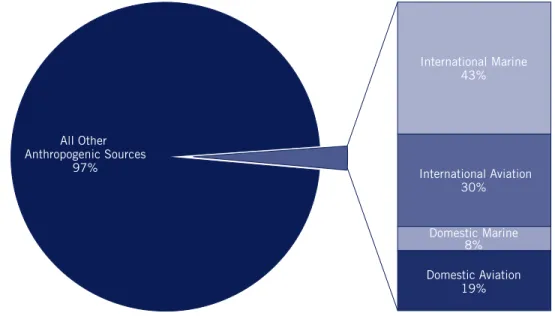
The International Energy Agency (IEA) reports that combined aviation and marine transport produce three percent of all anthropogenic GHG emissions globally, with each mode contributing to half of this share (Figure 1). Within this 3 percent, over two-thirds of the total emissions are caused by international transport (i.e., trips between two or more countries), with international marine shipping comprising the larger share of this (Figure 1 and Figure 2). However, the magnitude of marine transportation emissions is highly uncertain and potentially much greater than IEA estimates. Marine fuel sales data reported to IEA and used in top-down emission
countries. Bottom-up, activity-based methods (Corbett and Koehler 2003; Corbett and Koehler 2004; IMO 2008) estimate fuel consumption by considering the number of ships in the world fleet and estimating how often they are used (hours of operation), their power requirements, and how much fuel would be used to meet these requirements. While the data used in bottom-up methods may be more reliable than IEA fuel statistics, both methods contain many uncertainties, resulting in some debate about what is actually the best estimate of marine fuel use (Endresen, Sørgård et al. 2004). According to the most recent study, which relies on a bottom-up approach, CO2 emissions from marine transportation may be 50 percent greater than the IEA estimates shown here (IMO 2008), thus representing about three percent of global CO2 emissions in 2007.
In the United States, aviation and marine transportation—both domestic (within the United States) and international (travel between the United States and another country)—contribute five percent to total reported GHG emissions (Figure 3). In contrast to the global picture, U.S. emissions are dominated by domestic travel, specifically domestic aviation. However, the method for calculating the international portion of U.S. marine transport emissions may not offer an accurate estimate of the total share of international GHGs for which the United States is responsible. Currently, as specified per UNFCCC guidelines, international emissions attributed to the United States are based solely on U.S. sales of international bunker fuels. This may misrepresent the potential U.S. contribution to international marine transportation emissions, since ships can visit U.S. ports without refueling. International Marine 43% All Other Anthropogenic Sources 97% International Aviation 30% Domestic Marine 8% Domestic Aviation 19%
Figure 1: Global GHG Emissions from Domestic and International Aviation and Marine Transportation
in 2005
2.2 Aviation and Marine Transportation Demand
Demand for commercial aviation and marine transportation is growing rapidly, driven largely by increasing economic growth, globalization, and international trade (Boeing 2008; UN 2008).
Developing regions, notably Asia, account for the largest share of marine transportation demand through the export of manufactured goods and the import of petroleum products, grains, and raw materials (UN 2008). The principal trading partners of these regions are developed countries in North America and Europe, although
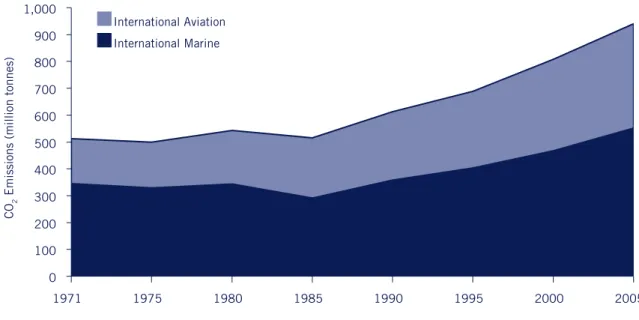
0 100 200 300 400 500 600 700 800 900 1,000 1971 1975 1980 1985 1990 1995 2000 2005 International Aviation International Marine CO 2
Emissions (million tonnes)
Figure 2: Global Growth in International Aviation and Marine CO
2Emissions
Source: IEA 2008a
International Marine 16% All Other Anthropogenic Sources 95% International Aviation 19% Domestic Marine 13% Domestic Aviation 52%
Figure 3: U.S. GHG Emissions from Domestic and International Aviation and Marine Transportation
in 2005
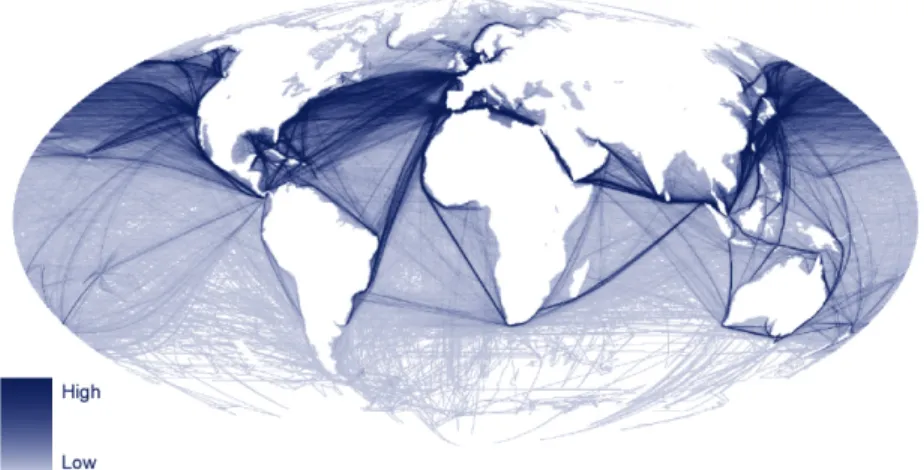
intra-regional trade, especially within Asia, is increasing as well. In 2007, as a group, Asia, the United States, and Europe accounted for most of the world’s international trade—81 percent of global exports and 94 percent of global imports on a tonnage shipped basis. Asia alone accounts for slightly more than half of this share—more than the United States and Europe combined. Global shipping patterns clearly indicate the vast amount of trade that occurs between Asia and the United States and Europe (Figure 4). Between 2000 and 2007, as the global economy grew rapidly, the volume of world merchandise exports increased at an average
Figure 4: Global Marine Shipping Traffic Density
*for Ships Greater than 1000 Gross Tonnes During 2005.
(Dark Shading Indicates A Higher Concentration of Ships.)
†*Traffic density is the amount of traffic per shipping area and used as a proxy for illustrating marine transportation emissions. It is calculated as
the number of ships per area weighted by the installed power capacity for each ship.
†GIS map data are from the National Center for Ecological Analysis and Synthesis, University of California, Santa Barbara. More information
avail-able at http://www.nceas.ucsb.edu/GlobalMarine/impacts. A similar map in color using this data has previously been published by Halpern, B.S., S. Walbridge, et al. (2008). 0 200 400 600 800 1000 1200 1400 1600 1970 1975 1980 1985 1990 1995 2000 2005 Million T ons Shipped Domestic International
Figure 5: Growth in U.S. Domestic and international Marine Transportation Demand, 1970–2005
was transported by marine vessels (UN 2008). International trade continues to drive growth in demand for international shipping in to and from the United States as well, which increased at a rate of 2 percent per year between 2000 and 2005 (Figure 5) (ORNL 2008).
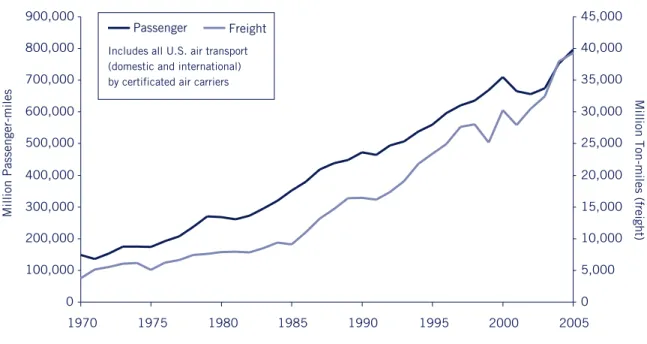
Demand for air travel (passenger and freight5) is driven by both domestic and international leisure and business travel, as well as economic growth and international trade. Air travel experienced exceptionally high growth over the past several years. Between 2000 and 2006, global demand for passenger aviation grew at an average annual rate of 3.8 percent (Boeing 2008), with much of this growth taking place outside the United States. For example, demand for domestic air transport within China grew at 15.5 percent per year from 2000 to 2006 (Boeing 2008), while demand within the United States grew at just 2.2 percent per year (Figure 6) (ORNL 2008). Globally, most air traffic occurs within and between North America, Europe, and Asia (Kim, Fleming et al. 2007). With a slowing in global economic activity in 2008 and 2009, demand for air travel has also declined; however, it is still expected to continue to grow in the future.
2.3 Business-As-Usual Growth Projections
Demand for aviation and marine transportation is expected to grow substantially in the long term. Since most growth will take place outside the United States, the U.S. percentage contribution to aviation and marine shipping emissions is expected to gradually decline over time (Table 2).
The rising demand for aviation and shipping is expected to significantly increase GHG emissions from these
0 0 100,000 200,000 300,000 400,000 500,000 600,000 700,000 800,000 900,000 5,000 10,000 15,000 20,000 25,000 30,000 35,000 40,000 45,000 1970 1975 1980 1985 1990 Passenger Freight 1995 2000 2005
Includes all U.S. air transport (domestic and international) by certificated air carriers
Million Passenger-miles
Million Ton-miles (freight)
Figure 6: Growth in U.S. Aviation Transportation Demand, 1970–2005
*Source: ORNL 2008
*“Passenger-miles” (or passenger-km) and “Ton-miles” (or tonne-km) are calculated by multiplying the total number of passengers or weight aboard a vehicle by the distance traveled.
because growth rates for aviation and marine travel are higher than energy efficiency improvements. Furthermore, low-carbon fuels are not expected to achieve significant enough market penetration to lower GHG emissions, from the aviation and marine transportation sectors in a BAU scenario due to their relatively high costs (Table 3).
Advances in the efficiency of the aviation sector have been substantial; however, annual improvements have significantly slowed over the past two decades (IEA 2008b; ORNL 2008). A variety of technological and operational efficiency improvements, including changes in new aircraft and engines, as well as increased load factors (number of passengers per plane) led to these efficiency gains. Market forces (i.e., fuel costs) and government-sponsored research and development (R&D) efforts were primarily responsible for motivating these technological and operational improvements. These motivating factors are likely to continue in a BAU future, as fuel is a significant component of airline costs—historically 25 to 65 percent of combined direct operating and investment costs (DOC+I), or 12.5 to 32.5 percent of total airline costs (Lee, Lukachko et al. 2001).6 However, to drive aviation advancements beyond BAU, policies and incentives will be required.7
The global shipping fleet relies almost entirely on diesel engines, which have gradually grown more efficient over the years (IMO 2008). However, there is little information available on historical trends in overall shipping energy efficiency. While new diesel engines have made new ships more energy efficient, changes in operations (for example increased speeds) have countered these improvements to some extent. What little research has been conducted suggests there has been little change in marine shipping efficiency over the past 20 to 30 years (Faber, Boon et al. 2007).
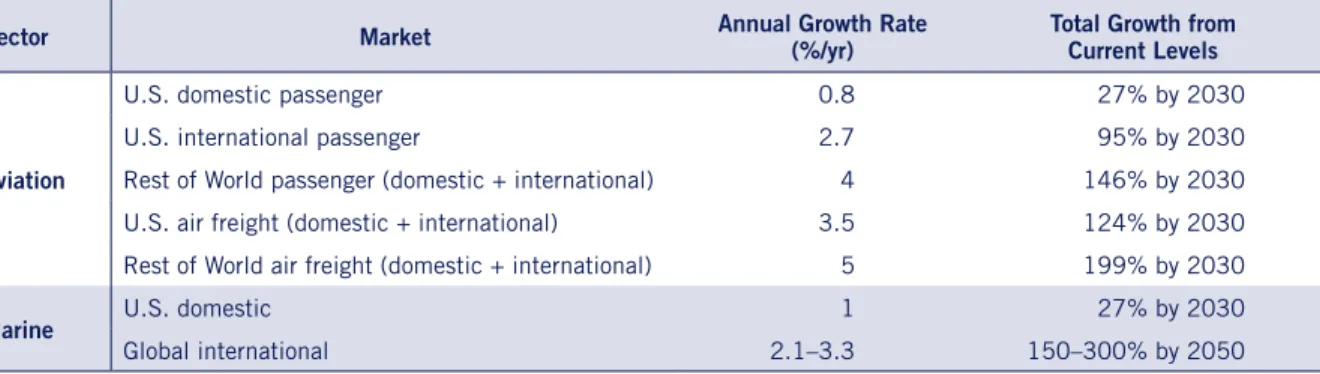
Table 2: Aviation and Marine Sector Demand Projections
Sector Market Annual Growth Rate (%/yr) Total Growth from Current Levels
Aviation
U.S. domestic passenger 0.8 27% by 2030 U.S. international passenger 2.7 95% by 2030 Rest of World passenger (domestic + international) 4 146% by 2030 U.S. air freight (domestic + international) 3.5 124% by 2030 Rest of World air freight (domestic + international) 5 199% by 2030
Marine U.S. domestic 1 27% by 2030
Global international 2.1–3.3 150–300% by 2050
Source: EIA 2009; IMO 2008.
Table 3: Aviation and Marine Greenhouse Gas Emission Projections
Sector Market Total Growth from Current Levels
Aviation
U.S. passenger and freight (domestic + international) 31–35% by 2030 Global passenger and freight (domestic + international) 60% by 2030
300% by 2050
Marine Global shipping 120–220% by 2050
Non-CO
2Emissions from Aircraft and Marine Vessels
In addition to carbon dioxide emissions, other, non-CO2 emissions from aircraft and marine vessels have a significant impact on radiative forcing (RF)* and climate change (Endresen, Sørgård et al. 2003; IPCC 1999; Schäfer, Heywood et al. 2009). The principal GHG emitted by ships and planes, and the main focus of this paper, is CO2. However, aircraft and marine vessels also emit other chemical compounds that impact RF. These include methane (CH4) and nitrous oxide (N2O), as well as hydrocarbons (HC), particulate matter (PM), sulfur oxides (SOx), and nitrogen oxides (NOx). In some cases, these emissions are a function of more than just fuel consumption: altitude, humidity, fuel quality, and engine operating conditions also play a role. In addition, aircraft emit water vapor (H2O) as a result of fuel combustion, which forms “contrails” (or condensation trails) under certain atmospheric conditions. Non-CO2 emissions and contrails tend to be much shorter-lived than CO2 emissions, and depending on where they occur may have a positive (warming) or negative (cooling) RF.
Aircraft and marine vessels emit significant amounts of NOx, which at high altitudes promote the formation of ozone (O3), a radiatively active gas with a regional warming effect (Endresen, Sørgård et al. 2003; Schäfer, Heywood et al. 2009). Yet, NOx emissions can also accelerate the removal of atmospheric methane. Since methane has a strong warming effect, removing methane has a cooling effect on the climate that is believed to be global in nature. In addition, aircraft and marine vessels emit large amounts of particulate matter and water vapor; this can promote cloud formation with varying impacts on RF. Water vapor and fine particulates from aircraft flying at high altitudes in cold, moist air produce contrails. Once formed, contrails can spread and eventually form clouds resembling natural cirrus. The increased cirrus cloud cover alters the atmosphere’s radiation budget, because contrails trap outgoing radiation at a greater rate than they reflect incoming radiation. While subject to considerable uncertainty, this is generally thought to have a regional net warming effect (Ponater, Marquart et al. 2005; Schäfer, Heywood et al. 2009). A similar phenomenon referred to as “ship tracks” has been observed with oceangoing marine vessels (Durkee, Noone et al. 2000; Lauer, Eyring et al. 2007). Although the exact physics are not well understood, it appears that black carbon and sulfate particle emissions from diesel exhaust promote cloud formation in the marine boundary layer (a thin layer of air near the ocean surface). The low elevation of ship tracks results in less trapping of infrared radiation than for contrails, resulting in a cooling effect (Endresen, Sørgård et al. 2003). The total radiative forcing of contrails, ship tracks, and other emissions from airplanes and ships remains highly uncertain and is an area of active research (Brasseur 2008; Endresen, Sørgård et al. 2003).
Lee et al. (2009) estimate that if aviation-induced cirrus cloud formation is ignored, radiative forcing due all global aviation emissions accounted for 3.5 percent of total RF from all anthropogenic sources in 2005. If aviation-induced cirrus clouds are considered, this figure rises to 4.9 percent. When these estimates are compared to aviation’s 1.5 percent share of global anthropogenic CO2 emissions, it becomes clear that non-CO2 emissions from airplanes and ships are very important. Dealing with these emissions through policy has proven to be especially challenging, however, due to scientific uncertainties and a lack of consensus in preferred policy approaches. Hence, CO2 is still the main focus of existing GHG policies.
To date, no agreement has been reached on a suitable metric for calculating the radiative forcing effects of non-CO2 emissions on an equivalent basis to CO2 (Lee, Fahey et al. 2009). This is due to the inherent difficulty in treating short-lived (non-CO2) and long-lived (CO2) species the same way (Marbaix, Ferrone et al. 2008). Taking into account the potentially significant RF effects of contrail formation, nitrogen oxides, and other non-CO2 compounds, as well as their lifetimes, the climate change impacts of high-altitude aircraft emissions (H2O, NOx, SOx, and PM) are likely 50 to 300 percent greater than if the same emissions were released at ground level—though it is important to note that these estimates are still highly uncertain and are the subject of considerable debate. Because of the difficulty in comparing non-CO2 and CO2 emissions, some have proposed more direct policy instruments that deal with such emissions on a case-by-case basis as the best option for dealing with the non-CO2 effects of aviation and marine transportation (Lee, Fahey et al. 2009).
* Radiative forcing refers to an externally imposed perturbation in the radiative energy budget of the Earth’s climate system, which may lead to changes in climate parameters.
3. Technological Mitigation Options and Potential
GHG emissions from aviation and marine transportation are a product of each mode’s activity (distance traveled), energy efficiency of the vehicles, and the fuel carbon intensity. This section provides an overview of technological options to reduce GHG emissions. For a more detailed discussion of aviation technologies, as well as alternative fuel options in both the aviation and marine transportation sectors, see Appendix I.
In the short term, efficiency can be increased through system improvements that reduce travel distances and congestion, and by optimizing the way each aircraft or ship is operated in order to save fuel. Improving efficiency through the design of new aircraft, ships, and propulsion systems offers potentially significant, though more uncertain, medium- (2025) to long-term (2050) GHG reductions. The potential GHG benefits from reducing the carbon intensity of energy used in the aviation and marine transportation sectors, primarily through switching to lower-carbon fuels such as biofuels, natural gas, or hydrogen, is also uncertain but could be significant. The success of shifting to low-carbon fuels will depend on their availability and the ability of the aviation and shipping sectors to compete with other modes and sectors for them. Ensuring that biofuels can be produced with low lifecycle GHG emissions will also determine their success, though significant uncertainty still remains (Peña 2008).
Reducing the demand for aviation and shipping could help mitigate GHG emissions to some extent. This could be accomplished either through shifting to less GHG-intensive transportation modes or by reducing total transportation demand. Market-based policies, such as a cap-and-trade program that includes transportation, may have little impact on reducing transportation demand unless carbon prices are very high. For example, the European Union has estimated the reduction in transportation demand from including aviation in its GHG Emissions Trading Scheme, and initial results show only small changes (Batchelor 2008). In terms of mode shifting, there is some potential to reduce the demand for passenger air travel by switching to high speed rail; however, high speed rail is not a substitute for long-distance or transoceanic flights. Finally, while advanced telecommunications and teleconferencing technologies have also been discussed as a possible substitute for air travel, the extent to which they can substitute on a global scale is unknown (Mokhtarian and Salomon 2002).
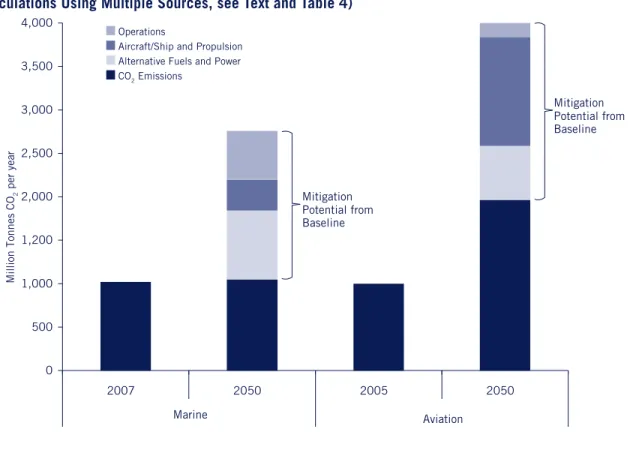
An estimation of the GHG mitigation potential from the global aviation and marine transportation subsectors is summarized in Figure 7 and Table 4. Combining the various abatement options, the potential exists to reduce annual emissions from global aviation by more than 50 percent below BAU in 2050. Reductions of more than 60 percent are possible from global marine shipping. This potential is moderately
though does depend on their full utilization. In the authors’ judgment, these levels of mitigation should be achievable in a future world with emission prices of $50 to $100 per metric ton of CO2. Even with a price on carbon dioxide, a concerted R&D effort to bring these technologies to fruition will be necessary. Higher levels of GHG reductions could be achieved if the aviation and marine transportation subsectors are able to make much greater use of low-carbon alternative fuels than what is assumed here, which would also likely necessitate strong policy intervention.
3.1 Aviation
A number of technological and operational options are available to limit the rapid growth in aviation GHG emissions expected in a business-as-usual future. These include improved navigation systems in the near to medium term and advanced propulsion systems, lightweight materials, improved aerodynamics, new airframe designs, and alternative fuels over the medium to long term. Combining the various abatement options, the potential exists to reduce annual GHG emissions from global aviation by more than 50 percent below BAU projections in 2050 (Figure 7 and Table 4).
Marine 0 500 1,000 1,200 2,000 2,500 3,000 3,500 4,000 2007 2050 2005 2050 Million Tonnes CO 2 per year Aviation CO2 Emissions
Alternative Fuels and Power Aircraft/Ship and Propulsion Operations Mitigation Potential from Baseline Mitigation Potential from Baseline
Figure 7: Global GHG Mitigation Potential from Aviation and Marine Transportation (Based on Authors’
Calculations Using Multiple Sources, see Text and Table 4)
Operational Efficiency
In the near term, the most promising strategies for improving the efficiency of aircraft operations are improvements to the aviation system: advanced communications, navigation and surveillance (CNS) and air traffic management (ATM), as opposed to changes to the aircraft itself. In the United States, these improvements are embodied in the Next Generation Air Transportation System (NextGen) initiative, which has the potential to decrease aircraft fuel consumption and improve aviation operations by shortening travel distances and reducing congestion in the air and on the ground (GAO 2008). A similar project, Single European Sky ATM Research (SESAR), is being developed in Europe. ICAO estimates that by 2015, airlines in the United
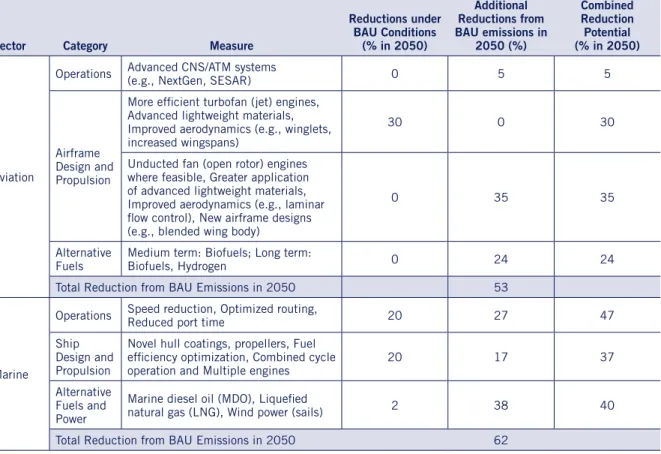
Table 4: Summary of GHG Reduction Potentials in 2050 by Abatement Option and Sector
Sector Category Measure
Reductions under BAU Conditions (% in 2050) Additional Reductions from BAU emissions in 2050 (%) Combined Reduction Potential (% in 2050) Aviation
Operations Advanced CNS/ATM systems (e.g., NextGen, SESAR) 0 5 5
Airframe Design and Propulsion
More efficient turbofan (jet) engines, Advanced lightweight materials, Improved aerodynamics (e.g., winglets, increased wingspans)
30 0 30
Unducted fan (open rotor) engines where feasible, Greater application of advanced lightweight materials, Improved aerodynamics (e.g., laminar flow control), New airframe designs (e.g., blended wing body)
0 35 35
Alternative
Fuels Medium term: Biofuels; Long term: Biofuels, Hydrogen 0 24 24 Total Reduction from BAU Emissions in 2050 53
Marine
Operations Speed reduction, Optimized routing, Reduced port time 20 27 47 Ship
Design and Propulsion
Novel hull coatings, propellers, Fuel efficiency optimization, Combined cycle
operation and Multiple engines 20 17 37 Alternative
Fuels and Power
Marine diesel oil (MDO), Liquefied
natural gas (LNG), Wind power (sails) 2 38 40 Total Reduction from BAU Emissions in 2050 62
Notes
* BAU reductions are the expected effeciency improvements and corresponding GHG reductions under a business as usual scenario. Additional reductions are those emission reductions that can be achieved under more agressive technology penetration and alternative fuel use scenarios; they are shown as percentage reduction in 2050 emissions from the BAU baseline.
* Within each sub-sector, total GHG reduction is multiplicative in order to avoid double counting (e.g., (1-0.1)*(1-0.2) = 0.72 = 1-0.28, a 28 percent reduction rather than a 30 percent reduction).
* Technological and operational mitigation potentials are based on authors’ calculations. Marine estimates are from MARINTEK (2000), and BAU projections from IMO (2008). Aviation estimates are from various sources discussed in text, and BAU projections from IEA (2008b).
* Alternative fuels consumption in aviation sector assumes that 30 percent of global petroleum-based jet fuel demand in 2050 is replaced with biofuels (no hydrogen) and that the lifecycle GHG emissions of biofuels are 80 percent lower than petroleum fuels (both assumptions consistent with IEA (2008b)). Annual biofuels demand in 2050 is roughly 9,420 PJ (66 billion gallons), requiring approximately 18,839 PJ (1.26 billion dry tonnes) of biomass, or 12.6 percent of the estimated annual global supply of sustainable biomass in 2050 (IEA, 2008b).
ATM systems (GBD 2005). Even greater savings—5 to 10 percent—are possible in the medium term (Schäfer, Heywood et al. 2009).
Under a BAU scenario, market forces are unlikely to drive the adoption of these systems; hence policy will be needed. Aircraft infrastructure and CNS/ATM systems are heavily regulated and, in the case of NextGen and SESAR, dependent on government support (see Section 4). The development of NextGen is one of the main R&D goals of the U.S. Federal Aviation Administration (FAA), as stated in its annual report to Congress, the National Aviation Research Plan (NARP).8
Moreover, it is important to note that the bulk of fuel savings reported for advanced CNS/ATM systems will be achieved upon initial implementation—i.e., a step-change in operational efficiency will be followed only by incremental further improvements. In addition, GHG reductions from the increase in system efficiency will be negated to some extent by the higher demand caused by the increase in capacity that these systems will create. This is similar to what is typically observed when highway capacity is increased by adding more lanes. Faber et al. (2008) estimate that in the European Union, for example, half of the benefits of the SESAR initiative will be offset by an increase in demand.
Aircraft Efficiency
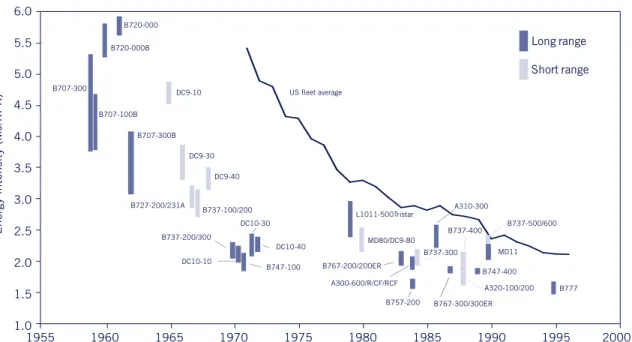
As conventional aircraft move closer to an optimal configuration, annual efficiency improvements are slowing (Figure 8) (IEA 2008b; ORNL 2008). However, the efficiency of the U.S. and global aircraft fleets will continue to improve as older, less efficient aircraft are retired and then replaced with new, more efficient aircraft. The Air Transportation Association of America (ATA), which represents the nation’s leading airlines, has set a goal of increasing the industry’s fuel efficiency by 30 percent from 2005 to 2025 (ATA 2009); this translates into a 23 percent reduction in energy intensity. According to Lee, Lukachko et al. (2001), if historical trends in technology continue to 2025, a decline in new airplane energy intensity of 1.2 to 2.2 percent per year could be expected. Due to long aircraft lifetimes (typically 20 to 30 years), new technology that is commercially available by 2025 is expected to represent the fleet average by 2050 (Lee, Lukachko et al. 2001). Hence, under a BAU scenario, the energy intensity of U.S. aviation (e.g., fleet-average megajoules per passenger-mile) is expected to decrease by at least 30 percent between now and 2050. This reduction will be achieved by utilizing currently known technologies: more efficient propulsion systems (engines), advanced lightweight materials, and improved aerodynamics (e.g., winglets, increased wingspans) (IEA 2008b; Lee, Lukachko et al. 2001; Schäfer, Heywood et al. 2009). Varying combinations of these technologies have already been employed on existing state-of-the-art aircraft, such as the existing Airbus A380, and they will also be utilized on the future Airbus A350 and Boeing 787.9
Going beyond BAU is possible with further energy efficiency improvements. Widespread application of current state-of-the-art technology combined with the adoption of more advanced technologies (e.g., laminar
flow control and new engine designs) could increase reductions in energy intensity to 50 percent below current levels, or 20 percentage points beyond BAU by 2050 (IEA 2008b; Lee, Lukachko et al. 2001; Morris, Rowbotham et al. 2009; QinetiQ 2008). The most advanced, and thus most uncertain, technologies (e.g., full body laminar flow control and blended wing body airframes) have the longer-term potential to contribute an additional 10 to 15 percentage point reduction by 2050. In total by 2050, global adoption of these more advanced aircraft technologies could reduce aviation GHG emissions by as much as 35 percent below what is expected under BAU projections (Figure 7 and Table 4).
Early aircraft retirement programs might be able to push this mitigation potential slightly higher by 2050. However, given that early aircraft retirement is one of the most expensive GHG abatement options, either fuel or carbon prices (or both) will need to be quite high for this mitigation strategy to become attractive (Morris, Rowbotham et al. 2009). Airlines already change older aircraft engines for new ones and modify the airframes (e.g., by adding winglets) of their aircraft fleets on a periodic basis, and this will continue in a BAU future. Thus, the added benefits of early retirement programs (beyond BAU) may not be large.
The costs of achieving GHG reductions through the abatement options described above are still uncertain in many cases (Dray, Evans et al. 2009; Morris, Rowbotham et al. 2009). Morris et al. (2009) have conducted the most comprehensive and rigorous study to date on marginal abatement costs (MAC) in the aviation sector. Their analysis, which focuses on the UK and European aviation fleets, finds that MACs range widely depending on abatement option and timeframe: in the case of Europe in 2025, costs range from -£148 to +£205 per
A300-600/R/CF/RCF MD80/DC9-80 1.0 1.5 2.0 2.5 3.0 3.5 4.0 4.5 5.0 5.5 6.0 1955 1960 1965 1970 1975 1980 1985 1990 1995 2000 Energy intensity (MJ/RPK) B720-000B B727-200/231A B737-300 B737-400 MD11 Long range Short range US fleet average B720-000 B707-300 DC9-10 B707-100B B707-300B B737-100/200 DC9-30 DC9-40 DC10-30 DC10-40 B747-100 DC10-10 B737-200/300 B777 B737-500/600 A310-300 A320-100/200 B747-400 B757-200 B767-300/300ER B767-200/200ER L1011-500Tristar
Figure 8: Evolution of Aircraft Energy Intensity, New Aircraft and U.S. Fleet Average
Notes: 1) The bar for each aircraft reflects varying configurations; the line shows estimated fleet average for the United States across all existing aircraft. 2) RPK = revenue passenger kilometer = number of passengers carried x distance flown (in km).
ton of CO2 (-$222 to +$308 per metric ton CO2),10 assuming an oil price of $75 per barrel. Actually, most of the abatement options, accounting for greater than half of all potential GHG reductions, can be achieved at MACs below £73 ($110) per ton. These include all abatement options except for biofuels and early aircraft retirement. In fact, many technologies and strategies have negative costs (i.e., they yield net positive economic benefits through fuel savings over their lifetimes)—for example, CNS/ATM improvements and increased use of turboprops, winglets, and lightweight materials. Examples of abatement options with positive costs, though still less than £73 ($110) per metric ton CO2, include engine upgrades or replacement, open rotor (UDF) engines, and blended wing body airframes.
3.2 Marine Transportation
GHG emissions can be mitigated from shipping by increasing efficiency (i.e., decreasing fuel consumption/ ton-mile) and using less GHG-intensive fuels or power sources. Operational measures, such as speed reduction, offer a large and near-term mitigation option, while improving the energy efficiency of new ships and switching to alternative fuels provide longer-term potential. However, absent a technological breakthrough, application of all available technological mitigation options could slow, but is not likely to be enough to stop, the rising emissions caused by increasing demand for shipping (IMO 2008).
Operational Efficiency
Immediate reductions in GHG emissions are available from all ships by reducing speed. For example, a 50 percent reduction in viscous resistance (resistance between the hull and water) is achieved by just a 3 knot (3.5 MPH) reduction in speed for a typical container ship (MARINTEK 2000). Some shippers have reduced their speeds in response to high fuel prices (Corbett, Wang et al. 2009). However, reducing speed also reduces shipping capacity. To maintain shipping supply, more frequent trips or increasing ship utilization (the load factor) is required. The extra trips or cargo also increase fuel consumption, but overall the result is a net reduction in fuel consumption and CO2 emissions. Corbett et al. (2009) find that reducing speeds by 10 to 50 percent can reduce CO2 emissions from container ships by 20 to 70 percent if no extra ships are needed to maintain supply, or 5 to 40 percent when they are. However, high carbon prices from $36 to $200 per metric ton of CO2 would be required to drive these changes (carbon prices on the European ECX have been $10 to $40 per ton of CO2 over the past year). Reductions for other types of ships would be less, due to their already slower speeds. The reduction in shipping supply from reduced speeds can also be countered by increasing port efficiency and by optimization of complementary land-side intermodal transport systems, allowing for faster ship turnaround times. For the entire shipping sector, the maximum feasible mitigation potential from speed reduction, considering the requirements of shippers and their customers, has been estimated at 40 percent (MARINTEK 2000).
Additional optimization of shipping logistics, routing and maintenance could reduce CO2 emissions by 3 to 12 percent (MARINTEK 2000). Efficiency could be improved through increased ship utilization (increased load factor), improved and more consistent maintenance practices, optimized ship control, and route planning optimized for current weather conditions and ocean currents (IMO 2008; MARINTEK 2000). The maximum mitigation potential available from all operational improvements is about 27 percent after accounting for expected BAU improvements out to 2050.
Ship Efficiency
Technological mitigation options for new ships, aside from alternative fuels and power, include larger ship sizes, hull and propeller optimization, more efficient engines, and novel low-resistance hull coatings.
Larger ship sizes improve efficiency by exploiting economies of scale (IMO 2008)—one large ship with the volume of two smaller ships weighs less and has less hull area in contact with the water, reducing resistance. Doubling the size of a ship could increase energy efficiency by up to 30 percent (Interlaboratory Working Group 2000). Thus far, the industry trend has been towards massive container and cargo ships (UN 2008). However, practical limitations to increasing ship size exist: canal size, harbor depths, port cargo handling equipment, ability to aggregate cargo into fewer larger shipments, and capacity of ground transportation networks (IMO 2008; MARINTEK 2000). To some extent, these limitations are being overcome, but they are costly and take time to implement (UN 2008).11
Hull and propeller optimization is available for new ships, and has the potential to reduce CO2 emission by a combined 28 percent for each new ship (MARINTEK 2000). The relative costs would be minimal for larger ships, but the full mitigation potential will not be realized until the current fleet of ships is retired (ships have a typical life time of 20 or more years) (MARINTEK 2000).
Ninety-six percent of commercial shipping power is produced by highly efficient low- to medium- speed diesel engines (Eyring, Köhler et al. 2005). These engines commonly achieve efficiencies near 50 percent, which is higher than most diesel engine applications, since ships typically operate at steady state under high load conditions (Interlaboratory Working Group 2000; Lovins, Datta et al. 2005). However, there still is some potential for further gains. Currently, engines are optimized for a specific ship design speed, and operation outside of optimized conditions results in reduced efficiency (IMO 2008). A more flexible design utilizing a series of smaller diesel-electric engines, each optimized for a single speed, that power an electric drive may lead to greater efficiencies. This type of configuration is currently the trend in fuel-efficient diesel locomotive design (EPA 2008b); however, there seems to be some disagreement over the potential benefits when applied to ships (Eyring, Köhler et al. 2005; MARINTEK 2000). Combined-cycle diesel engines, which recover energy from waste heat, as is current practice in many stationary power plants, could also increase the efficiency of ships (MARINTEK 2000).
Technological mitigation options are available for the existing fleet include tuning engines for energy efficiency and novel hull coatings. Increasing the efficiency of existing engines could reduce their energy consumption by up to 7 percent (MARINTEK 2000). Novel hull coatings and similar technologies, which reduce resistance (for example, perhaps by using special polymers or tiny air bubbles), have a large mitigation potential, but such coatings are still under development and are thus considered a longer-term option. Most diesel engines are also optimized for NOx reduction, which consequently decreases fuel efficiency. Development of advanced NOx after-treatment retrofit technologies could allow engines to be re-optimized to save fuel (Eyring, Köhler et al. 2005; MARINTEK 2000).
Overall, the potential to reduce GHG emissions from marine transportation is large (Figure 7 and Table 4). Changes in operations (mainly speed reduction) could reduce marine transportation emissions by up to 47 percent from today’s shipping fleet (MARINTEK 2000). Additional technical fixes (e.g., upgrading current engines) for the existing fleet could reduce emissions by up to 7 percent. For new ships, increased size, optimized hull and propeller designs and even more efficient diesel engines could reduce emissions by up to 37 percent from today’s shipping fleet (MARINTEK 2000). A recent IMO (2008) study estimates that by 2050 under a BAU scenario, operational efficiency improvements and ship and engine efficiency improvements will each yield a 20 percent reduction in emissions. That leaves an additional 27 percent mitigation
potential available from operational efficiency improvements and 17 percent from ship and engine efficiency improvements. However, the costs of most mitigation options for marine transportation are not well understood or reported. Improved estimates of mitigation potential and costs should be available in a new study by the IMO, scheduled to be completed by mid-2009.
3.3 Alternative Fuels and Power
Alternative fuels and power sources also have the potential to significantly reduce or eliminate GHG emissions from ships and aircraft (Figure 7 and Table 4). Yet as with other sectors, alternative aviation and marine fuels face numerous challenges with respect to their production, distribution, and cost, and it is not entirely clear what quantity of these fuels will be available and when, or what magnitude of GHG benefits can ultimately be achieved by using them (Fargione, Hill et al. 2008; IPCC 2007; Peña 2008; Searchinger, Heimlich et al. 2008). The availability of alternative fuels (particularly the biological feedstocks needed for biofuel production) and the ability of aviation and marine transportation to compete with other modes and sectors for them are uncertain. Additionally, to significantly contribute to GHG mitigation, the lifecycle carbon footprints of these fuels needs to be significantly lower than the conventional fuels they replace.
The marine transportation sector could also utilize alternative energy sources currently in use or under development for application in other sectors. (Eyring, Köhler et al. 2005; IMO 2008; MARINTEK 2000). In the near to medium term, a 4 to 15 percent reduction in GHGs can be achieved by substituting marine diesel oil or
the use of LNG will result in a small 2 percent reduction in CO2 emissions from current levels by 2050. However, there appears to be a much greater potential to use LNG aboard most ships if constraints on the availability of LNG at ports can be overcome. The use of LNG, coupled with alternative energy sources, such as wind power (sails), can reduce emissions by up to 40 percent from current levels by 2050. Other alternative fuel and power sources, such as biofuels, solar photovoltaic cells and fuel cells, appear to be more uncertain, longer-term options.
The potential for fuel switching on jet aircraft is rather limited in the near to medium term, at least compared to on-road vehicles (Lee, Fahey et al. 2009; Saynor, Bauen et al. 2003). The only feasible options for “drop-in” replacements to petroleum-based jet fuels include hydroprocessed renewable jet fuel (HRJ)12 and Fischer-Tropsch (FT) fuels.13 A plant- or animal-based oil can be hydroprocessed to create a synthetic bio-based fuel that is chemically identical to petroleum-bio-based jet fuel. The FT process can also use any of several biomass or fossil feedstocks (potentially with carbon capture and storage at the point of fuel production) to produce a jet fuel replacement. It is important to note that these types of jet fuel-like alternative fuels are not the same as those being discussed for road transport applications (e.g., ethanol and biodiesel). Liquid hydrogen (via any number of low-carbon pathways) may offer a potentially longer-term alternative fuel option, though significant challenges exist, such as the redesign of aircraft and engines to use hydrogen fuel (GBD 2005; Janic 2008; Saynor, Bauen et al. 2003). There is significant interest from airlines and aircraft manufacturers in using alternative fuels. The International Air Transport Association (IATA) has set a goal for its member airlines to use 10 percent “alternative” fuels by 2017 (IATA 2009). Over the past year, several airlines and aircraft manufacturers have successfully conducted test flights with bio-based HRJ.
3.4 Alternative Modes of Transportation
Shifting air or marine transportation to alternative modes has some additional potential to reduce GHG emissions.
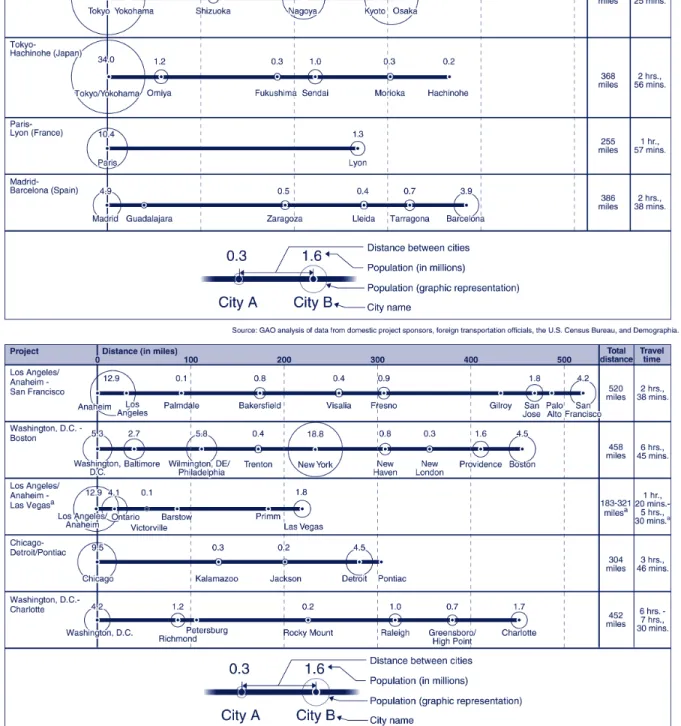
High speed rail (HSR) can potentially substitute for short-distance passenger air travel, mitigating GHG emissions through greater efficiency and use of less carbon-intensive energy (e.g., electricity from renewables) (Givoni 2007; IEA 2008b). The energy use per passenger-mile for HSR could be as much as 65 to 80 percent less than air travel. However, the energy intensity and carbon footprint of HSR depend strongly on the design of the system, namely operating speeds and distances between stops, and passenger load factors, which depend on demand for HSR service between cities (CHSRA 2009; IEA 2008b). The European and Japanese experience has shown high speed rail to generally be competitive with air travel on routes of up to 300-500 miles (500-800 km), where there is existing high demand for intercity travel and where several high-population areas can be connected along a single corridor (de Rus and Nombela 2007; GAO 2009; Givoni 2007; IEA 2008b; Jamin, Schäfer et al. 2004; Park and Ha 2006).
world (Figure 9). A rigorous study by Jamin et al. (2004) shows that if high speed rail systems were to connect major metropolitan areas throughout the United States, the energy and emissions benefits would be relatively modest due to insufficient traffic volumes in many cases: less than a 3 percent reduction in total U.S. domestic air traffic volume would be achieved, with consequently modest reductions in energy use and emissions. On the other hand, recognizing that connecting major downtowns is not the only potential market for HSR, Johnson et al. (1989) argued that high speed rail should be thought of as a complement to air travel rather than as a competitor with it. The authors estimated that if U.S. airlines integrated HSR into their hub-and-spoke networks, substituting HSR for feeder service flights to major hubs, domestic airlines could achieve fuel savings of 12 to 17 percent.14
In addition, high speed rail may provide other benefits compared to air travel, such as reductions in local air pollution, noise, and air and roadway congestion; moreover, combined with strong land-use and urban planning policies, HSR has the potential to re-structure urban development patterns. The American Recovery and Reinvestment Act of 2009 (i.e., the economic stimulus package) includes more than $8 billion to help finance high speed rail corridors throughout the United States (P.L.-111-5 2009). This represents only a fraction of what would be needed to build an expansive HSR network; for example, California’s proposed high speed rail line between San Francisco and Los Angeles is estimated to cost $45 billion15 (GAO 2009). HSR also holds promise as a mitigation strategy for the developing world, where adequate on-land transportation infrastructure often does not exist.
GHG emissions can also be reduced by shifting goods movement and transportation from more energy-intensive modes (e.g., trucks and freight rail) to ships, where feasible. The concept is known as short sea shipping and is defined as the relatively short distance transport of goods by smaller ships between ports (TEMS 2008). This would increase emissions from marine transportation but would have an overall effect of reducing total emissions from goods movement. The main challenge facing short sea shipping is its slow speed compared to other modes. However, this gap can be reduced through the use of roll-on/roll-off ships (known as ROROs, ships that trucks can drive on and off of, similar to a ferry) and by off-loading large container or bulk carrier ships directly onto smaller ships for delivery to nearby ports, both of which can reduce cargo handling times at ports (drayage). While short sea shipping is unlikely to achieve comparable speeds to land-based transportation, it potentially offers large cost savings due to its energy efficiency and reduced drayage costs. The mitigation potential of a mode shift to shipping from land-based freight ultimately depends on the balance of shipper preferences for speed vs. low costs.
Figure 9: Population of Cities Along Selected Foreign (Top) and Current and Proposed U.S.
(Bottom) High Speed Rail Lines
4. Policy Options: Achieving Deep and Durable Reductions
As this paper has discussed, the technological and operational potential for reducing international and domestic GHG emissions from aircraft and marine vessels is considerable; however, the rate of improvement under business-as-usual conditions is unlikely to be sufficient to eliminate the projected growth in emissions from steadily increasing demand (Eyring, Köhler et al. 2005; IEA 2008b; IMO 2008). To slow and eventually reverse this growth, policy intervention is required in the form of regulations or incentives to accelerate the adoption of fuel-saving advanced technologies and operational measures. This section outlines domestic and international policy options for reducing GHG emissions from aviation and marine transportation. Whereas GHG emissions from domestic aviation and shipping are clearly the responsibility of the nations where those emissions occur, the assignment of responsibility and the determination of the relative merits of policy options for international emissions are less straightforward.
4.1 Domestic Emissions
Greenhouse gas emissions from a given country’s domestic aviation and shipping sectors are undisputedly the responsibility of the country where those emissions occur. In the United States, a recent Supreme Court decision clarified that the U.S. Environmental Protection Agency (EPA) has the authority to regulate GHG emissions under the existing federal Clean Air Act (Massachusetts v. Environmental Protection Agency, 549 U.S. 497 (2007)). Domestic regulations could take the form of emission, aircraft or engine efficiency standards, limits on the carbon intensity of fuel, or possibly the inclusion of aviation and shipping and other GHG sources in a comprehensive cap-and-trade regime. In fact, EPA has been petitioned specifically to begin regulating GHGs from aviation and marine transportation under the Clean Air Act.16 In legislation recently debated in Congress, domestic GHG cap-and-trade programs would cover all transportation fuels, including all jet and marine fuels, sold in the United States—thus, both domestic GHGs and a portion of international aviation and marine shipping GHGs would be covered under the proposed system.
Other countries have recently begun to develop policies to regulate GHG emissions from domestic aviation under their national programs. For example, New Zealand, Australia, and the European Union have already taken steps to include domestic aviation in their domestic GHG cap-and-trade programs. The European Union has acted to expand its GHG trading system to include emissions from the aviation sector beginning in 2012. The EU regulations include emissions from all flights either landing at or departing from airports within EU member countries. As a result, the EU system would include all domestic aviation emissions and the portion of
international emissions with origins or destinations in the EU, regardless of where the fuel was purchased or the nationality of the airline.17
In addition to possible regulations, government-sponsored research and development (R&D) can be an effective driver of innovation, especially when it is targeted at basic research that is beneficial to many industries (e.g., low-carbon fuels and advanced lightweight materials) or is focused on risky projects (e.g., radical changes to airframe designs and novel hull coatings for ships) that individual companies may not be willing to fund. Public R&D has been a particularly important driver of aviation innovation in the past (GAO 2008), and while this has raised trade concerns and World Trade Organization challenges at the international level, an increase in U.S. R&D funding could accelerate the rate of innovation. Current R&D programs in the United States include the FAA’s Continuous Lower Energy Emissions and Noise (CLEEN) program and NASA’s Environmentally Responsible Aviation (ERA) project. Moreover, expanded federal R&D support for the aviation industry in the United States would have both domestic and global impacts, particularly due to U.S.-based Boeing’s position as one of the world’s two dominant commercial aircraft manufacturers, along with the European Airbus. Increasing federal government funding for marine vessel R&D, if carefully targeted, could also be effective. While only a small share of global ship building actually takes place in the United States (Figure 10), R&D efforts could focus on technological innovations aimed at making ship components that are manufactured here more fuel efficient. Moreover, international collaboration and technology transfer could be a possible option to facilitate R&D across countries.
Finally, increased government spending on infrastructure could also play a role in mitigating GHG emissions. In the case of aviation, certain strategies to reduce congestion, such as airport expansion and advanced CNS/ATM systems, are beyond the direct control of airlines and are strongly dependent on government regulation and support. For this reason, the funding provided to NASA in the economic stimulus package of 2009 for the development of NextGen technologies is helpful (P.L.-111-5 2009), but more resources from both the public and private sector are needed to make this system an operational reality. Similarly, while plans for the SESAR project will continue to progress in Europe, incentives may be needed to motivate all aircraft to comply with SESAR requirements and adapt to its usage (Dray, Evans et al. 2009). Airport congestion could also be reduced by greater regulation of aircraft arrival and departure times, possibly via pricing and/or auctioning strategies (Janic 1999). Finally, in some cases marine transportation emissions could be reduced through dredging of ports and waterways to accommodate larger vessels. Improvements in cargo handling equipment and land transportation networks could also reduce delays.
4.2 International Emissions
The current structure for addressing GHG emissions from international aviation and maritime sources was established as part of the 1997 Kyoto Protocol and related decisions under the UNFCCC. In accordance
fuels used in international aviation and maritime shipping), to the extent possible, are to be included as part of Parties’ national GHG inventories, but are to be excluded from national totals and reported separately. These emissions are not subject to the limitation and reduction commitment of Annex I Parties under the Convention and the Kyoto Protocol. Unlike GHG emissions from all other sources, which were included under the national targets for developed countries established under the Protocol, Article 2.2 carved out a different approach for international emissions from aviation and marine shipping.
‘The Parties included in Annex18 I shall pursue limitation or reduction of emissions of
greenhouse gases not controlled by the Montreal Protocol from aviation and marine bunker fuels, working through the International Civil Aviation Organization and the International Maritime Organization, respectively.’
[Article 2.2 of the Kyoto Protocol to the United Nations Framework Convention on Climate Change, 1998]
ICAO19 and the IMO20 have traditionally been the international organizations responsible for the
development of policies affecting these sectors. For example, they have implemented standards for emissions of conventional pollutants and to limit noise from aircraft, and they have also set fuel quality standards (Annex 16, Volume II of the Chicago Convention and Annex VI, MARPOL respectively). Leading up to the global climate agreement reached in Kyoto, an important, unresolved methodological issue concerned how best to assign international GHG emissions from these sectors to specific countries. An agreed rule governing how to calculate international emissions in national inventories would be required in order for these emissions to be assigned to and dealt with under countries’ national GHG policies. The UNFCCC’s Subsidiary Body on Science and Technological Advice (SBSTA) set forth a number of options in a working paper it issued in 2003 (UNFCCC 2003). But in the six years since this issue was first discussed, little progress has been made on what is the appropriate methodology for assigning responsibility for international emissions to countries.21 The most promising option appears to be dividing the emissions between the countries of origin and destination for either the aircraft/ship or its passengers/cargo (Faber, Boon et al. 2007). Other options, such as assignments based on national fuel sales, the nationality of the carrier or shipper, or country of vehicle registration could cause serious market distortions and evasive behavior. For instance, national emissions could be “mitigated” by purchasing
Rest of World 19% United States 1% China 12% South Korea 35% Japan 33%
Figure 10: Orders Received for Manufacturing of New
Ships by Country During 2003 (Percent of Global
DWTS Ordered)
fuel elsewhere, changing the nationality of carriers and shippers, or registering aircraft and marine vessels in another country.
Market distortions and evasive behavior would be most severe for maritime shipping. The majority of shipping capacity is comprised of vessels flagged in countries that engage in relatively little international trade, and similarly the ownership of a large portion of the global shipping fleet does not correspond to international trade flows (Figure 11). The potential for evasion is also high in the marine sector since changing vessel flags is easy and large quantities of fuel can be bunkered onboard a ship, affording great flexibility in choosing where to flag a vessel and purchase fuel in order to minimize costs.
While dividing international transport emissions between origins and destinations provides the least opportunity for evasion and market distortions, the approach is still hindered by practical and political issues: how to split emissions from multi-stop trips, how to estimate emissions produced during a trip, and how to treat emissions from developing nations.
For the specific purposes of reporting emissions under the Framework Convention, countries have been instructed to report based on the sales of bunker fuels within their countries, regardless of where the fuel is actually consumed or by whom it is consumed. This method is not the most representative of international trade and travel, especially in the case of international marine transport where fuel can readily be bunkered (ships, for example, need not refuel at every port they visit). It is important to note that this method is used for the purposes of reporting only, as required of Annex 1 Parties, and that the emissions from international bunker fuels are not currently included in calculating or accounting with respect to a country’s target for GHG reductions.22
0% 5% 10% 15% 20% 25% International Trade Vessel Flag Vessel Owner Panama Liberia Greece Japan China