- Ginkgo, a multivariate analysis package - 355 Journal of Vegetation Science 16: 355-359, 2005
© IAVS; Opulus Press Uppsala.
Computer program review
Ginkgo, a multivariate analysis package
Bouxin, Guy
Haute Ecole Albert Jacquard, Département pédagogique, rue des Sorbiers, 33, B-5101 Erpent, Belgium; E-mail [email protected]
Abstract. The Ginkgo software is a subset of the VegAna (for Vegetation edition and Analysis) package that contains three programs named Quercus, Fagus and Yucca. Ginkgo is a multivariate analysis tool; it is oriented mainly towards ordination and classification of ecological data. Quercus is a relevé table editor; it handles community data to perform a phytosociological analysis. Fagus is a floristic citation editor; it can handle data coming from field surveys, biblio-graphic sources or collections. Yucca is a cartobiblio-graphic tool; it allows plotting distributions of taxa or syntaxa.
VegAna is produced by the Department of Vegetal Biology, University of Barcelona. The general project is directed by Xavier Font I Castell, the Ginkgo module by Francesc Oliva I Cuyàs. Programmers are Miquel De Cáceres and Richard Garcia. This review deals primarily with Ginkgo.
Keywords: Cartography; Classification; Data transformation; Ordination; Phytosociological analysis; Relevé table; VegAna.
Description
The Ginkgo software is a subset of the VegAna (for Vegetation edition and Analysis) package that contains three programs named Quercus, Fagus and Yucca. VegAna is produced by the Department of Vegetal Biology, University of Barcelona. The general project is directed by Xavier Font I Castell, the Ginkgo module by Francesc Oliva I Cuyàs. Programmers are Miquel De Cáceres and Richard Garcia. This review deals primarily with Ginkgo.
The program opens with the ‘Ginkgo Analysis sys-tem’. The main menu of the program contains the following options: Project, Other Modules, Window and Help.
Project option
The Project Option allows one to create a new project, to open an existing project, to edit the project’s options (i.e. the number of fraction digits or the type of decimal separator of the matrices) or how and where to save the projects. With Other modules, you can generate multi-variate normal clusters or simulate community patterns. The Window option leads to the Data Editor, the Analysis Manager or a Graphic Editor.
The Project option offers many possibilities such as creating a new matrix, importing or exporting matrices (Only three formats are handled : ASCII, CANOCO/ DECORANA condensed species data and CANOCO environmental data), importing relevé tables from the Quercus editor, changing matrix type or name, printing or removing data matrices from a project.
The rectangular primary matrices (Fig. 1) or out-puts of multivariate analyses are convertible: the data format and the column or label width can be changed, new rows or columns added or removed, data filtered (null rows or columns, low constancy species), the matrix cloned, transposed, merged with another, etc. Many other changes can be worked on the matrices, such as data transformation (arccosine, arcsine, expo-nential, natural logarithm, etc.), standardization of vari-ables, non-zero normalization. A variable analysis is also offered (descriptive statistics, covariation between variables, frequency histogram of the entire matrix or in clusters).
Object resemblances are computable with several similarity indices, several distance measures, Gower similarity or Goodall probabilistic similarity coeffi-cients. Many similarity measures are presented (Jaccard [Ellenberg], Sörensen [Motyka], Gleason index, Sim-ple matching coefficient, Spätz index, Kulczynski in-dex, Pearson correlation, χ2 similarity). The dissimi-larity measures are: chord distance, Hellinger distance, Bray-Curtis distance, Euclidean distance, square
356 Bouxin, G.
Euclidean distance, binary Euclidean distance, squared binary Euclidean distance, Manhattan distance, abso-lute value distance, χ2 distance, χ2 metric, Mahalonobis distance and Canberra metric.
With a classical rectangular matrix, a principal components analysis or a correspondence analysis can be directly computed, with all or with a fixed number of eigenvalues. With two matrices (an explanatory and a response matrix), a redundancy and a canonical cor-respondence analysis are then possible. A canonical population analysis is also available. Several cluster-ing techniques are adapted to rectangular matrices : a K-means technique (a non-hierarchical classification algorithm that partitions a set of n objects into k groups), a fuzzy C-Means technique (FCM) (based on fuzzy set theory, is an extension of the classic K-means using the concept of fuzzy logic), a possibilistic C-means (in which clusters can truly overlap, because a given ob-ject can have high typicality values in more than one group) and the program REBLOCK for iterative block clustering (Podani & Feoli 1991). ‘Species-area curves’, ‘Sociological space build’, ‘Create multivariate nor-mal clusters’ or ‘Community pattern simulator’ are other available techniques.
With symmetric matrices as similarity or distance matrices, some additional ordination or clustering tech-niques are possible such as principal coordinate analy-sis, non-metric multidimensional scaling or agglom-erative hierarchical clustering, depending on the simi-larity or distance index.
With the option Window of the same main menu, the windows Data Editor, Analysis Manager and Graphic Editor are opened.
Fig. 1. Example of the Data Editor window.
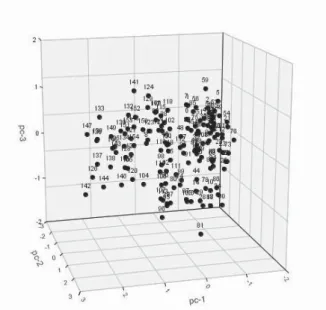
Fig. 2. Example of 3D graphic of a PCA. With many labels, the figures are often unreadable.
- Ginkgo, a multivariate analysis package - 357
Trials with community tables
Several programs were tested by entering an exist-ing community table (ASCII format) called Crupet vég.txt. It was first an Access table, first exported in Excel format and then in text format. A similarity matrix (Jaccard index) and a Euclidean distance matrix are immediately computed from the Object Resemblance option (Fig. 1).
Starting with the community table, a principal com-ponents analysis or a correspondence analysis can be directly calculated. Results appear in the right pane of the data editor; they can be exported in text format; matrices can then be changed to Excel or other formats. Several graphics, i.e. 2D or 3D (Fig. 2) – with or without labels – are drawn, exported and saved.
Starting with a Euclidean distance matrix, a princi-pal coordinates analysis (PCoA) or a non-metric multi-dimensional scaling (NMDS) is now calculable. The coordinates of variables or objects on ordination axes are saved in text format and then usable as rectangular matrices, directly for some clustering algorithms or indirectly if symmetric matrices are computed.
Many choices exist in the Cluster option (Fig. 3). As for ordinations, we directly start with a rectangular
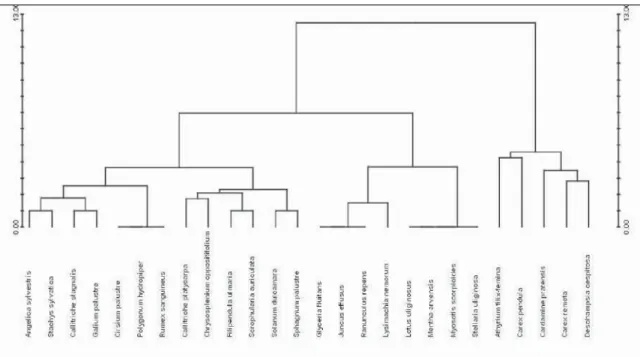
community table or compute a symmetric matrix. In the agglomerative hierarchical clustering, only the hierar-chic algorithms have to be fixed: single linkage, com-plete linkage, unweighted or weighted arithmetic aver-age clustering, unweighted or weighted centroid tering, Ward’s method, flexible method. K-means clus-tering presents several starting modes (seed randomi-zation, chosen partition, farthest points, chosen points, agglomerative hierarchical clustering) and asks for a fixed number of clusters and random runs. For Fuzzy C-means, in addition to the starting mode, the number of clusters and of random runs, a fuzzy level and the hierarchic algorithm must be chosen. Possibilistic C-means and REBLOCK are other possible options. Many complementary tasks follow such as printing or saving dendrograms (Fig. 4).
Finally, the project with rectangular or symmetric matrices and the results of ordinations or clustering are saved.
358 Bouxin, G.
Hardware and Operating System specifications
The authors do not give any particular Hardware specification. As VegAna programs are written in Java language, it is therefore necessary to have a Java Virtual Machine to execute them. To run VegAna you should have JRE 1.4.x or a later version. Unlike previous re-leases, JRE comes with Java Web Start (JWS). JWS is used to launch VegAna modules and maintain program updates.
The Ginkgo Analysis System is opened by left click-ing the Ginkgo icon in the Java Web Start Application Manager (Fig. 5).
Documentation and Help
Instructions for the use of Gingko software are avail-able on the VegAna page (http://biodiver.bio.ub.es/ vegana/index.html). The help content is available in a .pdf format and can be printed (90 pages).
The Help option links to six chapters:
- Chapter 1 : ‘Introduction’ with a program overview and general features.
- Chapter 2 : ‘Data management and operations’ with explanations on the ‘Data Editor Module’, on data trans-formation and computation of symmetric matrices. - Chapter 3 : ‘Ordination methods’ with ordination Fig. 4. Example of a dendrogram of an agglomerative clustering.
- Ginkgo, a multivariate analysis package - 359 concepts, principal components analysis, metric
multi-dimensional scaling, non-metric multimulti-dimensional scal-ing, correspondence analysis, redundancy analysis, ca-nonical correspondence analysis and related multidi-mensional scaling.
- Chapter 4 : ‘Classification methods’ with classifica-tion concepts, canonical linear discriminant analysis, quadratic discriminant, distance-based discriminant analysis, agglomerative hierarchical clustering, K-means, fuzzy C-means.
- Chapter 5 : ‘Interpretation and comparison of classifi-cations’.
- Chapter 6 : ‘Graphics’. - and 56 references.
Discussion
I consider Ginkgo to be an important and useful tool for vegetation data processing. It is free of charge, easy to download and to use. It is close to be complete. However, hierarchical divisive techniques are not pre-sented. Ginkgo is comparable to other commonly used packages such as PC-ORD (McCune & Mefford 1999) but it is more elaborated, with many options. It is interesting for beginners and easier to use than many other packages; e.g. ADE-4 from Lyon University which is more theoretical but offers many uncom-monly used techniques such as non-symmetric corre-spondence analyses or multiple factor analyses. ADE-4 presents many rather theoretical explanatory texts and publications linked to the presented techniques.
In Ginkgo and other packages, the output of classi-cal multivariate analysis (PCA, CA) contains only the coordinates of the variables or objects on the axes; there is no assistance to interpretation, such as the relative contributions of variables or objects in the explanation of axes. This is a general drawback of the current software as the level of relative contributions gives useful (indeed essential) complementary infor-mation for interpretation (see Foucart 1982).
The user of Ginkgo and similar software packages should be careful. All the techniques are easily acces-sible and can be used, whatever the nature of the community table. The results always appear in a few seconds and elegant graphs are automatically con-structed. It is often dangerous to use techniques with-out a good theoretical background and withwith-out clear objectives. What are the conceptual foundations in the use of a given multivariate analysis? I think that the handling of vegetation data is never a unique and simple operation. It must be constructed step by step, starting with a community table, generally with many species, some of which are common and others rare;
some vegetation relevés are rich and others are poor in species, each of them having a particular dispersion pattern. Is it necessary to analyse a complete or a simplified table? What is the incidence of the choice of a metric on results? To be successful, data processing should follow a rigorous and sequential process, start-ing from the data collected in the field, followed by a detailed analysis of the rows and columns of the com-munity table, by an appropriate simplification of the table, by an ordination that is adapted to the nature of the data (i.e. correspondence analysis and derived tech-niques are normally not compatible with abundance data) and finishing with a synthesis, often in the form of a clustering of transformed data (i.e. the coordinates of the relevés on the main axes of ordination). If a clear objective is not prescribed before starting a multi-variate analysis, there is a risk of misuse of the tech-niques. Some ordination methods should be used as an indirect gradient analysis, others as a direct gradient analysis. Some techniques are adapted to an analytical process, others to synthetic research. In the Ginkgo documentation there is a general lack of thought in the manner of using the programs. The automatic use of techniques, may lead to a false sense of security. This package, as many others, can be a trap for beginners who are confronted with a lot of techniques. The choice is often oriented by the current techniques found in literature.
Despite such limitations and caveats, Ginkgo from VeGana is an interesting new tool in the cohort of packages for vegetation analysis. I hope that several important techniques for community description, such as non-symmetric correspondence analysis or multiple factor analysis, will be regularly added.
References
Foucart, T. 1982. Analyse factorielle, programmation sur
micro-ordinateurs. Masson, Paris, FR.
McCune, B. & Mefford, M.J. 1999. PC-ORD. Multivariate
analysis of ecological data, version 4. MjM Software Design,
Gleneden Beach, OR, US.
Podani, J. & E. Feoli. 1991. A general strategy for the simulta-neous classification of variables and objects in ecological data tables. J. Veg. Sci. 2 : 435-444.
ADE4 2004 package and linked texts can be found at the URL address: http://pbil.univ-lyon1.fr/ADE-4/