Adoption Model of E-Commerce from SMEs Perspective in
Developing Country Evidence – Case Study for Indonesia
Agus David Ramdansyah
1, H.E.R. Taufik
1Abstract:
The number of Indonesia people using internet have increased due to advances in information technology, and the activity of electronic commerce (E-Commerce) is increasingly growing. This is a huge potential market for businesses including for SMEs. However, there are only a few Small and Medium Enterprises (SMEs) in Indonesia which have adopted E-Commerce. In fact, they are one important part of the economy in Indonesia. On the other hand, technological advances have made the competition tougher for SMEs. To understand perspective of E-Commerce from SMEs side, this study aims to find out what are the factors that support SMEs to adopt E-Commerce and the effect of the adoption to SMEs’ performance.
This research discusses the adoption of E-Commerce by Indonesia SMEs and performance improvement as the effect of the adoption. The problems in this research are elaborated into research questions, i.e. do compatibility, top management support, organizational readiness, perceived benefits and external drive have significant positive effect to E-Commerce adoption? And does the adoption have significant positive effect to company’s performance? The purpose of this research is to analyze factors that support E-Commerce adoption on Indonesia SMEs and to analyze whether the adoption improves the performance of the SMEs. Partial Least Squares Structural Equation Modeling (PLS-SEM) Techniques is applied to analyze by using SmartPLS3. This technique enables researchers to test the relation between complex variables and to get an overall view of the whole model.
Keywords: E-Commerce, Technology Acceptance Model (TAM), SMEs, PLS- SEM.
1Economics and Business Faculty Sultan Ageng Tirtayasa University, agus.david@untirta.ac.id
1. Introduction
The study was born out of the author’s concern to find answers that can explain SMEs intentions to use ICT and E-Commerce in Indonesia and if ICT developments are dynamic, it follows that E-Commerce issues would also draw on this characteristic, thus requiring more reason to establish patterns of E-Commerce development and its application.
In historical perspective, Internet has spread at a rate much faster than the previous generation of communications technology. Today Internet is not only a networking media, but also as transaction medium for consumers at global market in the world, and becomes dominant retailers in the future, Yulihasri et al. (2011). Internet affects the way people communicate with each other, obtain information, learn, culture interact, and do online shopping or E-Commerce. Indonesia as one of developing country faces the challenges in harnessing the potential of E-Commerce. However, it is not present real opportunities for business in developing countries. The need to address infrastructure bottlenecks in telecommunications, transportation, and logistics must be addressed in parallel with the governance aspects of E-Commerce, including consumer protection, transaction security, privacy of records, and intellectual property.
On the other hand, the development of technology is becoming increasingly important for businesses due to free trade area issue such as APEC in Asia Pacific in 2010, AFTA in ASEAN in 2015, and WTO in the world in 2020 will affect competitiveness and competition of businesses and bureaucratic system, including in Indonesia. Business model that will dominate in the future is electronic commerce or E-Commerce.
To take advantages of these opportunities, businesses including Small and Medium Enterprises (SMEs) should anticipate well and properly. SMEs in Indonesia should be fostered and be encouraged to take advantages of E-Commerce, this is because not only they are relatively resistant to economic recession and have competitive products in global market but also their position is very strategic with its population reach to 57, 9 million units, absorb 97, 30% of total labors, and contribute 58, 92% to Gross Domestic Product (GDP), (Ministry of cooperatives and SMEs, 2014).
A survey conducted by Suriadinata (2011) to 417 SME exporters in eight major cities in Indonesia (Medan, Lampung, Jakarta, Bandung, Yogyakarta, Surabaya, Denpasar, and Makassar) revealed that SMEs with a website as one form E- Commerce is still very few although for some SMEs that already have a website have been gaining the benefits in increasing sales turnover. Reasons of SMEs still do not have a website is probably because it is not availability of experts or
specialized staff needed to create and manage sites the web, for example in the case of maintenance and updating.
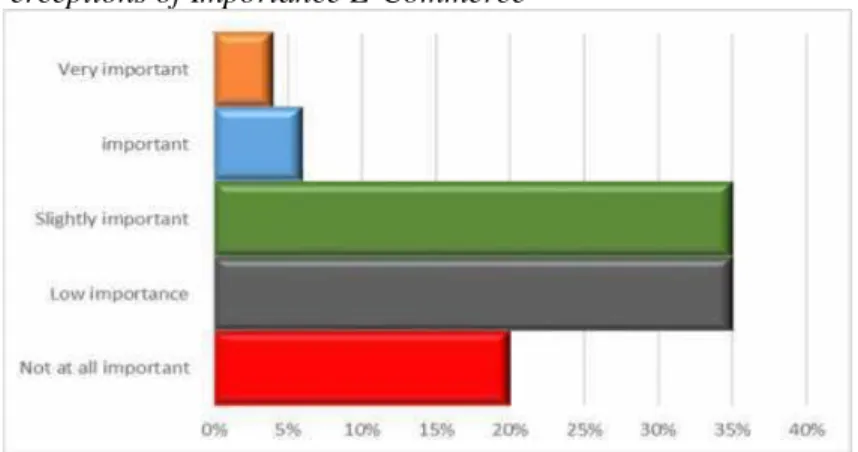
The Asia Foundation (2012) showed the low number of SMEs which already use E- Commerce. According to this survey on 227 SMEs in 12 major cities in Indonesia (Jakarta, Surabaya, Medan, Bandung, Semarang, Yogyakarta, Denpasar, Makassar, Manado, Palembang, Samarinda, and Lombok), only 28 companies (18% of companies surveyed) who have joined the site E- commerce. Even companies outside Java and Bali have little knowledge of E-Commerce sites and the benefits that can be obtained from the website of E-Commerce. This survey also showed that about 20% of 74 companies (33% of total companies surveyed is not an E-Commerce users), they say that the role of E-Commerce to their business is not important, means that the use of E-Commerce will not add value in their business, about 35% said that the use of E- Commerce will add little value in their business, and only less than 4% said that the role of E-Commerce to their business is very important, or considers that the use of E- Commerce will add a very high value in their business (Figure 1).
Figure 1. Perceptions of Importance E-Commerce
Source: The Asia Foundation (2002).
By looking at description in advance it can be implied that despite the benefits of E- Commerce is very large, adoption of it by SMEs is still low. Therefore, need a study what factors are driving SMEs to adopt E- Commerce and whether adoption of Commerce improve SMEs performance. Most research on E-Commerce is in large-scale business, while studies on SMEs related to adoption of E-Commerce is not much done especially in Indonesia. Thus, this study will discuss factors that support Indonesia SMEs to adopt E-Commerce and see the effect of the adoption to their performance.
2. Literature and Development Model 2.1 Factors affecting SME to Adopt E-Commerce
Researchers in the field of information technology has begun to use the theory of diffusion of innovation to study the problems of the use of technology (Stone, 2012; Marsh and Sharman, 2009; Gilardi, 2010; Jordana, 2011). One of t h e literatures is the theory of innovation diffusion of Rogers (1983). Rogers defines diffusion as a process where innovation is communicated through certain channels over certain time among members of a social system. Innovation defined as an idea, practice, or object that is new to the individual. This definition is often interpreted as innovation adopted by consumers. However, in the B2B market, innovation is the techniques, processes, machinery and new production inputs adopted by companies or employers to usability themselves. Diffusion of innovation theory Rogers identifies five essential attributes that are affecting levels adoption. The attributes are: relative advantage, compatibility, complexity the ability to try out, and the ability to observe. Apart complexity, all these factors have a positive relationship with the adoption of technology which in this study is defined as the term adoption of the decision to utilize an innovation in full as the best course of action (Rogers, 2003).
From SME perception, Poorangi et al. (2013), Slyke et al. (2010), Mndzebele (2013), Jumayah et. al (2013), Ndayizigamiye and McArthur (2014), Magutu et al. (2011), UNCTAD (2015), and Nickels (2015) show that the support of top management is a factor influencing technology adoption. Rahayu (2015), White et al. (2014), Khan et al. (2014), Ozlen et al. (2014) suggested that factors affecting technology adoption is the perceived benefits. External drive suggested by Bodesee (2013), Jumayah et al. (2013), Rawat (2013), Xuan (2007), Al-Shboul et al. (2014), and organizational readiness by Kinuthia and Akinnusi (2014), Yu and Dong (2013), Jumayah et al. (2013), AlGhamdi et al. (2013), Tran et al. (2013). Poorangi et al. (2013), Slyke et al. (2010), Mndzebele (2013), Jumayah et al. (2013), Ndayizigamiye and McArthur (2014), Magutu et al. (2011), UNCTAD (2015) and Nickels (2015) suggested that compatibility have positive significant relationship to the adoption of E- commerce. Alrawabdeh (2014), Alini (2014), Al Shaar et al. (2015), Chaffey (2009), Janom et al. (2014), Remy et al. (2015), Qureshi et al. (2013), Azlinna and Said (2014) suggested that the factors that influence technology adoption is top management support, readiness organizational and external drive. In terms of benefits or impacts, Basuony (2014), Zizlavsky (2014), Sawang (2011), and Popa (2014) suggested that the use of E-Commerce system increases company performance.
3. Theoretical Framework
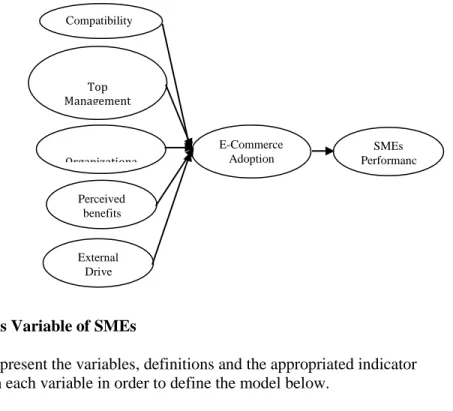
Based on existing literature and previous research framework theoretical thought that can be filed is shown in Figure 2.
Figure 2. Theoretical Framework for SMEs adoption case
3.1 Dimensions Variable of SMEs
In Table 1 we present the variables, definitions and the appropriated indicator associated with each variable in order to define the model below.
Table 1. Dimensions Variable N o V a r i a b l e Definition Indicator 1 Compatibility, adopted from; Poorangi et al. (2013), Slyke et al. (2010), Mndzebele (2013), Jumayah et al (2013), Ndayizigamiye and McArthur (2014), Magutu et al. (2011), UNCTAD (2015), and Nickels (2015), Compatibility is the degree to which an innovation is considered
accordance with the
values existing values, past experiences, and
needs of potential adopters - Accordance with business needs - Accordance with process/operations companies today - Accordance with company values - Accordance with suppliers and customers in the way doing business - Accordance with culture Top Management Support Organizationa l Readiness Perceived benefits External Drive E-Commerce Adoption SMEs Performanc e Compatibility
2 Top Management Support adopted from;
Alrawabdeh (2014), Alini (2014), Al Shaar et al. (2015), Chaffey (2009), Janom et al. (2014), Remy et al (2015), Qureshi et al. (2013), Azlinna and A. Said (2014)
Commitment from top management to support cultural change needed in management style, management of results,
changes in work
practices and the need
for support of communication and information technology - Assignment project leader - Communication support - Development a vision
and strategy for E-Commerce
3 Organizational readiness, adopted from; Kinuthia and Akinnusi (2014), Yu and Dong (2013), Jumayah et al. (2013) AlGhamdi et al. (2013), Tran et al. (2013) Organizational readiness is intended to get the
attributes of the
enterprise level
organizations that assess the company's overall
preparedness in the diffusion of innovation. - Financial resources - Technology source - Level of management understanding 4 Perceived Benefits, adopted from; Rahayu (2015), White et al (2014), Khan et al. (2014), Ozlen et al. (2014)
The perceived benefits are defined as the degree to which a
person/organization believes that the use of a particular system would enhance the performance.
- Accelerate completion of work
- Facilitate the work
- Improve work effectiveness
5 External drive,
adopted from; Brdesee (2013), Jumayah et al. (2013), Rawat (2013),
Xuan (2007),
Al-Shboul et al. (2014)
External drive includes
effects arising from
multiple sources in the competitive environment in the environment that is competitive boost, boost industry and the influence of the trading partner
- Competitive boost - Industry boost - Reliance on business
associates who have - been using E-
- Commerce
6 Adoption of E- Commerce, adopted from; Savrul et al. (2014), Hashim (2014), White et al. (2014), Khan et al. (2014),
Wachira (2014),
Rumanyika (2014)
Refer to the process of
conducting business
online, spanning both
Business-to- Business
(B2B) and Business to- Consumer (B2C) markets to reach global players, gaining market share for
competitive advantage, utilizing telecommunication networks - General marketing activities - Researching market - International penetration - B2B transaction - B2C transaction 7 Company Performance, adopted from; Basuony (2014), Zizlavsky (2014), Sawang (2011), Popa (2014) The company's performance is measurement of Company`s success in achieving the goals that have been set.
- Efficiency - Coordination - Trade expansion
4. Methodology
4.1 Sample and Procedure
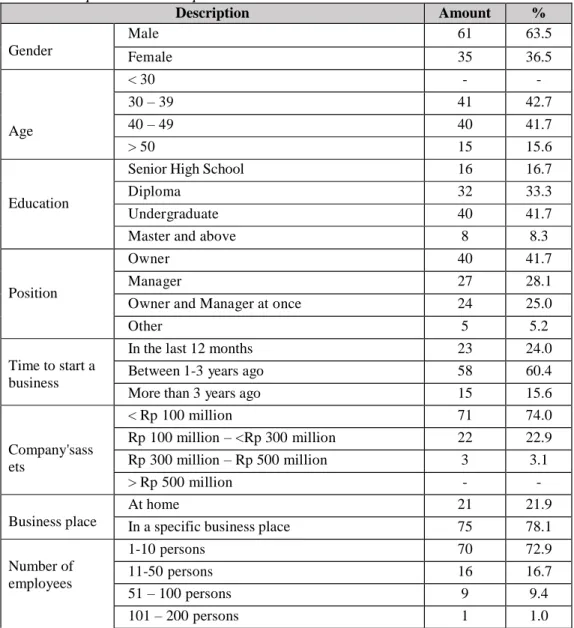
The object of research is set to Small and Medium Enterprises with managers/owners of SMEs as respondents at nine regions in Indonesia: Jakarta, Tangerang city, South Tangerang city, Cilegon city, Serang city, Serang district, Tangerang district, Lebak district and Pandeglang district. From collecting data field, obtained 96 respondents. Respondents in the study will be classified into demographic aspects that are excluded in the process of data analysis because it does not relate directly to the answer given by respondents about the research variables, but aspects the demographics can be used as additional information in describing the conclusion. Demographic characteristic of the 96 responses are summarized in Table 2.
Variables used to assess these concepts derived from previous studies. This study uses a scale from 1 to 10 where number 1 for strongly disagree and number 10 for Very Agree. The reasons for choosing this scale is that with a large range, we can see the distribution or variation of respondents. Before a list of questions or a questionnaire posed to respondents, we did a pilot study to test the reliability and validity of the list of questions with a sample of 30 respondents. The purpose of this test is to generate a list of questions that are reliable and valid so that it can be properly used for concluded hypotheses. Initially we compiled 26 questions on five variables. In this case, we find six questions contains the same values for each case/observation. These indicators are two questions from compatibility, one question from top management support, two questions from external drive and one question from adoption E-Commerce variable. To solve this problem, the six questions have been removed from the model as the guide of the SmartPLS3
software tool kit. After the six items deleted, we re-specify and run the new measurement model. Thus, we got 20 indicators from five variables examined in this study namely Compatibility, Top management support , Organizational Readiness, External drive, Perceived benefit, Adoption of E-Commerce and company performance. Table 1 summarize variable measurement, and indicator and scale used.
4.2 Overview of Respondents
In Table 2 we present the respondents descriptive statistics in terms of gender, age, education etc. before the analytical presentation of the results.
Table 2. Respondents Descriptive
Description Amount % Gender Male 61 63.5 Female 35 36.5 Age < 30 - - 30 – 39 41 42.7 40 – 49 40 41.7 > 50 15 15.6 Education
Senior High School 16 16.7
Diploma 32 33.3
Undergraduate 40 41.7
Master and above 8 8.3
Position
Owner 40 41.7
Manager 27 28.1
Owner and Manager at once 24 25.0
Other 5 5.2
Time to start a business
In the last 12 months 23 24.0
Between 1-3 years ago 58 60.4
More than 3 years ago 15 15.6
Company'sass ets < Rp 100 million 71 74.0 Rp 100 million – <Rp 300 million 22 22.9 Rp 300 million – Rp 500 million 3 3.1 > Rp 500 million - - Business place At home 21 21.9
In a specific business place 75 78.1
Number of employees 1-10 persons 70 72.9 11-50 persons 16 16.7 51 – 100 persons 9 9.4 101 – 200 persons 1 1.0
> 200 persons - - Last year revenue < Rp 100 million 69 71.9 Rp 100 million– <Rp 500 million 21 21.9 Rp 500 million– <Rp 1 billion 6 6.3 > Rp 1 billion - -
Last year loss profit before tax Profit < 5% 34 35.4 Profit ≥ 5% 35 36.5 Equal 14 14.6 Loss <5% 13 13.5 Loss ≥ 5% - - Initiate E-Commerce adoption in business
In the last 12 months 37 38.5
Between 1-3 years ago 38 39.6
More than 3 years ago 21 21.9
Source: Primary data are processed.
Almost two-third of the sample are males. More than four-fifth respondents are in the age of 30-39 and 40-49. All of them are educated at least in the high-school level. 41.7% respondents are undergraduates. Almost a half of the respondents are the owners of their business. Most of them (60.4%) stated that they have run business between 1-3 years ago. 74% of them have company`s assets less than Rp 100 million, 72.9% have 1-10 employees, 71.9% their last year revenue is less than Rp 100 million. Based on definition of the Law of the Republic of Indonesia, No. 20, 2008, 96.9% are categorized as small business because their company`s assets are less than Rp. 500 Million and only 3.1% as Medium Enterprises. 39.6% of them has adopted E-Commerce between 1-3 years ago and it seems that some of them have already enjoy last year Profit up to 5%.
4.3 Data analysis
Partial Least Squares Structural Equation Modeling (PLS-SEM) is applied by using software SmartPLS3 to examine research model of Factors that support Indonesia SMEs to adopt E-Commerce and the effect of the adoption to their performance. The selection of this method is based on the suitability of case.
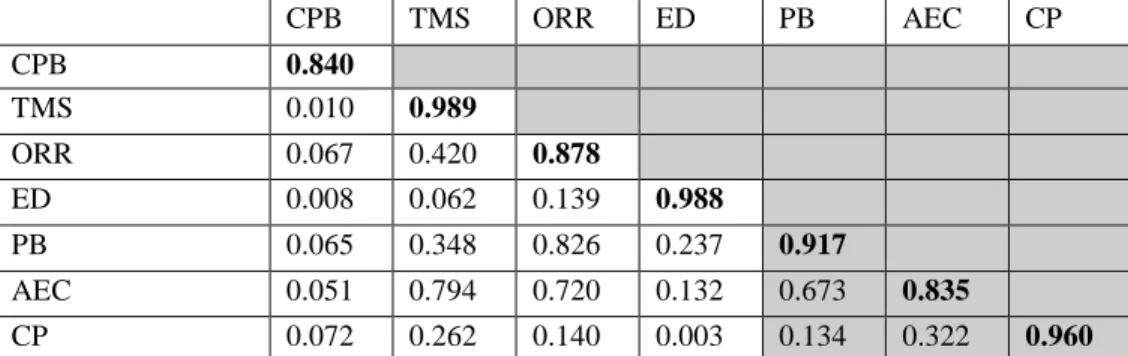
4.4 Result of Discriminant validity test
To check Discriminant Validity, Fornell and Larcker (1981) suggest that the “square root” of AVE of each latent variable should be greater than the correlations value among the variables. Table 4.17 shows the result of calculation. Those number written in bold are larger than the correlation values in the row of all variables. The result indicates that discriminant validity is well established.
Table 3. Discriminant validity- Fornell-Larcker Criterion
Below is the result of PLS path modeling estimation figure Figure 1. Estimates by SmartPLS 3
4.5 Explanation of target endogenous variable variance
CPB TMS ORR ED PB AEC CP CPB 0.840 TMS 0.010 0.989 ORR 0.067 0.420 0.878 ED 0.008 0.062 0.139 0.988 PB 0.065 0.348 0.826 0.237 0.917 AEC 0.051 0.794 0.720 0.132 0.673 0.835 CP 0.072 0.262 0.140 0.003 0.134 0.322 0.960
The coefficient of determination, R2, is 0.104 for the Company Performance endogenous variable. This means that variables Adoption E-Commerce weakly explain 10.4% of the variance in Company Performance. In marketing research, R2 of 0.75 is substantial, 0.50 is moderate, and 0.25 is weak (Ken and Wong, 2013). Combability, top management support, organizational readiness, perceived benefits, and external drive together explain 83.7 % of the variance of Adoption E-Commerce.
4.6 Result of Total effect
Table 4 shows the total effect of the model. Direct effect marked by bold black while indirect effect shown in the bold grey.
Table 4. Total effect
AEC CP AEC 1.000 0.322 CP 0.000 1.000 CPB 0.079 0.026 ED 0.002 0.001 ORR 0.271 0.087 PB 0.249 0.080 TMS 0.593 0.191
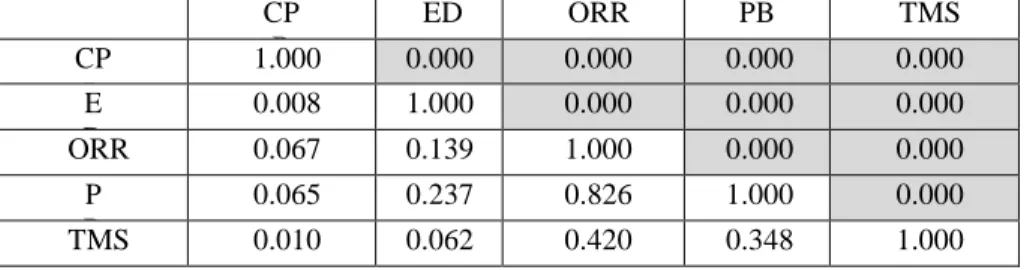
4.7 Correlation matrix for independent variables
The Correlation Matrix in Table 5 provides some insights into which the independent variables are related to each other. The highest correlation is between PB and ORR (0.826) and TMS and ORR (0.420). Both correlations are high and positive, as the PB or TMS increase, so does the ORR which is consistent with other studies conducted by Shaharudin et al. (2012) and Afaneh et al. (2015). TMS is also positively correlated with PB at 0.348 as Poorangi et al. (2013) found.
Table 5. Correlation matrix for independent variables CP B ED ORR PB TMS CP B 1.000 0.000 0.000 0.000 0.000 E D 0.008 1.000 0.000 0.000 0.000 ORR 0.067 0.139 1.000 0.000 0.000 P B 0.065 0.237 0.826 1.000 0.000 TMS 0.010 0.062 0.420 0.348 1.000
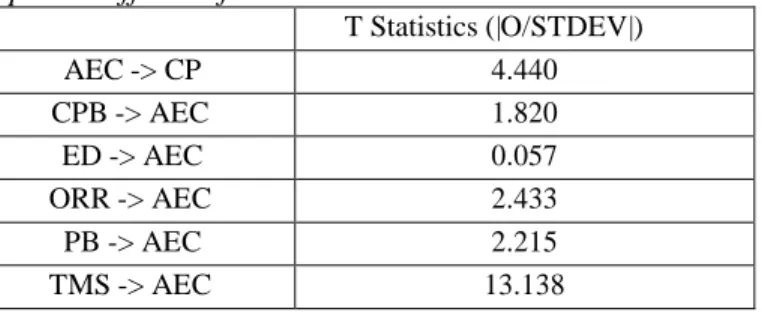
4.8 Checking Structural Path Significance in Bootstrapping (inner model and outer model)
The inner model suggests that AEC has effect on CP (4.440). TMS has the strongest effect on AEC (13.138), followed by ORR (2.433), PB (2.215), CPB (1.820) and ED (0.057).
Table 6. T-Statistic of path coefficient for the inner model
T Statistics (|O/STDEV|) AEC -> CP 4.440 CPB -> AEC 1.820 ED -> AEC 0.057 ORR -> AEC 2.433 PB -> AEC 2.215 TMS -> AEC 13.138 5. Discussion
Figure 1 summarizes the analysis of this study. It shows the PLS path coefficients model of the proposed research model in all 20 measures. The path coefficients are shown alone the arrow lines between the constructs. The R-squared value of Adoption E-Commerce (AEC) is 0.837 and for Company`s Performance (CP) is 0.104. This means that AEC explains only 10.4% of the variance in CP. In marketing research, R2 of 0.75 is substantial, 0.50 is moderate, and 0.25 is weak, (Ken and Wong, 2013).
According to the path coefficients, Compatibility (CPB), Top Management Support (TMS), Organization Readiness (ORR), External Drive (ED) and Perceived Benefit (PB) together explain 83.7 % of the variance of AEC. The inner model suggests that TMS has the strongest positive effect on AEC (0.593), followed by ORR (0.271), PB (0.249), CPB (0.079) and ED (0.002).
In SmartPLS, the bootstrap procedure can be used to test the significance of a structural path using T-Statistic. The table 4.18 shows the relationship between Adoption E- Commerce (AEC) and Company Performance (CP) shown by T-Statistic value of 4.440, Compatibility (CPB) and Adoption E-Commerce (AEC) is 1.820, External Drive (ED) and Adoption E-Commerce (AEC) is 0.057, Organizational Readiness (ORR) and Adoption E-Commerce (AEC) is 2.433, Perceived Benefits (PB) and Adoption E- Commerce (AEC) is 2.215 and relationship between Top Management Support and Adoption E-Commerce (AEC) is 13.138. According to Ken and Wong (2013), significance of standardized path coefficient is larger than 1.96.
Thus, the hypothesized path relationship between AEC and CP, ORR and AEC, PB and AEC, TMS and AEC are statistically significant. However, the hypothesized path relationship between CPB and AEC and ED and AEC are not statistically significant. This is because its standardized path coefficient of them are lower than
1.96. In this case we can state that AEC is a predictor of CP, ORR, PB and TMS are predictors of AEC but CPB and ED do not predict AEC directly.
Although the study was conducted in Indonesia, the data are useful for comparing with the studies of other countries to validate the SMEs acceptance model. Furthermore, this study does not reveal additional factors that may influence SMEs in adopting technology.
6. Conclusions, Limitations and Implications 6.1 Conclusion
The results suggest that top management support, organizational readiness, perceived benefits have a significant positive effect on the adoption of E- commerce. It can be stated that the higher these three variables, adoption E-Commerce will run better. On the other hands, compatibility and external drive have a weak positive effect on the adoption of E-Commerce which show that there are still many obstacles for SMEs in the adoption of E-Commerce as shown in SWOT analysis.
Meanwhile, SME performance positively and significantly affected by the adoption of E- commerce. The construct of the adoption of E-Commerce is described by the dimension (1) marketing activities in general, (2) achieve penetration internationally, (3) conduct B2B transactions and (4) the transaction B2C while construct the company's performance is explained by the dimension (1) efficiency, (2) coordination and (3) expansion of trade.
6.2 Limitations
There are several limitations in this study as follows:
1. Response rate is relatively low in all studies. Low response rate affects the feasibility of statistical models. This limitation will narrow the generalization of research results. Future studies can extend this scope to include consumers from other cities in Indonesia.
2. As E-Commerce is relatively new in Indonesia, this study has the intention of measuring E-Commerce adoption. Future studies can consider measuring the diffusion of E-Commerce across time, and investigate if the adoption factors change at various stages of SMEs diffusion of E-Commerce. There is a possibility that additional adoption factors have not been included in this model and these can be included in future research models.
6.3 Implications
This study offers several implications as follows:
1. This study focuses in Indonesia as one of developing countries where internet and infrastructure are quite different in advanced and the E-Commerce adoption keep growing in Indonesia. Unlike developed countries, E-Commerce industries in Indonesia is in a different situation especially in infrastructure. The
result enables telecommunication and online companies to develop strategies that are appropriate to Indonesia consumers.
2. The implications relating to compatibility are as follows:
a. SMEs need to pay attention in doing business expansion where this effort related to venture capital. Significant business developments will require substantial capital to the inability of SMEs in the running business activity will bear the financial difficulties and even bankruptcy. Therefore, necessary to evaluate the business needs properly.
b. SMEs also consider the capacities and capabilities in production. Self-imposed in meeting the market demand will have an impact on the quality of the results is not the maximum, working climate is not conducive and buyers lost confidence. For that SMEs need determine the ability comprehensively. In addressing the problem of capacity SME can perform intensification and extension efforts.
c. SMEs need to pay attention to the values and corporate culture since both as a control and as a normative rule. Attention to these two aspects will (1) provide direction for the development of business, by digging / evaluating the vision, mission and organizational structure, (2) increase productivity and creativity, (3) will improve the quality of goods and services, and (4) will motivate employees to achieve the highest achievement to assure responsibility and development of the company becomes a shared responsibility.
3. Implications relating to top management support is that management need to motivate and educate the employees to work together, exchange ideas, and discuss both formal and informal. High motivation of owners and employees to interact will enhance the relationship and will create a conducive working environment and minimizing labor conflict.
4. The implications relating to organizational readiness is as follows:
a. Companies need to make b udget on information technology renewal periodically. The available budget will allow employees to renew or improve their knowledge and skills in information technology. The budget also can be used for maintaining information technology system and paying trainers or experts.
b. Employees need to be introduced to E-Commerce through applicable training.
5. Implications related to the perceived benefits are as following:
a. Management needs to improve cooperation among division in gathering information to formulate planning. It will give unities a more structured planning for each division and enable for them to interact effectively.
b. Management need to more participate actively in applying and renewing technology in business activities.
6. Meanwhile, the implications relating to the external drive is as follows:
a. SMEs need to conduct monitoring of industrial environments. Monitoring is intended to provide information regarding opportunities, and threats in industry that was involved. In monitoring competitors and industry
environment, SMEs can obtain information about competitors and industry environment from the internet or exhibitions either national or international scale.
b. SMEs need to monitor competitor activities and strategies. It can provide information about development and business strategies of competitors. Weak monitoring can lead to left behind.
c. SMEs need to create a harmonious working relationship with business partners. Good relationship will make it easy for SMEs to obtain raw materials and do marketing. Therefore, SMEs need to cooperate with business partners based on mutual relations.
Finally, we would like to emphasize that rapid growth of the market share of E-Commerce in Indonesia is beyond a reasonable doubt. With the number of Internet users reached 88.1 million people or about 35% of the total population in 2014, Indonesia E-Commerce market is a very tempting gold mine for some people who can see the potential in the future. This growth is supported by the E-Commerce transaction value also continues to increase.
References:
Alexandru, E.P. 2014. The Financial factors that Influence the Profitability of SMEs, International Journal of Academic Research in Economics and Management Sciences, 3(4).
Al-Shboul, M., Rababah, O., Al-Shboul, M., Ghnemat, R. and Al-Saqqa, S. 2014. Challenges and Factors Affecting the Implementation of E-Government in Jordan. Journal of Software Engineering and Applications, 7, 1111-1127.
Chun-Sheng, Yu. and Xue-Bing, D. 2013. A Conceptual Framework for E-Commerce Innovation in Chinese SMES, Journal of International Technology and Information Management, 22(1).
Craig, Van S., Hao, L., France, B. and Varadharajan, S. 2010. The Influence of Culture on Consumer-Oriented Electronic Commerce Adoption, Journal of Electronic Commerce Research, 11(1).
Dave, C. 2009. E-business and E-Commerce management, Strategy, implementation and practice. Fourth Edition, Prentice Hall.
Eshaq, M., Al- Shaar, Shadi Ahmed Khattab, Raed Naser Alkaied and Abdelkareem, Q.M. 2015. The Effect of Top Management Support on Innovation: The Mediating Role of Synergy between Organizational Structure and Information Technology. International Review of Management and Business Research, 4(2).
Gareth, R.T. White, A.A. and Eoin, P. 2014. Challenges to the Adoption of E- commerce Technology for Supply Chain Management in a Developing Economy: A Focus on Nigerian SMEs. E-Commerce Platform, DOI: 10.1007/978-3-319-06121-4_2, _ Springer International Publishing Switzerland.
Hani, S.B. 2013. Exploring Factors Impacting E-Commerce Adoption in Tourism Industry in Saudi Arabia: A Thesis of School of Business Information Technology and Logistics, RMIT University Melbourne, Australia.
Janom, N., Zakaria, M.S., Arshad, N.H., Salleh, S.S. and Aris, S.R.S. 2014.
Multidimensional Business to Business E-Commerce Maturity Application: Assessment on Its Practicality. I Business, 6, 71-81.
Jordana, J. 2011. The Global Diffusion of Regulatory Agencies: Channels of Transfer and Stages of Diffusion. Comparative Political Studies, 44(10), 1343-1369.
Jumayah Abdulaziz Mohammed, Mahmoud Khalid Almsafir and Ahmad Salih Mheidi Alnaser, 2013. The Factors That Affects E-Commerce Adoption in Small and Medium Enterprise: A Review. Australian Journal of Basic and Applied Sciences, 7(10), 406-412.
Kinuthia, K.N. and Akinnusi, M.D. 2014. The magnitude of barriers facing e-commerce businesses in Kenya. Journal of Internet and Information system, 4(1), 12-27. Khan, S.A., Liang, Y. and Shahzad, S. 2014. Adoption of Electronic Supply Chain
Management and E-Commerce by Small and Medium Enterprises and Their Performance: A Survey of SMEs in Pakistan. American Journal of Industrial and Business Management, 4, 433-441.
Marsh, D., Sharman, J.C. 2009. Policy Diffusion and Policy Transfer. Policy Studies 30(3), 269–288.
Mohamed, A.K., Basuony, B. 2014. The Balanced Scorecard in Large Firms and SMEs: A Critique of the Nature, Value and Application. Accounting and Finance Research, 3(2).
Mohsen, A. 2014. Identifying application barriers of electronic commerce regarding agricultural products in Iran using the Delphi method. WALIA, 30(S1), 289-295.
Muhammed Kursad Ozlen, Ensar, M. and Kumbara, E. 2014. Perceived Benefits of E- Commerce among Manufacturing and Merchandising Companies. International Journal of Academic Research in Economics and Management Sciences, 3(2). Ndayizigamiye, P. and McArthur, B. 2014. Determinants of E-Commerce Adoption
amongst SMMEs in Durban, South Africa. Mediterranean Journal of Social Sciences, 5(25).
Nickels, W.D., Obyung, K. and Adnan, O. 2015. The effect of organizational culture on E-Commerce adoption. Proceeding Southwest Decision Sciences Institute
conference.
Nomsa, M. 2013. The Effects of Relative Advantage, Compatibility and Complexity in the Adoption of EC in the Hotel Industry, International Journal of Computer and Communication Engineering, 2(4).
Noor, A., Binti, A. and Mohamed Ahmed A. Said, 2014. The Impact of Top Management Support and Technology Turbulence on E-Commerce Usage on Hospitality Industry: A Case of Libyan Hotels. International Journal of Scientific and Engineering Research, 5(9).
Peterson, O.M., Mwangi, M., Nyaoga, B.R., Ondimu, M.G., Kagu, M., Mutai, K., Kilonzo, H. and Nthenya, P. 2011. E-Commerce Products and Services in the Banking Industry: The Adoption and Usage in Commercial Banks in Kenya. IBIMA, Publishing Journal of Electronic Banking Systems.
Poorangi, M.M., Edward, W.S., Khin, S.N. and Arash, K. 2013. E- commerce adoption in Malaysian Small and Medium Enterprises Practitioner Firms: A revisit on Rogers’ model. Annals of the Brazilian Academy of Sciences, 85(4).
Qamar, A.Q., Bahadar, S., Naseem, U., Ghulam, M.K., Allah, N., Amanullah, K.M., Kamran, A.C. and Najam, A.Q. 2013. The impact of top management support and e-health policies on the success of e-health practices in developing countries, Scholarly Journal of Medicine, 3(3), 27-30.
Quangdung, T., Dechun, H. and Changzheng, Z. 2013. An Assessment Method of the Integrated E Commerce Readiness for Construction Organizations in Developing Countries. International Journal of E-Adoption, 5(1), 37-51.
Rahayu, R. and Day, J. 2015. Determinant Factors of E-Commerce Adoption by SMEs in Developing Country: Evidence from Indonesia, World Conference on Technology, Innovation and Entrepreneurship, Procedia - Social and Behavioral Sciences, 195, 142-150.
Rawat, K.P. 2013. Significant Success Factors of E-Commerce Exterior Factors Proceeding to Situation of Corporate Sectors, International Journal of Advanced Research in Computer Science and Software Engineering, 3(7).
Rayed Al-Ghamdi, Nguyen, A. and Jones, V. 2013. A Study of Influential Factors in the Adoption and Diffusion of B2C E-Commerce. (IJACSA) International Journal of Advanced Computer Science and Applications,4(2).
Remy, N., Catena, M. and Durand-Servoingt, B. 2015. Apparel, Fashion and Luxury Group, Digital inside: Get wired for the ultimate luxury experience. McKinsey and company.
Rogers, E.M. 1983. Diffusion of innovations (3rd ed.). New York, Free Press of Glencoe. Stone, D. 2012. Transfer and Translation of Policy. Policy Studies, 33(4), 1-17.
Sukanlaya, S. 2011. Key Performance Indicators for Innovation Implementation: Perception vs. Actual Usage. Asia Pacific Management Review, 16(1), 23-29.
United Nations Conference on Trade and Development (UNCTAD) 2015. Cyberlaws and regulations for enhancing E-Commerce: Case studies and lessons learned, Trade and Development Board Investment, Enterprise and Development Commission Expert Meeting on Cyberlaws and Regulations for Enhancing E- commerce, Including Case Studies and Lessons Learned Geneva.
Wasfi, A. 2014. Environmental Factors Affecting Mobile Commerce Adoption- An Exploratory Study on the Telecommunication Firms in Jordan. International Journal of Business and Social Science, 5(8).
Weibing, X. 2007. Factors affecting the achievement of success in retailing in China’s retail industry: A case study of the Shanghai Brilliance Group. Southern Cross
University.
Yadi, S.A., Suriadinata, 2 011. Research on Utilization of Information and Communication Technology by UKM Exporters in Indonesia.
Yulihasri, Md. Aminul, I., Ku, A., Ku, D. 2011. Factors that Influence Customers’ Buying Intention on Shopping Online. International Journal of Marketing Studies, 3(1), 128. Zizlavsky, Z. 2 0 14 . The Balanced Scorecard: Innovative Performance Measurement and
Management Control System. Journal of Technology Management and Innovation, 9(3).