Dissertations UMSL Graduate Works
7-11-2018
Implementing a CAPS Simulation to Increase
Nursing Education Practice Students’
Self-awareness of Attitudes and Beliefs about Poverty
Melissa Ehmke
University of Missouri-St. Louis, [email protected]
Follow this and additional works at:https://irl.umsl.edu/dissertation Part of thePublic Health and Community Nursing Commons
This Dissertation is brought to you for free and open access by the UMSL Graduate Works at IRL @ UMSL. It has been accepted for inclusion in Dissertations by an authorized administrator of IRL @ UMSL. For more information, please [email protected].
Recommended Citation
Ehmke, Melissa, "Implementing a CAPS Simulation to Increase Nursing Education Practice Students’ Self-awareness of Attitudes and Beliefs about Poverty" (2018).Dissertations. 759.
Implementing a CAPS Simulation to Increase Nursing Education Practice Students’ Self-awareness of Attitudes and Beliefs about Poverty
Melissa Ehmke, MSN, RN, CLC University of Missouri-St. Louis
Implementing a Simulation to Increase Nursing Education Practice Students’ Self-awareness of Attitudes and Beliefs about Poverty
Doctorate of Nursing Practice Project Presented to the Faculty of Graduate Studies
University of Missouri – St. Louis In Partial Fulfillment of the Requirements For the Degree of Doctor of Nursing Practice
by
Melissa Ehmke, MSN, RN, CLC
DNP Committee Chair – Nancy Magnuson, DSN, CS, FNP-BC DNP Committee Member – Ericka Sanner-Stiehr, PhD, RN DNP Committee Member – Sheila Grigsby, PhD, RN, MPH, APHN-BC
DNP Committee Member – Susie Fliesher, DNP, CPNP, RN August 2018
Abstract
Problem. The purpose of this project is to determine if college students who are currently in nursing school, will benefit from the addition of a poverty simulation to positively influence their self-awareness and individual-level beliefs and attitudes towards poverty, therefore being able to serve those in poverty fully and guide them to appropriate resources.
Methods. Bachelor of Science in Nursing (BSN) and Doctoral Nursing Practice (DNP) students participated in a three-hour Community Action Poverty Simulation (CAPS). A twenty-one item Attitude Toward Poverty Scale short form (ATPS) survey was completed pre and
post-simulation participation.
Results. Significant improvements resulted in three of the twenty-one ATPS short form items with the Bachelor of Science in Nursing group, and six with the Doctoral Practice Nursing
students respectively. Positive improvements occurred in eighteen of the twenty-one items within all three domains with the BSN/DNP cohorts combined. Significant BSN changes occurred in the stigma domain, and DNP changes happened in the stigma and personal deficiency domain. The structural perspective domain did not have any significant positive improvements.
Combined results included 58% becoming more aware of the beliefs and attitudes, 67%
increased sensitivity to poverty, and 66% improvement in their ability to make more appropriate referrals to community resources.
Implications for Practice. The CAPS experience positively and significantly impacted the attitudes of the BSN and DNP students through self-reflection towards poverty. The current undergraduate and graduate curriculum should implement CAPS to positively influence the beliefs and attitudes of nursing students towards poverty, therefore being able to adequately serve those in need and guide them to appropriate resources for this social determinant of health.
Social determinants of health or disease have attributions of large forces that can include racism, gender, inequality, poverty, and violence (Divisions of Family Practice, 2015). Poverty is one of the major social determinants of health that our country faces, with 40.6 million people currently living below the poverty line (Semega et al., 2017).
Poverty is a state of being poor or lacking something and contains two terms of absolute poverty thresholds and relative poverty thresholds (Merriam-Webster, 2016). An absolute poverty threshold is fixed at a point in time, updated solely for price changes, and described as money income; whereas relative thresholds are developed to the actual expenditures (or income) of the population (Census Bureau, 2015, United States Census Bureau, 2016).
The poverty threshold is the primary measurement which is completed by the United States Census Bureau (2016). This analysis includes the size of the family and number of children, for example, two adults and three children would be at the poverty level if they fell below $28,286 with their annual combined income, as per the previous definition (United States Census Bureau, 2016).
There are five essential elements of poverty that include education, housing and energy, food, family and economic security, and health (Missouri Association for Community Action [MACA], 2016). Lack of education can lead to low-paying, unskilled service jobs without financial security and substandard housing can contribute significantly to health issues (MACA, 2016). Food insecurity, which is the inability for individuals to access enough food for an active and healthy lifestyle, is the 12th highest percentage in Missouri with a 15.2% rate (MACA, 2016). Temporary assistance is only received by 77,551 adults and children, out of the 875,000 that equal to or below the federal poverty line and 583,000 Missourians lack health insurance (MACA, 2016). Missouri jobs are considered low wage with 28.3% holding those positions
(MACA, 2016). Those individuals in the lowest income group can expect to live 6.5 years shorter than those in the highest income group (MACA, 2016).
The United States poverty rate was 12.7% in 2016, down from 13.5% in 2015, but millions of people are still living in poverty (Semega, Fontenot, & Kollar, 2017). The 2015 poverty rate in the city of St. Louis is 28.8%, the St. Louis county rate is 9.6%, while the statewide average is 14.8% (MACA, 2016). There are 875,704 Missourians at 100% or below the Federal Poverty Level, with 277,687 being children (MACA, 2016). Of those individuals that are living in poverty, 2.7% have lived in that condition for at least 48 months, while 34.5% of the population between 2009 to 2012 have had at least one occurrence of poverty lasting at least two months (Semega, Fontenot, & Kollar, 2017).
The Urban African Americans population was found to be the most affected by poverty in St. Louis and compose 23.3% of St. Louis County, and 47.8% of the City (Washington University in St. Louis, 2015). When we measure the percentage of people by the ratio of income/resources to the poverty threshold, the official national poverty amount is 4.7% Caucasian, non-Hispanic and 12.2% African American (Washington University in St. Louis, 2015). It is significant that 40% of St Louis City/County residents are below the poverty level, with 31% being African American's, and a staggering 46% of children in the city/county are African American children that are affected by poverty (Washington University in St. Louis, 2015).
Poverty is a social and economic risk factor, which is strongly correlated to health outcomes like disability, disease, and death; therefore, addressing social and economic factors is the ideal way of tackling differences in health outcomes (Washington University in St. Louis, 2015). Poverty can be a significant social determinant of health when a person lacks human
needs such as clean water, health care, nutrition, shelter, and clothing and are unable to afford them (Centers for Disease Control and Prevention [CDC], 2014).
As poverty moves to the forefront as a significant social determinant of health, the literature has shown that it has been positive for Bachelors of Science in Nursing (BSN) students to be self-aware of their own beliefs and attitudes towards those who experience poverty. There is a firm belief that all nursing students could benefit from being aware of their attitudes towards poverty, as it is a devastating social element affecting our communities. Human service
professionals benefit from being sensitized to social justice issues, as they are the ones that empower the under-served and under-represented populations (Yun & Weaver, 2010) Their attitudes can dictate the policies and practice that empower or harm those in poverty conditions.
Nursing students can consist of undergraduate and graduate levels. Graduate nursing students are currently practicing Registered Nurses or Advanced Practice Registered Nurse's with experience who are seeing the public routinely, yet many times are unaware of how to assist with the essential resources needed to be healthy while living in poverty at that time in their life. These nurses are in a unique position to be able to assist those that are currently in poverty and provide them with the many resources that will support them, but they have to reflect and be self-aware of their own beliefs and attitudes first. The purpose of this project is to determine if college students who are currently in nursing school, will benefit from the addition of a poverty simulation to positively influence their self-awareness and individual-level beliefs and attitudes towards poverty, therefore being able to serve those in poverty fully and guide them to
appropriate resources.
Review of the literature Review process
A thorough literature review was conducted by searching PubMed, Medline, Scopus, CINAHL, and EBSCO databases. The primary keywords used were poverty and simulation limited to the previous ten years, which yielded about 50 articles. This refined list generated six articles by adding the phrase community action poverty simulation (CAPS). The attitude toward poverty scale (ATPS) was also traced back to uses, revealing one more article that was not previously located (Yun & Weaver, 2010). Four additional references were obtained after combing through the reference lists from the prior obtained seven sources.
Analysis
Eleven articles total were identified that either utilized the CAPS intervention or used the attitude toward poverty scale (Missouri Community Action Network [MCAN], 2016; Yun & Weaver, 2010). Reid & Evanson's (2016) article was noted to compare poverty simulation tools of different methodologies, including CAPS, paper bag game, negotiating on poverty,
development monopoly, Second Life Sim, Third world farmer, and SPENT. One poverty
simulation tool is CAPS, which encourages participants to play the roles of real-life scenarios, in which they utilize props and have time scenarios (Reid & Evanson, 2016). The participant's goal is to provide food, shelter, and other essential needs while interacting with community members that offer resources (MCAN, 2016). The paper bag game has participants work as families to earn money and buy essentials, thus making paper bags in developing countries while
negotiating on poverty has the participants experience particular difficulties in social ranking while assessing multiple dimensions of poverty (Reid & Evanson, 2016). Development
Monopoly modifies the rules of traditional Monopoly while reflecting the inequalities of social stratification in developing countries. Second Life Sim, Third world farmer, and SPENT are all online poverty simulation tools that use avatars in other nations to experience factors that directly
correlate to poverty conditions (Reid & Evanson, 2016). The only intervention associated with multiple studies evaluating its' use for evidence-based practice in the literature is CAPS.
Nine of the ten articles remaining utilized the CAPS intervention, but Strasser, Smith, Denney, Jackson, & Buckmaster (2013) did not. Strasser, Smith, Denney, Jackson, &
Buckmaster (2013) employed two days of poverty simulation training for their public health students and developed their scale for evaluation. Statistically significant findings occurred in empathy, understanding, and increased knowledge of the barriers that those in poverty face. This study was also the only one that used graduate students with their interventions, thus identifying a group as a gap in the literature for the focus going forward.
Specific intervention
Six of the articles identified with undergraduate students, but not nursing. These groups included two from pharmacy, with one being respectively from family resource management, general education class, health and human services, and a sociology, gerontology, and
psychology mix (Aspden, Sheridan, & Harrison, 2016; Clarke, Sedlacek, & Watson, 2016; Nickols & Nielsen, 2011; Steck, Engler, Ligon, Druen, & Cosgrove, 2011; Todd, De Guzman, & Zhang, 2011; and Vandsburger, Duncan-Daston, Akerson, & Dillon, 2010). All of these articles used the CAPS intervention, and two used the attitude toward poverty scale, while three used their scales and one used a reflection paper for evaluative purposes. Aspden et al. (2016) and Clarke et al.'s (2016) results showed changes in the structural attitude portion of the attitude toward poverty scale, while and Nickols & Nielsen (2011), Steck et al. (2011), Todd et al. (2011), and Vandsburger et al. (2010) demonstrated greater awareness and empathy of poverty for the students. Weaknesses included small sample sizes and decreased diversity in many of the studies. Overall, the students enjoyed the poverty simulation experience.
Three articles were identified to be consistent with their use of CAPS, the usage of the attitude toward poverty scale, and were also completed with nursing students from universities (Noone et al., 2012; Patterson & Hulton, 2012; and Yang et al., 2014). Noone et al. (2012) and Yang et al. (2014) conducted studies, resulting in a deeper understanding of and changed
attitudes toward poverty, but were not clear on the scale results. Patterson & Hulton (2012) were evident on reporting the resulting definite stigma and structural scale changes but consisted of a small sample size.
Community action poverty simulation (CAPS)
Community action poverty simulation (CAPS) has shown significant positive participant changes after being implemented with nursing students (Noone, Sideras, Gubrud-Howe, Voss, & Mathews, 2012; Patterson & Hulton, 2012; and Yang, Woomer, Agbemenu, & Williams, 2014). CAPS challenges the participant to view poverty differently and experience a month in the role of someone who is in poverty (Missouri Community Action Network [(MCAN)], 2016). The role they fill may be a single parent with insufficient resources, or an extended family caring for ill relatives who must decide between utilities and medications, or children that are being cared for by an older sibling who is profoundly affected by the social determinant of poverty
(Appendix A). They have to survive on a small amount of income while maintaining a job, daycare, food, insurance, and so many more other costs. Could you "walk a month in the shoes of someone who is facing poverty" (MCAN, 2016, p. 1)?
In summary, CAPS has shown positive changes in the students understanding of poverty and increased empathy towards those living in poverty. The attitude toward poverty scale has been shown to be valid and useful for evaluating these changes, and the gap of a lack of literature in the graduate student population has been identified (Yun & Weaver, 2010).
Educational methodology
Promotional learning and self-reflection of one's values and internal growth can be achieved through the use of CAPS simulation as an instructional methodology. Simulation is a well-established evidence-based mode of educational delivery that is a part of the healthcare sciences curriculum with positive effects (Harder, 2010; Jeffries, Linde, & Woolf, 2003; Larew, Lessans, Spunt, Foster, & Covington, 2006). Simulation has also proven to be a valid teaching and learning tool that has shown changes in an improvement of knowledge, skills, and critical thinking. It is also noted to improve confidence when working with patients (Bambini,
Washburn, & Perkins, 2009; Brown & Chronister, 2009; Gantt & Webb-Corbett, 2010;
Shepherd, McCunnis, Brown, & Hair, 2010). Role-playing simulation, in particular, has proven to be useful when learning about poverty (Patterson & Hulton, 2012; Vandsburger, Duncan-Daston, Akerson, & Dillon, 2010). Debriefing is one added component that should always be included after a simulation, which has demonstrated the opportunity for learners to reflect on the knowledge, behaviors, and attitudes that are associated with the experience (Jeffries, 2005; Jeffries & Rizzolo, 2006). Decreased learning potential has been noted to occur without this addition (Jeffries, 2005)
Framework
The Plan-Do-Study/Check-Act (PDSA or PDCA) framework is being used to provide a foundation for guiding this project (Hickey & Brosnan, 2012). The PDSA's structure is a cyclic process and consists of four phases which include establishing objectives and outcomes, implementation of strategy development, analyzation with further evaluation of the results, and plan refinement to sustain and monitor advanced cycles (Holly, 2014; Sherry, 2014). The planning phase is the first during the project and examines the data. CAPS poverty simulation
results in an increased self-awareness in undergraduate nursing student's beliefs and attitudes, as discovered in the full literature review. It was found that there has not been any resultant
documentation of this intervention within the nursing student population. A plan was constructed to implement the poverty simulation into an intensive experience with nursing students. The goal was to analyze whether this addition will improve the individual attitudes and beliefs of nursing students. This purpose was measured by administering the Attitude Toward Poverty Scale (ATPS) before and after the poverty simulation to this population. Success occurred by noting a positive change in the data of the scale.
The second step that occurred was an implementation of the CAPS intervention strategy and successful collection of the ATPS data. Analyzing and studying the data results happened in the third phase while acting to revise the plan before the next implementation occurred in
carrying out the cycle again. This ongoing process was monitored and reviewed as necessary throughout the following sequences.
Methods Design
The design involved the implementation of an educational evidence-based poverty simulation practice into the BSN/DNP student's curriculum. Missouri Community Action Network (MCAN) conducted the educational experience which lasted three hours. A mixture of 45 bachelor and 29 doctorate students participated in the simulation experience to explore their thoughts and beliefs on poverty.
The particular study design was observational analytic to qualify the cause and effect relationship between factors with the identification of a priori hypothesis (Merrill, 2017). A cohort study design was preferred for this project as it examined the data of a group of people
who experienced a specific intervention, but it will not contain a control group (Merrill, 2017). Conduction of further cohort group studies will occur with the evolvement, continuation, and refinement of this project.
Setting
The University of Missouri-St. Louis was the chosen location for the poverty simulation experience. All 74 participants were from the College of Nursing at the University of Missouri-St. Louis. The Missouri Community Action Network provided the resources for the poverty simulation, as well as conducting the experience. The participants filled out questionnaires before and after the experience.
Sample
The sample consisted of forty-five Bachelors of Science (BSN) undergraduate nursing students currently taking N4300 Community Health Nursing course and thirty-two Doctorate of Nursing Practice (DNP) graduate students participating in the DNP Intensive #4 at the University of Missouri-St. Louis College of Nursing. All participants were at least 18 years old, able to read English, anonymous in the project, and voluntary participation.
Approval process
The Associate Dean for Academic Nursing Programs had previously approved the project, along with the DNP director. The University of Missouri-St. Louis College of Nursing received IRB exempt status to conduct this evidence-based project with the nursing students. There were no known risks associated with this activity, nor any direct benefits from
participating in this experience.
Data collection/analysis Collection.
The subjects wrote a random number on an index card upon their arrival that they placed on their questionnaire, without having their name anywhere. The subjects then filled out a pre-questionnaire on a designated colored paper, per Bachelors or Doctoral student, and their number and paper color was the same on their post-questionnaire immediately before and after the
intervention (Appendix B & C). The completion of this questionnaire took less than five minutes each. The informed consent was on the cover page of their pre-questionnaire, and they were encouraged to keep this for their records (Appendix D). The student's retained the index card with their number on it to assist with putting their number on the post-questionnaire to link pre- and post-test data. The data was collected and entered by hand into an SPSS database for further analysis and project completion in August 2018.
Analysis.
Data analysis was conducted with the paired t-test with the confidence interval at .05 or 95%. The paired t-test met the following criteria with two paired measurements of the
characteristics of interest are supplied at two separate points in time from the same source with the pre and post-survey (Keller & Kelvin, 2013). The other assumptions include data being normally distributed with at least 30 pairs and an interval or ratio scale measurement being used (Kellar & Kelvin, 2013). The total number of pairs for the combined study was 74, with 45 from the BSN cohort and 29 from DNP respectively. The 29 pair sample size did not meet the
assumption for the ideal sample size, so histograms were completed on each pair resulting in normal distribution and a SD of less than 1.072 within each sample. A Likert scale was also utilized for the ATPS data collection that would be classified as ordinal data; however, the ATPS scale is a validated screening tool with internal consistency, reliability, and validity having been established, therefore making data collection consistent with interval data collection (Yun &
Weaver, 2010). Data analysis was also completed with a Wilcoxen matched-pairs test to reiterate the findings due to the smaller sample size and ordinal level of measurement. The results were precisely the same between findings.
Further data analysis on the combined BSN and DNP yes/no questions were conducted with the Chi-Square test with the confidence interval at .05 or 95%. The Chi-Square test met the following criteria: the study participants constitute an independent random sample and two variables are compared that are independent of each other (Keller & Kelvin, 2013). The assumption that fewer than five cases may be expected in any cell incurred the need to include the Fisher’s exact test.
Procedures Tool.
The twenty-one item Attitude Toward Poverty Scale-Short (ATPS) Form was utilized as part of the questionnaire during this project to collect information for analyzation. Permission was granted by Dr. Yun and Dr. Weaver for the use of this tool during this project (Yun & Weaver, 2010). The ATPS Form measures a range of diverse attitudes and beliefs towards poor people and poverty (Yun & Weaver, 2010). Subscales are present within the ATPS Form to measure the personal deficiency, stigma further, and structural perspective multidimensionality. Internal consistency was established through the Cronbach’s alpha with alpha coefficients’ ranging from .87-.89 with reversing the item scores for factor three, and validity was established with this tool through correlational analysis and independent samples t-tests (Yun & Weaver, 2010).
Three demographic data questions were also utilized on the pre-questionnaire, and three yes/no questions were used on the post-questionnaire. These pre-questions address specific
demographics needed for further analyzation, including age, gender, and race, while the post-questions assess belief and attitude awareness, sensitivity, and resource awareness.
Results Sample demographics
Demographics from the 45 BSN and 29 DNP students were collected. Findings of the group demographics will be discussed separately and combined.
The BSN group represented a younger cohort with 62% being ages 18-24, 73% female, and 71% white/Caucasian (Table 1). The DNP group constituted a slightly older cohort with 44% aged 25-30 and 24% in the 31-40 age group. Gender and race closely mimicked each other with 89% female and 65% white/Caucasian. White females have been noted to be consistently represented in this nursing project, and this is a consistent finding in the ongoing literature.
Limitations.
Demographics were not collected on history of living in rural or urban areas, nor
previously experiencing poverty conditions. They were later noted to be of interest, as student's comments were made that lend themselves to know their previous background. Debriefing of the simulation could be made at a higher level if the general knowledge of poverty already exists, or creation or modification of a rural simulation is to address the group as needed in the future to pertain more directly to the intensive in which the students are attending during or relating to the course objectives more directly.
The questionnaire did not collect specific years of birth; therefore grouping of the age brackets was unequal and random. Recommendations for further studies that more particular data of birth collection occur. Caucasian females were also the prevalent gender and race,
Table 1. Demographic Characteristics of the Cohort Sample Demographic BSN (n=45) Percentage DNP (n=29) Percentage Age 18-24 28 62.2% 1 3.4% 25-30 6 13.3% 13 44.8% 31-40 5 11.1% 7 24.1% 41-50 1 2.2% 6 20.7% 51-70 1 2.2% 2 6.9% 71+ 0 0 0 0 Missing 4 0 0 Gender Male 7 15.6% 3 10.3% Female 33 73.3% 26 89.7% Other 1 2.2% 0 0 Missing 4 8.9% 0 0 Race White/Caucasian 32 71.1% 19 65.5% Black/African American 3 6.7% 5 17.2% Hispanic/Latino 0 0 0 0 Native American 1 2.2% 0 0 Asian/Pacific Islander 4 8.9% 4 13.8% Other 1 2.2% 0 0 Missing 4 8.9% 1 3.4% BSN data analysis
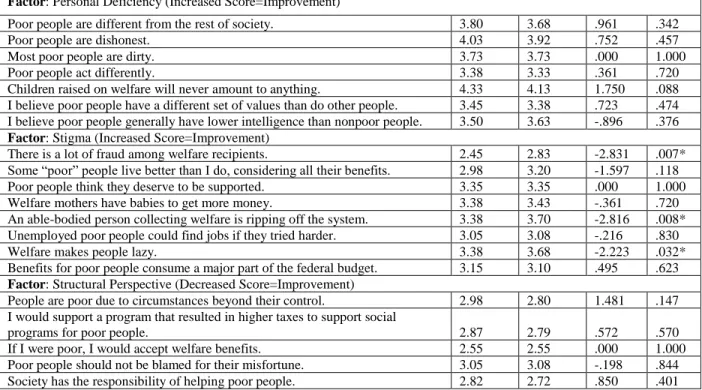
The presimulation and post-simulation means for each of the ATPS Short Form 21 items and its three domains of personal deficiency, stigma, and structural perspective were collected (Yun & Weaver, 2010). These results are only inclusive of the BSN cohort. Correlation is
significant at the 0.05 level (2-tailed) for all statistical tests. Significant changes in attitudes were noted in 4 of the 21 items, while 7 of the other items showed positive improvements and eleven showing none or negative change (Table 2). Two of the three domains showed significant change with one statement from the structural perspective being a negative change, and three statements from stigma being of positive change. No significant changes occurred in the personal deficiency
domain with the BSN group and six were shown to be a negative change. Positive attitude improvement with increased sensitivity in the domains of personal deficiency and stigma are demonstrated by a higher scale score that indicates more disagreement with the statement; whereas attitude improvement in the structural perspective domain is displayed by a decreased score.
The three additional questions for the BSN group were collected and are compiled. The simulation showed a positive change with 44% being more aware of the beliefs and attitudes, while 40% were not affected (Table 3). Sensitivity to poverty from the simulation was increased in 62%, while 22% did not have their sensitivity increased. Many were also found to improve their ability to make more appropriate referrals to community resources at 60%, and no improvement at 28%. Data was found to be missing for eleven to fifteen percent of the respondents.
Table 2. Poverty Simulation (ATPS) Short Form Scale Results for Bachelor of Science in Nursing Students (Yun & Weaver, 2010).
________________________________________________________________________________________________________
Statement Pretest Posttest t value p value
Mean Mean (sig.2-tailed) Factor: Personal Deficiency (Increased Score=Improvement)
Poor people are different from the rest of society. 3.80 3.68 .961 .342
Poor people are dishonest. 4.03 3.92 .752 .457
Most poor people are dirty. 3.73 3.73 .000 1.000
Poor people act differently. 3.38 3.33 .361 .720
Children raised on welfare will never amount to anything. 4.33 4.13 1.750 .088 I believe poor people have a different set of values than do other people. 3.45 3.38 .723 .474 I believe poor people generally have lower intelligence than nonpoor people. 3.50 3.63 -.896 .376 Factor: Stigma (Increased Score=Improvement)
There is a lot of fraud among welfare recipients. 2.45 2.83 -2.831 .007*
Some “poor” people live better than I do, considering all their benefits. 2.98 3.20 -1.597 .118
Poor people think they deserve to be supported. 3.35 3.35 .000 1.000
Welfare mothers have babies to get more money. 3.38 3.43 -.361 .720
An able-bodied person collecting welfare is ripping off the system. 3.38 3.70 -2.816 .008* Unemployed poor people could find jobs if they tried harder. 3.05 3.08 -.216 .830
Welfare makes people lazy. 3.38 3.68 -2.223 .032*
Benefits for poor people consume a major part of the federal budget. 3.15 3.10 .495 .623 Factor: Structural Perspective (Decreased Score=Improvement)
People are poor due to circumstances beyond their control. 2.98 2.80 1.481 .147 I would support a program that resulted in higher taxes to support social
programs for poor people. 2.87 2.79 .572 .570
If I were poor, I would accept welfare benefits. 2.55 2.55 .000 1.000
Poor people should not be blamed for their misfortune. 3.05 3.08 -.198 .844 Society has the responsibility of helping poor people. 2.82 2.72 .850 .401
Poor people are discriminated against. 2.25 2.70 -2.683 .011* Scale Scores: 1=strongly agree (SA), 2=agree (A), 3=neutral (N), 4=disagree (D), 5=strongly disagree (SD) *Significant Table 3. Yes/No post-test survey question results for Bachelor of Science in Nursing Students.
Yes/No Questions w/comments Yes (n=45) No (n=45) Missing
A. This simulation enabled me to be more aware of my beliefs and attitudes towards poverty.
20 18 7
B. This knowledge obtained will allow me to be more sensitive to the population of individuals whom live in poverty.
28 10 7
C. The knowledge of limited resources that I gained through this poverty simulation will improve my ability to make more appropriate referrals to community resources in the future as a health care professional.
27 13 5
DNP data analysis
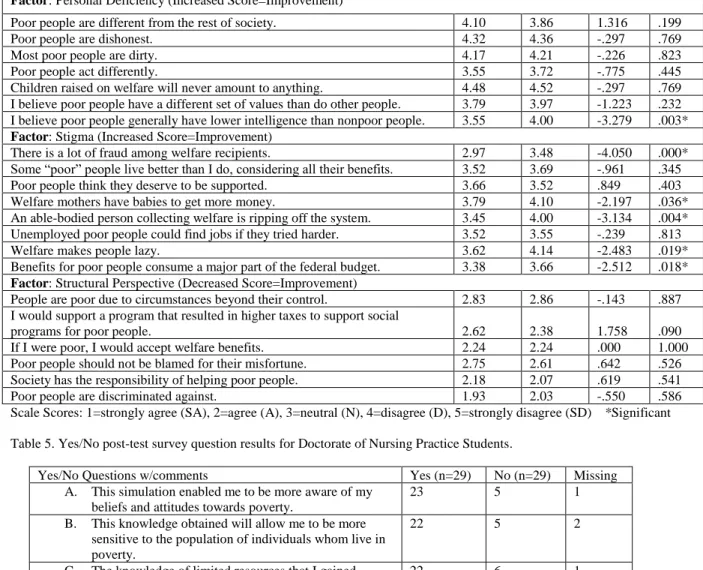
The presimulation and post-simulation means for each of the ATPS Short From 21 items and its three domains of personal deficiency, stigma, and structural perspective were collected (Yun & Weaver, 2010). These results are only inclusive of the DNP cohort. Correlation is significant at the 0.05 level (2-tailed) for all statistical tests. Significant improvements in attitudes were noted in 6 of the 21 items, while 10 of the other items showed positive
improvements and five showing none or negative change (Table 4). Two of the three domains showed significant improvement with one statement from the personal deficiency, and five statements from stigma. No significant changes were noted from the structural perspective
domain with the DNP group, but three showed positive change and three showed none or negative change. Positive attitude improvement with increased sensitivity in the domains of
personal deficiency and stigma are shown by a higher scale score that indicates more disagreement with the statement; whereas attitude improvement in the structural perspective
domain is displayed by a decreased score.
The three additional questions for the DNP group were collected and are compiled. The simulation showed an extremely high positive change result with 79% being more aware of beliefs and attitudes, while 17% were not affected (Table 5). Sensitivity to poverty from the
simulation was increased in 75%, while 10% did not have their sensitivity increased. Many were also found to improve their ability to make more appropriate referrals to community resources at 75%, and no improvement at 20%. Data was found to be missing for three to six percent of the respondents.
Table 4. Poverty Simulation (ATPS) Short Form Scale Results for Doctorate of Nursing Practice Students (Yun & Weaver, 2010).
_____________________________________________________________________________________________
Statement Pretest Posttest t value p value Mean Mean (sig.2-tailed) Factor: Personal Deficiency (Increased Score=Improvement)
Poor people are different from the rest of society. 4.10 3.86 1.316 .199
Poor people are dishonest. 4.32 4.36 -.297 .769
Most poor people are dirty. 4.17 4.21 -.226 .823
Poor people act differently. 3.55 3.72 -.775 .445
Children raised on welfare will never amount to anything. 4.48 4.52 -.297 .769 I believe poor people have a different set of values than do other people. 3.79 3.97 -1.223 .232 I believe poor people generally have lower intelligence than nonpoor people. 3.55 4.00 -3.279 .003* Factor: Stigma (Increased Score=Improvement)
There is a lot of fraud among welfare recipients. 2.97 3.48 -4.050 .000*
Some “poor” people live better than I do, considering all their benefits. 3.52 3.69 -.961 .345
Poor people think they deserve to be supported. 3.66 3.52 .849 .403
Welfare mothers have babies to get more money. 3.79 4.10 -2.197 .036*
An able-bodied person collecting welfare is ripping off the system. 3.45 4.00 -3.134 .004* Unemployed poor people could find jobs if they tried harder. 3.52 3.55 -.239 .813
Welfare makes people lazy. 3.62 4.14 -2.483 .019*
Benefits for poor people consume a major part of the federal budget. 3.38 3.66 -2.512 .018* Factor: Structural Perspective (Decreased Score=Improvement)
People are poor due to circumstances beyond their control. 2.83 2.86 -.143 .887 I would support a program that resulted in higher taxes to support social
programs for poor people. 2.62 2.38 1.758 .090
If I were poor, I would accept welfare benefits. 2.24 2.24 .000 1.000
Poor people should not be blamed for their misfortune. 2.75 2.61 .642 .526 Society has the responsibility of helping poor people. 2.18 2.07 .619 .541
Poor people are discriminated against. 1.93 2.03 -.550 .586
Scale Scores: 1=strongly agree (SA), 2=agree (A), 3=neutral (N), 4=disagree (D), 5=strongly disagree (SD) *Significant Table 5. Yes/No post-test survey question results for Doctorate of Nursing Practice Students.
Yes/No Questions w/comments Yes (n=29) No (n=29) Missing
A. This simulation enabled me to be more aware of my beliefs and attitudes towards poverty.
23 5 1
B. This knowledge obtained will allow me to be more sensitive to the population of individuals whom live in poverty.
22 5 2
C. The knowledge of limited resources that I gained through this poverty simulation will improve my ability to make more appropriate referrals to community resources in the future as a health care professional.
22 6 1
Three statements in the stigma domain and one statement in the personal deficiency
domain were found to be significant for both the BSN and DNP groups. Four statements in the
stigma and structural perspective domains were found to be improved for both groups, but two showed negative change. Positive improvements were noted in fifteen of the twenty-one items within all three domains with the BSN/DNP cohorts combined.
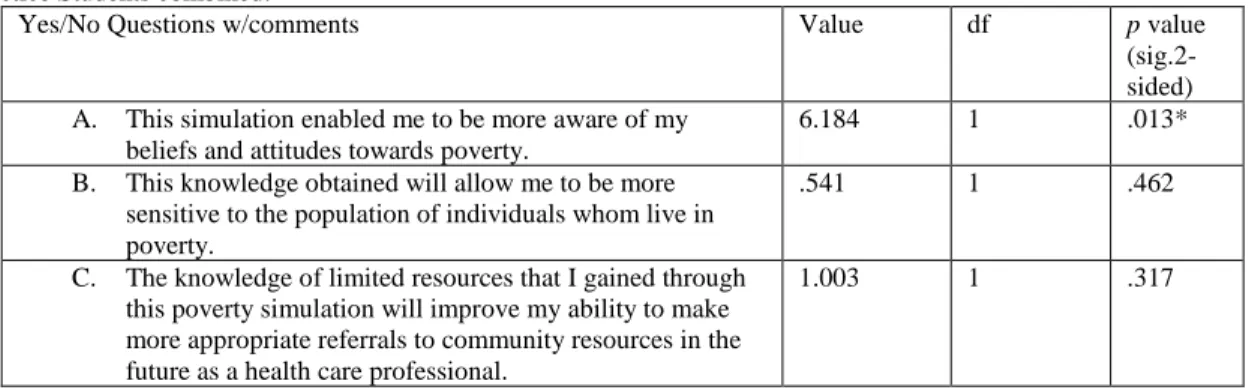
The DNP students were more likely to have an enhanced awareness of their attitudes and beliefs towards poverty after the simulation than the BSN students (Table 6). Both groups had an increase in their knowledge of poverty and resources from the simulation, although not of
significance.
Table 6. Yes/No post-test survey question Chi-Square results for Bachelor of Science in Nursing and Doctorate of Nursing Practice Students combined.
Yes/No Questions w/comments Value df p value
(sig.2-sided) A. This simulation enabled me to be more aware of my
beliefs and attitudes towards poverty.
6.184 1 .013*
B. This knowledge obtained will allow me to be more sensitive to the population of individuals whom live in poverty.
.541 1 .462
C. The knowledge of limited resources that I gained through this poverty simulation will improve my ability to make more appropriate referrals to community resources in the future as a health care professional.
1.003 1 .317
*Significant
Discussion Explanation
Overall, significant findings were present in both groups, but more were found for the DNP cohort. The DNP cohort was noted to have higher scores initially, thus being more
favorable in the presurvey about their attitudes and beliefs of poverty. The BSN cohort showed significant improvement in the stigma domain with an increasing disagreement about fraud, welfare and being lazy, while the DNP cohort showed significant improvement in the stigma domain with an increasing disagreement about fraud, mothers having babies to get more money,
welfare, being lazy, and spending much of the federal budget. The DNP cohort also had significance in the personal deficiency domain disagreeing more about lower intelligence. One significant, but undesired change was noted in the BSN cohort to be poor people are
discriminated against.
Although the post-survey yes/no questions were not a part of the original survey, they were created as general questions to see if the participants felt enabled, more aware, sensitive, and empowered to make appropriate referrals. All of the results were strong at over a 50% rate for each question and some approaching 75% or higher, except the BSN cohort at 44% on enabling them to be more aware of their beliefs and attitudes towards poverty.
The negative or non-ideal changes that occurred with the BSN cohort included being different, acting different, children not amounting to anything, different set of values,
consumption of budget, and blamed for their misfortune, which was consistent with the current literature's findings. The negative or non-ideal changes that occurred with the DNP cohort were fewer and included being different, deserving, circumstances, and discrimination.
Limitations.
The demographic data was previously discussed as missing data on rural versus urban background, and previous exposure to poverty. The sample size was also noted to be small, while only representative of mainly Caucasian females. These limitations make it difficult to establish the student's ability to grow in self-reflection and also their needs for a fuller discussion on these particular topics during debriefing.
Another limitation was that an external facilitator was used and he received negative comments about being rude to the students. This individual was not aware of how the poverty simulation fit into the two different curriculums, as well as the need to educate the students on
making appropriate referrals in the community. Future facilitators need to possess this information and plan their facilitation appropriately.
Implications
Results of this project demonstrated that changes were significant with implications to positively affect future cohorts experiencing the CAPS poverty simulation. Nursing students showed significant and positive changes in their attitudes and beliefs about poverty
demonstrating the need for improvement and self-reflection of their own beliefs. This project adds dimension to the current literature for further studies that may bridge that gap in the evidence-base of graduate prepared nurses in taking care of those in poverty.
The further addition of the poverty simulation should be expanded to other cohorts within the current undergraduate and graduate curriculum and new additions of the rural poverty
simulation developed for adding to intensive number three within the DNP program. The poverty simulation as is, will continue to be added to intensive number one, thus encouraging the true immersion into the objectives and goals of the initial intensive in the graduate program.
Conclusion Summary
Poverty is a significant social determinant of health that affects our communities every day and nursing students are in a key position to make a significant impact on the individuals whom are directly affected by poverty. This project has displayed significant results of nursing students benefitting from the addition of a CAPS poverty simulation experience to positively influence their self-awareness and individual-level beliefs and attitudes towards poverty, therefore being able to serve those in poverty fully and guide them to appropriate resources.
The poverty simulation additional request for funding proposal has been submitted and is pending. Addition of the poverty simulation will occur into the current undergraduate curriculum for fall 2018, but it will be changed to the beginning of the semester within the N4300
Community Health Nursing course. The BSN cohort will again have it as part of their clinical hours as a simulation substitute, and it will be combined with the graduate nursing intensive. The graduate nursing DNP curriculum will be moving the poverty simulation from intensive number four in the middle of their program, to the beginning of their program in intensive number one. The DNP cohort will then be able to measure an advanced growth of the understanding of poverty as a social determinant of health throughout the program.
References
Aspden, T., Sheridan, J., & Harrison, J. (2016). “Talking and thinking”: Impact of a simulation on pharmacy undergraduates’ beliefs and attitudes about living in poverty. Currents in Pharmacy Teaching and Learning, 8, 447-457. https://doi.org/10.1016/j.cptl.2016.03.016 Bambini, D., Washburn, J., & Perkins, R. (2009). Outcomes of clinical simulations for novice
nursing students: Communication, confidence, clinical judgment. Nursing Education Perspectives, 30, 79-82.
Brown, D., & Chronister, C. (2009). The effect of simulation learning on critical thinking and self-confidence when incorporated into an electrocardiogram nursing course. Clinical Simulation in Nursing, 5, 45-52.
Census Bureau. (2015). How the census bureau measures poverty. Retrieved from https://www.census.gov/hhes/www/poverty/about/overview/measure.html
Centers for Disease Control and Prevention. (2014). NCHHSTP Social determinants of health. Retrieved from https://www.cdc.gov/nchhstp/socialdeterminants/definitions.html Clarke, C., Sedlacek, R. K., & Watson, S. B. (2016). Impact of a simulation exercise on
pharmacy student attitude toward poverty. American Journal of Pharmaceutical Education, 80(2), 1-7.
Divisions of Family Practice. (2015). Our impact: Social determinants of health. Retrieved from http://divisionsbc.ca
Gantt, L. T., & Webb-Corbett, R. (2010). Using simulation to teach patient safety behaviors in undergraduate nursing education. Journal of Nursing Education, 1, 48-51.
Harder, B. N. (2010). Use of simulation in teaching and learning in health sciences: A systemic review. Journal of Nursing Education, 49, 23-28.
Hickey, J. V., & Brosnan, C. A. (2012). Evaluation of healthcare quality in advanced practice nursing. New York, NY: Springer Publishing Company, LLC.
Holly, C. (2014). Quality improvement. In Scholarly inquiry and the DNP capstone (pp. 137-155). New York: Springer Publishing Company.
Jeffries, P. (2005). A framework for designing, implementing, and evaluating simulations used as teaching strategies in nursing. Nursing Education Perspectives, 26, 96-103.
Jeffries, P., Linde, B., & Woolf, S. (2003). Technology-based vs. traditional instruction: A comparison of two methods for teaching the skill of performing a 12-lead ECG. Nursing Education Perspectives, 24, 70-74.
Jeffries, P., & Rizzolo, M. A. (2006). Final report of the NLN/Laerdal simulation study. In P. Jeffries (Ed.), Simulation in nursing education: From conceptualization to evaluation
(pp. 147-159). New York: National League for Nursing.
Kellar, S. P., & Kelvin, E. A. (2013). The paired t test and the Wilcoxon matched-pairs signed rank test: Comparing the means/medians of two related groups. In Munro’s statistical
methods for health care research (6th ed. (pp. 127-150). China: Wolter Kluwer Health/Lippincott Williams & Wilkins.
Larew, C., Lessans, S., Spunt, D., Foster, D., & Covington, B. (2006). Application of Benner’s theory in an interactive patient care simulation. Nursing Education Perspectives, 27, 16-21.
Merriam-Webster. (2016). Definition of poverty. Retrieved from http://www.merriam-webster.com/dictionary/poverty
Merrill, R. M. (2017). Design strategies and statistical methods in analytic epidemiology. In
Introduction to epidemiology (7th ed. (pp. 141-158). Burlington, MA: Jones & Bartlett Learning.
Missouri Association for Community Action [MACA]. (2016). 2016 State of the state poverty in Missouri [White Paper]. Retrieved from http://www.communityaction.org/poverty-reports/
Missouri Community Action Network [MCAN]. (2016). The community action poverty
simulation [Consumer Brochure]. Retrieved from http://www.povertysimulation.net/for-kit-owners/#brochure
Nickols, S. Y., & Nielsen, R. B. (2011). “So many people are struggling”: Developing social empathy through a poverty simulation. Journal of Poverty, 15, 22-42.
https://doi.org/10.1080/10875549.2011.539400
Noone, J., Sideras, S., Gubrud-Howe, P., Voss, H., & Mathews, L. R. (2012). Influence of a poverty simulation on nursing student attitudes toward poverty. Journal of Nursing Education, 51(X), 1-6. https://doi.org/10.3928/01484834-20120914-01
Patterson, N., & Hulton, L. J. (2012, March/April). Enhancing nursing students’ understanding of poverty through simulation. Public Health Nursing, 29(2), 143-151.
https://doi.org/10.1111/j.1525-1446.2011.00999.x
Reid, C. A., & Evanson, T. A. (2016, March/April). Using simulation to teach about poverty in nursing education: A review of available tools. Journal of Professional Nursing, 32(2), 130-140. https://doi.org/10.1016/j.profnurs.2015.10.002
Semega, J. L., Fontenot, K. R., & Kollar, M. A. (2017). Income and poverty in the United States: 2016 (U.S. Census Bureau, Current Population Reports, P60-259). Washington, DC.: U.S. Government Printing Office.
Shepherd, C. K., McCunnis, M., Brown, L., & Hair, M. (2010). Investigating the use of simulation as a teaching strategy. Nursing Standard, 24, 42-48.
Sherry, M. (2014). Ongoing monitoring. In M. L. Sylvia & M. F. Terhaar, Clinical analytics and data management for the DNP (pp. 189-214). New York: Springer Publishing Company. Steck, L. W., Engler, J. N., Ligon, M., Druen, P. B., & Cosgrove, E. (2011, July). Doing poverty:
Learning outcomes among students participating in the community action poverty simulation program. Teaching Sociology, 39(3), 259-273.
https://doi.org/10.1177/0092055X11407347
Strasser, S., Smith, M. O., Denney, D. P., Jackson, M. C., & Buckmaster, P. (2013). A poverty simulation to inform public health practice. American Journal of Health Education,
44(5), 259-264. https://doi.org/10.1080/19325037.2013.811366
Todd, M., De Guzman, M. R., & Zhang, X. (2011). Using poverty simulation for college students: A mixed-methods evaluation. Journal of Youth Development, 6(2), 1-5. United States Census Bureau. (2016). Poverty thresholds. Retrieved from
https://www.census.gov/hhes/www/poverty/data/threshld/index.html
Vandsburger, E., Duncan-Daston, R., Akerson, E., & Dillon, T. (2010). The effects of poverty simulation, an experiential learning modality, on students’ understanding of life in poverty. Journal of Teaching in Social Work, 30(3), 300-316.
Washington University in St. Louis. (2015). For the sake of all. A report on the health and well-being of African Americans in St. Louis and why it matters for everyone. Retrieved from https://forthesakeofall.org/wp-content/uploads/2016/06/FSOA_report_2.pdf
Yang, K., Woomer, G. R., Agbemenu, K., & Williams, L. (2014). Relate better and judge less: Poverty simulation promoting culturally competent care in community health nursing.
Nurse Education in Practice, 14, 680-685. https://doi.org/10.1016/j.nepr.2014.09.001 Yun, S. H., & Weaver, R. D. (2010). Development and validation of a short form of the attitude