University of South Florida
Scholar Commons
Graduate Theses and Dissertations Graduate School
10-10-2008
Correlates of Mathematics Achievement in
Developed and Developing Countries: An HLM
Analysis of TIMSS 2003 Eighth-Grade
Mathematics Scores
Ha T. Phan
University of South Florida
Follow this and additional works at:https://scholarcommons.usf.edu/etd
Part of theAmerican Studies Commons
This Dissertation is brought to you for free and open access by the Graduate School at Scholar Commons. It has been accepted for inclusion in Graduate Theses and Dissertations by an authorized administrator of Scholar Commons. For more information, please contact
Scholar Commons Citation
Phan, Ha T., "Correlates of Mathematics Achievement in Developed and Developing Countries: An HLM Analysis of TIMSS 2003 Eighth-Grade Mathematics Scores" (2008).Graduate Theses and Dissertations.
Correlates of Mathematics Achievement in Developed and Developing Countries: An HLM Analysis of TIMSS 2003 Eighth-Grade Mathematics Scores
by
Ha T. Phan
A dissertation submitted in partial fulfillment of the requirements for the degree of
Doctor of Philosophy
Department of Educational Measurement and Evaluation College of Education
University of South Florida
Major Professor: Jeffrey D. Kromrey, Ph.D. Robert F. Dedrick, Ph.D. John M. Ferron, Ph.D. Christina Sentovich, Ph.D. Date of Approval: October 10, 2008
Keywords: secondary data, math performance, multilevel analysis, large-scale assessment, international research
DEDICATION
This manuscript is dearly dedicated to my family. To my father and mother whose positive influences on my life, my education, and the work presented here, have been tremendous. To my wonderful husband, Son and my two beautiful children, Thao and Namson, whose endless love and caring and countless support have made my educational dream possible.
ACKNOWLEDGEMENTS
I would like to thank the following individuals for their significant contributions toward my successful completion of this degree. First, I would like to thank Jeffrey Kromrey, my major professor, for his wonderful guidance, support, and wisdom that benefited me in many ways throughout this dissertation journey. I am also in gratitude to my committee, John Ferron, Robert Dedrick, and Christina Sentovich for their insightful feedback and efforts in the preparation of this manuscript. I am grateful to Gladis
Kersaint and Denisse Thompson from the Math Education Program for their valuable consultations and recommendations related to the work presented here. Also, I am
grateful to Lou Carey and Cynthia Parshall who first inspired my interest in measurement and research. Finally, I would like to acknowledge the National Center for Education Statistics for their training in large-scale data analysis as well as their provision of the data for this research.
i
TABLE OF CONTENTS
LIST OF TABLES ... V
LIST OF FIGURES ... VIII
ABSTRACT ... X
CHAPTER ONE: INTRODUCTION ... 1
STATEMENT OF PROBLEM ... 1
PURPOSE OF THE STUDY ... 2
RESEARCH QUESTIONS ... 3
RATIONALES FOR THE STUDY ... 4
THEORETICAL FRAMEWORK ... 6
LIMITATIONS ... 6
DEFINITIONS ... 8
CHAPTER TWO: LITERATURE REVIEW ... 10
INTRODUCTION ... 10
HISTORY OF INTERNATIONAL MATHEMATICS ACHIEVEMENT ASSESSMENTS ... 10
IMPORTANCE OF INTERNATIONAL MATHEMATICS ACHIEVEMENT ASSESSMENTS ... 12
THEORETICAL FRAMEWORK ... 14
STUDENT-RELATED FACTORS AND STUDENT ACHIEVEMENT ... 16
Gender ... 16 Self-confidence in Learning ... 18 Valuing of Learning ... 19 Family Background... 23 Time on Homework ... 26 Academic Tutoring ... 30
INSTRUCTIONAL PRACTICES-RELATED FACTORS AND STUDENT ACHIEVEMENT ... 34
Opportunity to Learn ... 34
Homework Assignment ... 39
Classroom Activities ... 42
Instructional Time ... 45
TEACHER-RELATED FACTORS AND STUDENT ACHIEVEMENT ... 50
Preparation to Teach ... 50
Readiness to Teach ... 53
Professional Development ... 56
SCHOOL-RELATED FACTORS AND STUDENT ACHIEVEMENT ... 61
Class Size ... 62
School Resources ... 66
Instructional Limitations ... 69
SUMMARY ... 73
CHAPTER THREE:METHOD ... 80
PURPOSE OF THE STUDY ... 80
RESEARCH QUESTIONS ... 80
RESEARCH DESIGN ... 81
Data Source ... 81
Sampling Procedures ... 82
ii
Sample ... 83
Country Profiles ... 85
Canada ... 85
The United States ... 87
Egypt ... 88
South Africa ... 89
Instruments ... 91
Eighth-grade Mathematics Assessment Survey ... 91
Test booklet ... 91
Subject content areas ... 93
Item writing and development ... 93
Item types ... 95
Translation, cultural adaptation, and verification ... 95
Reliability estimates ... 95
Reported achievement scores ... 97
Raw scores ... 97
Standardized raw scores ... 98
National Rasch scores ... 98
Plausible values ... 98
Background Surveys ... 99
Eighth-grade mathematics student background survey. ... 99
Eighth-grade mathematics teacher survey ... 100
School survey ... 100
Variables ... 101
Reliability of Composite Predictor Variables ... 108
Content Experts’ Validation of the Selected Variables ... 111
Interview with Content Expert One ... 111
Interview with Content Expert Two ... 112
Follow-up Interviews with Content Experts ... 113
DATA ANALYSIS ... 114
Secondary Data Analysis ... 114
Advantages ... 114
Disadvantages ... 116
Hierarchical Linear Modeling ... 117
Advantages of Multilevel Models ... 118
Assumptions of Multilevel Models ... 119
Analyses of TIMSS 2003 Database ... 121
Sampling Weights ... 121
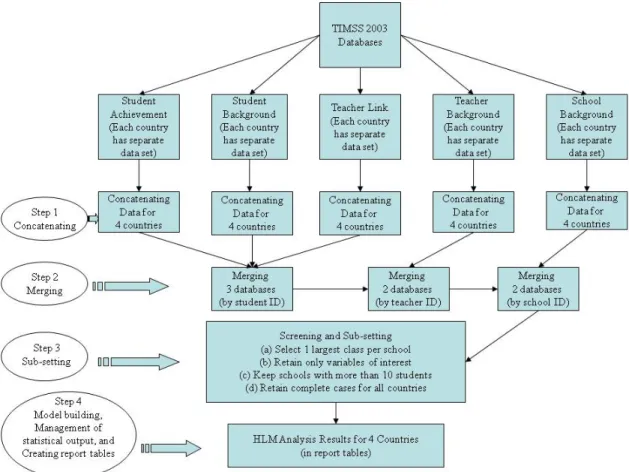
Managing Multiple Databases ... 122
Treatment of Missing Data... 123
Univariate Analysis ... 124
Bivariate Analysis ... 124
Hierarchical Linear Modeling Analysis ... 124
Recoding Predictor Variables for HLM Analyses ... 126
Models of the Study ... 126
Power Analysis ... 130
Summary ... 130
CHAPTER FOUR: RESULTS ... 132
RESULTS FOR THE UNITED STATES ... 132
Evaluation of Missing Data ... 132
Univariate Analysis ... 132
Bivariate Analysis ... 135
Evaluation of HLM Assumptions ... 137
HLM Analysis ... 141
iii Research Question 1 ... 142 Research Question 2 ... 146 Research Question 3 ... 149 Research Question 4 ... 157 Research Question 5 ... 163 Final Model ... 169
RESULTS FOR CANADA ... 174
Evaluation of Missing Data ... 174
Univariate Analysis ... 174
Bivariate Analysis ... 177
Evaluation of HLM Assumptions ... 178
HLM Analysis ... 183
Unconditional model (Model 1) ... 183
Research Question 1 ... 184 Research Question 2 ... 188 Research Question 3 ... 191 Research Question 4 ... 202 Research Question 5 ... 209 Final Model ... 212
RESULTS FOR EGYPT ... 222
Evaluation of Missing Data ... 222
Univariate Analysis ... 222
Bivariate Analysis ... 225
Evaluation of HLM Assumptions ... 226
HLM Analysis ... 228
Unconditional Model (Model 1) ... 228
Research Question 1 ... 229 Research Question 2 ... 233 Research Question 3 ... 236 Research Question 4 ... 240 Research Question 5 ... 243 Final Model ... 246
RESULTS FOR SOUTH AFRICA ... 248
Evaluation of Missing Data ... 248
Univariate Analysis ... 248
Bivariate Analysis ... 251
Evaluation of HLM Assumptions ... 252
HLM Analysis ... 258
Unconditional model (Model 1) ... 258
Research Question 1 ... 259 Research Question 2 ... 263 Research Question 3 ... 266 Research Question 4 ... 272 Research Question 5 ... 277 Final Model ... 281 SUMMARY OF RESULTS ... 283 Missing Data ... 283 Univariate Analysis ... 283 Bivariate Analysis ... 285 Evaluation of HLM Assumptions ... 285 HLM Analysis ... 285 Unconditional model ... 285 Research Question 1 ... 286 Research Question 2 ... 287 Research Question 3 ... 289 Research Question 4 ... 290
iv
Research Question 5 ... 291
Final Model ... 292
CHAPTER FIVE - DISCUSSION ... 294
PURPOSE... 294
REVIEW OF METHOD ... 294
RESULTS ... 296
Home Resources Model ... 298
Instructional Practices Model ... 299
Teacher Background Model ... 301
School Background Model ... 303
Final Model ... 305 LIMITATIONS ... 305 IMPLICATIONS ... 308 FUTURE RESEARCH ... 309 REFERENCES ... 310 APPENDICES ... 324
APPENDIX A–LIST OF COUNTRIES ... 325
APPENDIX B-ITEMS USED TO CREATE COMPOSITE VARIABLE OPPORTUNITY TO LEARN ... 326
APPENDIX C-ITEMS USED TO CREATE COMPOSITE VARIABLE READY TO TEACH MATH TOPICS ... 330
APPENDIX D–RELIABILITIES OF COMPOSITE VARIABLES ... 332
APPENDIX E-WEIGHTED CORRELATION OF LEVEL-1VARIABLES FOR USA ... 338
APPENDIX F-UNWEIGHTED CORRELATION OF LEVEL-2VARIABLES FOR USA ... 316
APPENDIX G-WEIGHTED CORRELATION OF LEVEL-1VARIABLES FOR CANADA ... 317
APPENDIX H–UNWEIGHTED CORRELATION OF LEVEL-2VARIABLES FOR CANADA ... 318
APPENDIX I– WEIGHTED CORRELATION OF LEVEL-1VARIABLES FOR EGYPT ... 319
APPENDIX K–UNWEIGHTED CORRELATION OF LEVEL-2VARIABLES FOR EGYPT ... 320
APPENDIX L-WEIGHTED CORRELATION OF LEVEL-1VARIABLES FOR SOUTH AFRICA ... 321
APPENDIX M–UNWEIGHTED CORRELATION OF LEVEL-2VARIABLES FOR SOUTH AFRICA ... 322
v
LIST OF TABLES
Table 1: Summary of the Samples Included in the Study ... 85
Table 2. TIMSS 2003 Eighth-grade Math Assessment Booklet Assembling Matrix ... 92
Table 3. Number of Items by Domain and Booklet in TIMSS 2003 Eighth-grade Math Assessment ... 93
Table 4. Maximum Number of Score Points in TIMSS 2003 Eighth Grade Math Assessment ... 98
Table 5. Mapping of Variables in Caroll’s Model With Variables in the Proposed Study ... 102
Table 6. Description of Contextual and Background Variable ... 103
Table 7. Weighted Descriptive Statistics for Level-1 Variables for USA (N = 4,414) ... 133
Table 8. Unweighted Descriptive Statistics for Level-1 Variables for USA (N = 4,414) ... 133
Table 9. Unweighted Descriptive Statistics for Level-2 Variables for USA (N = 153) ... 135
Table 10. Parameter Estimates for Unconditional Model for USA ... 142
Table 11. Parameter Estimates for Models 2-6 (Level-1 Student Background) for USA ... 143
Table 12. Parameter Estimates for Models 7 (Level-1 Student Background) for USA ... 145
Table 13. Comparison of R2 between Model 7 and Previously Constructed Models for USA ... 146
Table 14. Parameter Estimates forLevel-1 Home Resources Model for USA ... 147
Table 15. Parameter Estimates for Combined Level-1 Predictors Model for USA ... 148
Table 16. Parameter Estimates for Level-2 Instructional Practices Models for USA ... 150
Table 17. Comparison of R2 between Level-2 Instructional Practice Models and Foundational Level-1 Model for USA ... 152
Table 18. Parameter Estimates for the Combined Level-2 Instructional Practices Model for USA ... 153
Table 19. Comparison of R2 between Model 14 and Previously Constructed Models 9-13 for USA ... 154
Table 20. Parameter Estimates for Teacher Background Models for USA ... 158
Table 21. Comparison of R2 between Level-2 Teacher Background and Foundational Level-1 Model for USA ... 160
Table 22. Parameter Estimates for the Combined Teacher Background Model for USA ... 160
Table 23. Comparison of R2 between Model 18 and Previously Constructed Models 9 and 15-17 ... 162
Table 24. Parameter Estimates for School Background Models for USA ... 164
Table 25. Comparison of R2 between Level-2 Teacher Background and Foundational Level-1 Model for USA ... 166
Table 26. Parameter Estimates for the Combined School Background Model for USA ... 166
Table 27. Comparison of R2 between Model 22 and Previously Constructed Models 9 and 19-21 for USA ... 167
Table 28. Parameter Estimates for Full Model for USA ... 170
Table 29. Comparison of R2 between Model 23 and Previously Constructed Models 14, 18 and 22 for USA ... 171
Table 30. Weighted Descriptive Statistics for Level-1 Variables for Canada (N = 6,248) ... 175
Table 31. Unweighted Descriptive Statistics for Level-1 Variables for Canada (N = 6,248) ... 175
Table 32. Unweighted Descriptive Statistics for Level-2 Variables for Canada (N = 271) ... 177
Table 33. Parameter Estimates for Unconditional Model for Canada ... 184
Table 34. Parameter Estimates for Models 2-6 (Level-1 Student Background) for Canada ... 185
Table 35. Parameter Estimates for Model 7 (Level-1 Student Background) for Canada ... 187
Table 36. Comparison of R2 between Model 7 and Previously Constructed Models for Canada ... 188
Table 37. Parameter Estimates forLevel-1 Home Resources Model for Canada ... 189
Table 38. Parameter Estimates for Combined Level-1 Predictors Model for Canada ... 190
Table 39. Parameter Estimates for Level-2 Instructional Practices Models for Canada ... 192
Table 40. Comparison of R2 between Level-2 Instructional Practice Models and Foundational Level-1 Model for Canada ... 195
vi
Table 42. Comparison of R2 between Model 14 and Previously Constructed Models 9-13 for
Canada ... 197
Table 43. Parameter Estimates for Teacher Background Models for Canada ... 203
Table 44. Comparison of R2 between Level-2 Teacher Background and Foundational Level-1 Model for Canada ... 205
Table 45. Parameter Estimates for the Combined Teacher Background Model for Canada ... 205
Table 46. Comparison of R2 between Model 18 and Previously Constructed Models 9 and 15-17 ... 206
Table 47. Parameter Estimates for School Background Models for Canada ... 209
Table 48. Comparison of R2 between Level-2 Teacher Background and Foundational Level-1 Model for Canada ... 210
Table 49. Parameter Estimates for the Combined School Background Model for Canada ... 211
Table 50. Comparison of R2 between Model 22 and Previously Constructed Models 9 and 19-21 for Canada ... 212
Table 51. Parameter Estimates for Full Model for Canada ... 213
Table 52. Comparison of R2 between Model 23 and Previously Constructed Models 14, 18 and 22 for Canada ... 215
Table 53. Weighted Descriptive Statistics for Level-1 Variables for Egypt (N = 1,876) ... 223
Table 54. Unweighted Descriptive Statistics for Level-1 Variables for Egypt (N = 1,876) ... 223
Table 55. Unweighted Descriptive Statistics for Level-2 Variables for Egypt (N =69) ... 225
Table 56. Parameter Estimates for Unconditional Model for Egypt ... 229
Table 57. Parameter Estimates for Models 2-6 (Level-1 Student Background) for Egypt ... 230
Table 58. Parameter Estimates for Model 7 (Level-1 Student Background) for Egypt ... 232
Table 59. Comparison of R2 between Model 7 and Previously Constructed Models for Egypt ... 233
Table 60. Parameter Estimates forLevel-1 Home Resources Model for Egypt ... 234
Table 61. Parameter Estimates for Combined Level-1 Predictors Model for Egypt ... 235
Table 62. Parameter Estimates for Level-2 Instructional Practices Models for Egypt ... 237
Table 63. Comparison of R2 between Level-2 Instructional Practice Models and Foundational Level-1 Model for Egypt ... 238
Table 64. Parameter Estimates for the Combined Level-2 Instructional Practices Model for Egypt ... 238
Table 65. Comparison of R2 between Model 14 and Previously Constructed Models 9-13 for Egypt ... 239
Table 66. Parameter Estimates for Teacher Background Models for Egypt ... 241
Table 67. Parameter Estimates for the Combined Teacher Background Model for Egypt ... 242
Table 68. Comparison of R2 between Model 18 and Previously Constructed Models 9 and 16-17 for Egypt ... 242
Table 69. Parameter Estimates for School Background Models for Egypt ... 243
Table 70. Comparison of R2 between Level-2 Teacher Background and Foundational Level-1 Model for Egypt ... 244
Table 71. Parameter Estimates for the Combined School Background Model for Egypt ... 245
Table 72. Comparison of R2 between Model 22 and Previously Constructed Models 9 and 19-21 for Egypt ... 245
Table 73. Parameter Estimates for Full Model for Egypt ... 246
Table 74. Comparison of R2 between Model 23 and Previously Constructed Models 14, 18 and 22 for Egypt ... 247
Table 75. Weighted Descriptive Statistics for Level-1 Variables for South Africa (N = 1,564) ... 249
Table 76. Unweighted Descriptive Statistics for Level-1 Variables for South Africa (N = 1,564) ... 249
Table 77. Unweighted Descriptive Statistics for Level-2 Variables for South Africa (N =52) ... 250
Table 78. Comparisons of Results for South Africa ... 255
Table 79. Parameter Estimates for Unconditional Model for South Africa... 259
Table 80. Parameter Estimates for Models 2-6 (Level-1 Student Background) for South Africa ... 260
Table 81. Parameter Estimates for Model 7 (Level-1 Student Background) for South Africa ... 262
Table 82. Comparison of R2 between Model 7 and Previously Constructed Models for South Africa ... 263
Table 83. Parameter Estimates for Level-1 Home Resources Model for South Africa ... 264
Table 84. Parameter Estimates for Combined Level-1 Predictors Model for South Africa ... 265
vii
Table 86. Comparison of R2 between Level-2 Instructional Practice Models and Foundational
Level-1 Model ... 269 Table 87. Parameter Estimates for the Combined Level-2 Instructional Practices Model for South
Africa ... 271 Table 88. Comparison of R2 between Model 14 and Previously Constructed Models 9-13 for South
Africa ... 272 Table 89. Parameter Estimates for Teacher Background Models for South Africa ... 273 Table 90. Parameter Estimates for the Combined Teacher Background Model for South Africa ... 276 Table 91. Comparison of R2 between Model 18 and Previously Constructed Models 9 and 15-17
for South Africa ... 277 Table 92. Parameter Estimates for School Background Models for South Africa ... 277 Table 93. Comparison of R2 between Level-2 Teacher Background and Foundational Level-1
Model for South Africa ... 279 Table 94. Parameter Estimates for the Combined School Background Model for South Africa ... 280 Table 95. Comparison of R2 between Model 22 and Previously Constructed Models 9 and 19-21
for South Africa ... 280 Table 96. Parameter Estimates for Full Model for South Africa ... 282 Table 97. Comparison of R2 between Model 22 and Previously Constructed Models 9 and 19-21
viii
LIST OF FIGURES
Figure 1. Flowchart for managing multiple databases from TIMSS 2003 ... 123
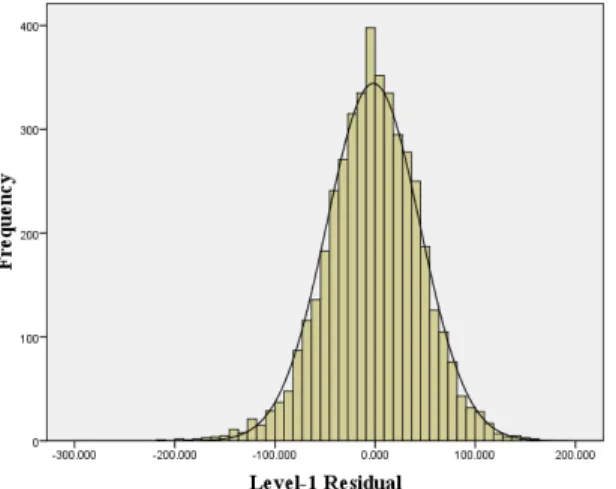
Figure 2. Histogram for level-1 residuals for USA ... 137
Figure 4. Histogram for level-2 intercept residuals for USA ... 138
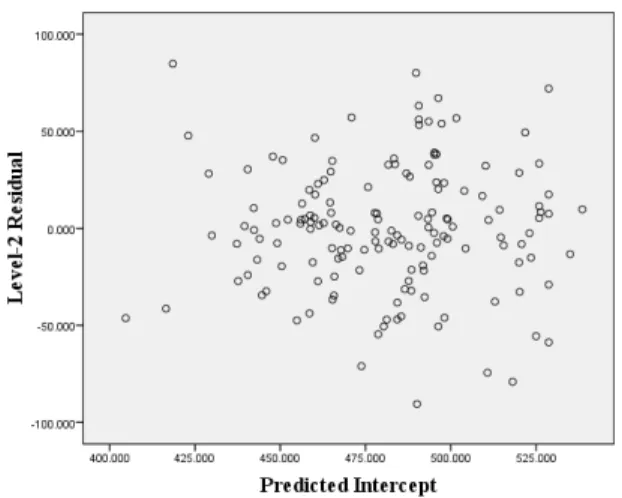
Figure 5. Level-2 intercept residuals by predicted intercept for USA ... 139
Figure 6. Histogram for level-2 slope (valuing math) residuals for USA ... 139
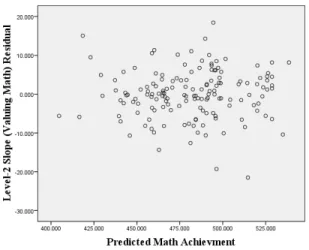
Figure 7. Level-2 slope (valuing math) residuals by predicted math achievement for USA ... 140
Figure 8. Histogram for level-2 slope (time on homework) residuals for USA ... 140
Figure 9. Level-2 slope (time on homework) residuals by predicted math achievement for USA ... 141
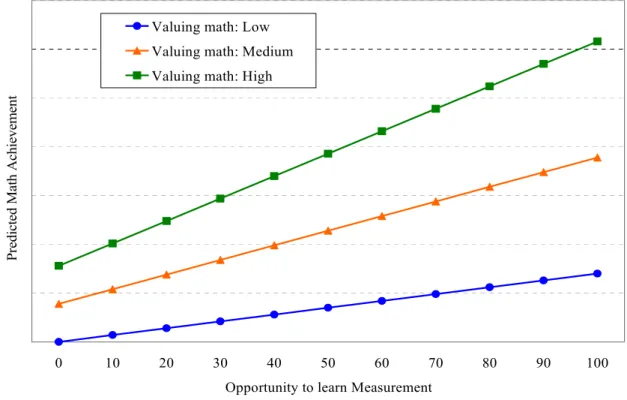
Figure 10. Interaction between valuing of math and opportunity to learn measurement for USA ... 155
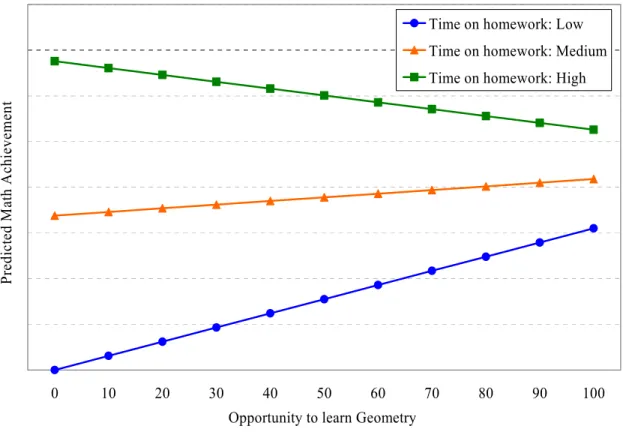
Figure 11. Interaction between time student spent on homework and opportunity to learn geometry for USA ... 156
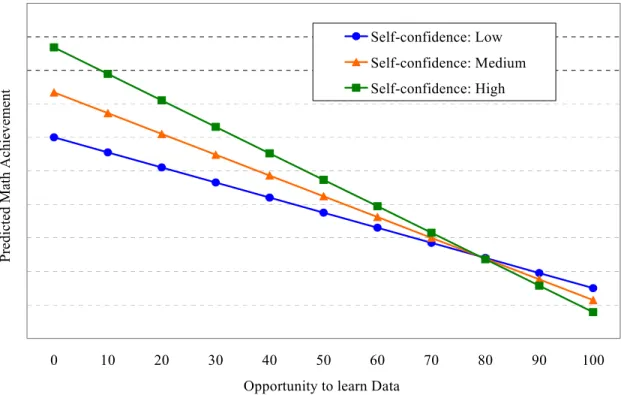
Figure 12. Interaction between self-confidence in learning math and opportunity to learn data for USA ... 157
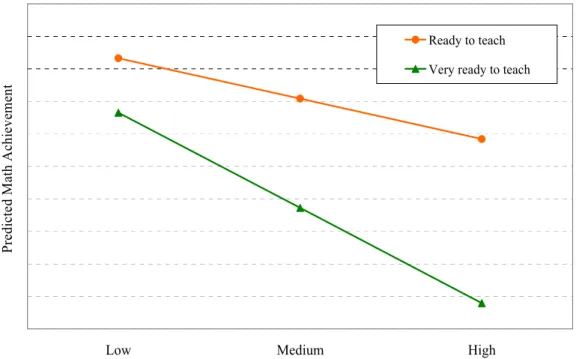
Figure 13. Interaction between time student spent on homework and teacher reported readiness to teach number for USA ... 163
Figure 14. Interaction between class size for math instruction and self-confidence in learning math for USA ... 168
Figure 15. Interaction between class size for math instruction and valuing of math for USA ... 169
Figure 16. Interaction between opportunity to learn geometry by time student spent on homework for USA ... 172
Figure 17. Interaction between teacher reported ready to teach number by time student spent on homework for USA ... 173
Figure 18. Histogram for Level-1 residuals for Canada ... 179
Figure 19. Level-1 residuals by predicted math achievement for Canada ... 179
Figure 20. Histogram for level-2 intercept residuals for Canada ... 180
Figure 21. Level-2 intercept residuals by predicted intercept for Canada ... 180
Figure 22. Histogram for level-2 slope (gender) residuals for Canada ... 181
Figure 23. Level-2 slope (gender) residuals by predicted math achievement for Canada ... 181
Figure 24. Histogram for Level-2 slope (extra lessons) residuals for Canada ... 182
Figure 25. Level-2 slope (extra lessons) residuals by predicted math achievement for Canada ... 182
Figure 26. Histogram for level-2 slope (self-confidence) residuals for Canada ... 183
Figure 27. Level-2 slope (self-confidence) residuals by predicted math achievement for Canada ... 183
Figure 28. Interaction between average math instructional hours per year and gender for Canada ... 198
Figure 29. Interaction between opportunity to learn algebra and extra math lessons for Canada ... 199
Figure 30. Interaction between opportunity to learn geometry and extra math lessons for Canada ... 200
Figure 31. Interaction between opportunity to learn data and self-confidence for Canada ... 201
Figure 32. Interaction between opportunity to learn measurement and self-confidence for Canada ... 202
Figure 33. Interaction between teacher reported preparation to teach math and student self-confidence in learning math for Canada ... 207
Figure 34. Interaction between types of math-related professional development and student self-confidence in learning math for Canada ... 208
Figure 35. Interaction between average math instructional hours per year and gender for Canada ... 216
Figure 36. Interaction between teacher reported preparation to teach math content and student self-confidence in learning math for Canada ... 217
Figure 37. Interaction between opportunity to learn data and gender for Canada ... 218
Figure 38. Interaction between opportunity to learn data and self-confidence in learning math for Canada ... 219
Figure 39. Interaction between opportunity to learn geometry and extra math lessons for Canada ... 220
ix
Figure 41. Histogram for level-1 residuals for Egypt ... 227
Figure 42. Level-1 residuals by predicted math achievement for Egypt ... 227
Figure 43. Histogram for level-2 intercept residuals for Egypt ... 228
Figure 44. Level-2 intercept residuals by predicted intercept for Egypt ... 228
Figure 45. Histogram for level-1 residuals for South Africa ... 253
Figure 46. Level-1 residuals by predicted math achievement for South Africa ... 253
Figure 47. Histogram for level-2 intercept residuals for South Africa ... 257
Figure 48. Level-2 intercept residuals by predicted intercept for South Africa ... 257
Figure 49. Histogram for level-2 slope (extra lessons) residuals for South Africa ... 258
Figure 50. Level-2 slope (extra lessons) residuals by predicted math achievement for South Africa ... 258
Figure 51. Interaction between opportunity to learn data and student self-confidence in learning math in South Africa ... 270
x
Correlates of Mathematics Achievement in Developed and Developing Countries: An HLM Analysis of TIMSS 2003 Eighth-Grade Mathematics Scores
Ha T. Phan ABSTRACT
Using eighth-grade mathematics scores from TIMSS 2003, a large-scale
international achievement assessment database, this study investigated correlates of math achievement in two developed countries, Canada and the United States and two
developing countries, Egypt and South Africa. Variation in math achievement within and between schools for individual countries was accounted for by a series of two-level HLM models. Specifically, there were five sets of HLM models representing student
background, home resources, instructional practices, teacher background, and school background related factors. In addition, a final model was built by including all the statistically significant predictors in earlier models to predict math achievement. Findings from this study suggested that whereas the instructional practices model worked the best for the United States and the teacher background model served as the most efficient and parsimonious model for predicting math achievement in Egypt, the final model served as the best model for predicting math achievement in Canada and South Africa. These findings provide empirical evidence that different models are needed to account for factors related to achievement in different countries. This study, therefore, highlights the importance that policy makers and educators from developing countries should not base their educational decisions and educational reform projects solely on research findings of
xi
developed countries. Rather, they need to use their country-specific findings to support their educational decisions. This study also provides a methodological framework for applied researchers to evaluate the effects of background and contextual factors on students’ math achievement.
1
CHAPTER ONE INTRODUCTION Statement of Problem
Students’ mathematics achievement is often associated with the future economic power of a country (Baker & LeTendre, 2005; Bush, 2001; Heyneman & Loxley, 1982, 1983; Wobmann, 2003). Thus, the desire to understand and identify factors that may have meaningful and consistent relationships with math achievement has been commonly shared among national leaders and policy makers as well as educators around the world. For example, in 2007, there were more than 60 countries participating in the Trends in International Mathematics and Science Study (TIMSS) (TIMSS, 2007). By
collaboratively supporting and participating in a large-scale international achievement study such as the TIMSS, it was hoped that the rich data (achievement and other contextual data) collected from such a study could illuminate important correlates of math achievement both within and between countries that would “otherwise escape detection” (Wagemaker, 2003, p.1).
Unfortunately, despite the fact that data from these international achievement studies have been made publicly available for all participating countries [National Center for Education Statistics (NCES), 2007] only a small number of these countries was included in subsequent research studies. A review of existing literature suggested that low income countries as well as those that performed poorly in international achievement studies such as South Africa, Chile, and Egypt were rarely included in international
2
research studies (details of these studies are provided in Chapter Two). In contrast, researchers tended to focus on a small group of developed and high-performing countries such as Japan, Korea, Hong Kong, Singapore, Germany, Canada, and the United States. Such bias in international achievement research resulted in recent research findings related to students’ math achievement that were based mostly on students in developed countries and lacking representation from developing countries. As a consequence, the problem of lacking research findings related to students’ math achievement in developing countries has led many of these countries to base their educational policy decisions or even to implement educational reform projects on research findings and educational models of other developed countries (Riddell, 1997). Such bases were problematic because countries differ in characteristics and a model that worked in a developed country might not work in a developing country (Bryan et al., 2007; Delaney, 2000; Watkins & Biggs, 2001).
Given the current problem, it is very important for research studies related to international achievement to include a more diverse sample of countries (i.e., both developing and developed countries) and to utilize analytic models that yield country-specific research findings. In doing so, policy makers and educators from the developing countries that were included in these studies can use the research findings pertaining to their own countries to support their educational decisions.
Purpose of the Study
The purpose of this study was to investigate correlates of math achievement in both developed and developing countries. Specifically, two developed countries and two developing countries that participated in the TIMSS 2003 eighth-grade math assessment
3
were selected for this study. For each country, a series of two-level models was constructed using background and contextual factors at both the student and the classroom/teacher/school levels to account for the variance in eighth-grade students’ math achievement within and between schools. Ultimately, this study aimed to produce country-specific research findings related to eighth-grade students’ math achievement that can be used directly by national leaders and policy makers as well as educators from these countries, especially developing countries, to support their educational decisions. Finally, by visually and descriptively examining patterns of relationships between eighth-grade math achievement and contextual factors, this study hoped to identify important trends of relationships that tended to exist among developed and developing countries, as well as differences between these groups.
Research Questions
The study aimed to address the following set of research questions:
1) To what extent are student background variables (i.e., gender, self-confidence in learning math, valuing of math, time on math homework, and tutoring in math) associated with TIMSS 2003 eighth-grade math scores in each country? 2) To what extent are home resources variables (i.e., availability of calculator,
computer, and desk for student use) associated with TIMSS 2003 eighth-grade math scores in each country?
3) To what extent are instructional variables (i.e., opportunity to learn, activities in math lessons, amount of homework assignment, and instructional time) associated with TIMSS 2003 eighth-grade math scores in each country?
4
4) To what extent are teacher-related variables (i.e., preparation to teach, ready to teach, and professional development) associated with TIMSS 2003 eighth-grade math scores in each country?
5) To what extent are school-related variables (i.e., class size, school resources for math instruction, and math instructional limitation) associated with TIMSS 2003 eighth-grade math scores in each country?
Rationale for the Study
Several factors influenced the decision to use the TIMSS 2003 eighth-grade math data from four countries to investigate the relationships between student math achievement and contextual as well as background factors across countries in this study. First, mathematics was the subject of choice because of the increasingly national and international focus on math education (Baker & LeTendre, 2005; Bush, 2001; Heyneman & Loxley, 1982, 1983; Wobmann, 2003). In the United States, the topic of how to
improve student achievement in math has been hotly debated for decades. The No Child Left Behind Act issued by President George W. Bush in 2001 [No Child Left Behind (NCLB) 2001] was one of the many examples that highlighted the importance of math as a school subject that has attracted attention from the country’s top national leader.
Second, at the time this study was conducted, the TIMSS 2003 database provided the largest and most ambitious set of international achievement as well as background data related to students’ math and science achievement at fourth-grade, eighth-grade and twelfth-grade (TIMSS, 2003). In addition, the influence of previous TIMSS findings on international education, including the U.S. education, has been widely acknowledged. As indicated in the Benchmarking Introduction of the Trends in
5
International Math and Science Study (TIMSS, 1999), “TIMSS results, which were first reported in 1996, have stirred debate, spurred reform efforts, and provided important information to educators and decision makers around the world” (p.16). In fact, the United States Department of Education (USDOE), through its federal entity, the National Center for Education Statistics (NCES), strongly encouraged educational researchers to use large-scale existing secondary data such as the TIMSS 2003 for research because these data “provide consistent, reliable, complete, and accurate indicators of education status and trends” (Stigler et al., 1999, p.1).
Third, eighth-grade math data were selected because of the importance of the transition period from elementary school to high school, where curriculum
differentiation in math knowledge and skills is the greatest (Rodriguez, 2004). Also, as Reynolds (1991) asserted, middle-school years are a critical period for students in terms of learning math. How well students perform in math during their middle-school years is likely to determine their choices and enrollment in high school math courses. This is because courses in math are often sequential and therefore, access to advanced math courses in high school are dependent on students’ success at lower level math courses at middle school (Singh, Grandville, & Dika, 2002). For example, if a student performs poorly in algebra at eighth-grade, he/she is much less likely to enroll in various math courses offered in high school. As a result, these curricular opportunities and choices further influence students’ decision to enter mathematics-related fields of study at postsecondary and occupational levels. Thus, eighth-grade is an important time point to study the complex interaction of contextual factors that are potentially related to
6
Last but not least, four countries (two developing countries and two developed countries) were sufficient for this study because this selection allowed the study to be conducted within a reasonable amount of time and resources while satisfying the important inclusion criterion of sufficient sample size and representative samples from each category of country (i.e., developing and developed countries).
Theoretical Framework
This research study was guided by the theoretical framework of Carroll’s (1963) Model of School Learningwhich was proposed to explain why students succeed or fail in their learning at school (Carroll, 1963). The model postulated five important factors that were theoretically related to students’ success in learning: (1) Aptitude – the amount of time needed to learn the task under optimal instructional conditions, (2) Ability to understand instruction, (3) Perseverance – the amount of time the learner is willing to engage actively in learning, (4) Opportunity to learn – time allowed for learning, and (5) Quality of instruction – the extent to which instruction is presented so that no additional time is required for mastery beyond that required in regard to aptitude. Of these five factors, aptitude, ability to understand instruction, and perseverance are related to the students; whereas opportunity to learn and quality of instruction are concerned with external conditions. A thorough examination of Caroll’s (1963) model of school learning and a comprehensive review of existing literature related to each of the five factors of the model are presented in Chapter Two.
Limitations
The potential threats to the internal and external validity of this study are present at various research stages: instrument development, data collection, data analysis, and
7
data interpretation. At the instrument development stage, the process of test adaptation and translation from the source language (i.e., English) to other target languages of the test could have made the assessment unintentionally harder or easier by translators (Hambleton, Merenda, & Spielberger, 2005). As with test item format, Wang (2001) raised a concern that students from some countries might be more familiar with test items in the constructed response format; whereas their peers in other countries might be more familiar with test items in the multiple choice format. Thus, such instrument-related issues could negatively influence the fairness of student mathematics test scores.
At the data collection stage, any discrepancies in the process of collecting TIMSS 2003 data across countries could affect the validity of the data. Because TIMSS 2003 collected data on a large-scale (i.e., in 48 countries), from multiple sources (i.e., from students, teachers, and school principals), and on different time schedules (i.e., in October and November for Southern Hemisphere countries and in April, May and June for
Northern Hemisphere countries) the process of monitoring data quality could be challenging. In addition, due to country differences, some countries opted not to administer certain test or questionnaire items to their participants, resulting in some countries having no data for a set of variables (TIMSS, 2003).
At the data analysis stage, the massive amount of missing data due to sampling procedures (i.e., multistage, stratified, and unequal probability), assessment design (each student took only one test booklet or a subset of the entire test items), and non-responses from participants could negatively affect accuracy of statistical results, regardless of missing data treatment methods (imputation of missing data or deleting all missing data).
8
Finally, the threats to validity of the study at the data interpretation stage could stem from the variation in operationalization of the same constructs among participants and across countries. For example, for some teachers, classroom activities included working on homework; whereas for other teachers, classroom activities were restricted to only school work. Similarly, instructional time could be defined as actual teaching time in some countries and as teaching time and class management in other countries. Last but not least, the results of this study are based on the relationship between student
mathematics test data and contextual data which were self-reported by students, teachers, and school principals. Self-reported data, according to Rosenberg, Greenfield, and Dimick (2006), have several potential sources of bias such as selective memory
(remembering or not remembering experiences or events that occurred sometime in the past), telescoping (recalling events that occurred at one time as if they had occurred at another time), and social desirability (reporting behaviors that tend to be widely accepted by certain social groups rather than the behaviors actually exhibitted by the respondents). Thus, it is important to interpret findings of this study in light of these limitations.
Definitions
Developed country: According to the World Bank’s (2007) world development
indicators, developed countries refer to countries with high-income economies. The use of the term, developed country, however, is not intended to imply that developed economies have reached a preferred or final stage of development (The World Bank, 2007).
Developing country: According to the World Bank’s (2007) world development
9
economies. The use of the term, developing country, however, is not intended to imply that all economies in the group are experiencing similar development (The World Bank, 2007).
Math achievement: For this study, math achievement is defined as the overall
mathematics scores of eighth-grade students who participated in the TIMSS 2003 assessment. The overall mathematics scores can be computed by averaging students’ scores on five mathematics domain contents: algebra, number, data, geometry, and measurement.
Eighth-grade students: In the TIMSS study, eight-grade students are defined as all
students enrolled in the upper of the two adjacent grades that contained the largest proportion of 13-year old students at the time of testing (TIMSS, 2003).
10
CHAPTER TWO LITERATURE REVIEW
Introduction
In this chapter, the literature review is presented in six major sections: history of international mathematics achievement assessments, theoretical framework, student-related factors and student achievement, instructional practices-student-related factors and student achievement, teacher background-related factors and student achievement, and school background-related factors and student achievement. Finally, the chapter concludes with a summary of significant findings synthesized from this comprehensive literature review.
In broadening the scope of this literature review, the literature search was open to various student achievement outcomes such as math, science, reading, literacy, and civics. Also, empirical studies that examined student achievement outcomes at different grade levels (e.g., kindergarten to grade 12) and across countries were included in the review. It is important to note, however, that although the current literature search allowed for a broad inclusion of empirical studies related to student achievement, where possible, this synthesis of literature focused more on student mathematics achievement at middle school grades within the United States and across countries. The rationale for this selection focus was specified in Chapter One.
History of International Mathematics Achievement Assessments Although the beginning of internationalism in education might be traced to “ancient times” the idea of conducting an official, large-scale international achievement
11
study did not emerge until after World War II (Encyclopedia of Educational Research [EER], 1960, p. 618). In fact, the first large-scale international achievement assessment, Pilot Twelve-Country Study, was developed in 1959 with extensive support from the United Nations Educational, Scientific and Cultural Organization (UNESCO) (EER, 1960). With the Pilot Twelve-Country Study, UNESCO aimed to promote the conviction that “educational systems cannot be transferred from one country to another, but ideas, practices, and devices developed under one set of conditions can always prove suggestive for improvement even where the conditions are somewhat different” (EER, 1960, p. 621).
The Pilot Twelve-Country Study was originally constructed in French, English and German and then translated into eight languages by individual participating countries. The test was administered in 1961 to representative samples of 13-year-old students across the 12 countries, including Belgium, England, Finland, France, Federal Republic of Germany, Israel, Poland, Scotland, Sweden, Switzerland, United States and Yugoslavia. This study assessed students’ achievement in five subject areas:
mathematics, reading comprehension, geography, science and non-verbal ability. In addition, the test had two specific aims: (1) to investigate whether some indications of the intellectual functioning could be deduced from the patterns of student responses across countries; and (2) to discover the possibilities and the difficulties attending a large-scale international study (Forshay et al., 1962).
The success of the first large-scale international achievement assessment shed new light on international education. As Forshay (1962) put it, “If custom and law define what is educationally allowable within a nation, the educational systems beyond one’s national boundaries suggest what is educationally possible” (p. 7). Within approximately
12
50 years of development, 29 large-scale international achievement assessments were conducted, covering a vast array of subject areas including Math, Science, Reading, English, Literature Education, English as a Foreign Language, French as a Foreign Language Education, Writing, and Civic Education (International Association for the Evaluation of Educational Achievement [IEA], 2007; International Assessment of Education Progress [IAEP]; Organization for Economic Co-operation and Development [OECD], 2007). The target populations of these assessments were also expanded to students of fourth, eighth, and twelfth grades in all countries.
The popularity of international achievement assessments was also reflected through the increasing number of participating countries over the years. By decade, the largest number of countries participating in an international achievement assessment increased from 12 in the 1960s, to 19 in the 1970s, to 24 in the 1980s, to 46 in 1990s and 60 in 2000s (IEA, 2007). These powerful numerical indicators suggest that international achievement assessments have quickly gained special attention in education across countries.
Importance of International Mathematics Achievement Assessments A review of the history of international achievement assessments yielded an interesting finding. Of the 29 international achievement assessments conducted by IEA, 13 were mathematics assessments (IEA, 2007). In fact, since 1995, the Trends in
International Mathematics and Science Study(TIMSS) has been implemented regularly, on a four-year cycle basis (TIMSS, 2007). It is worth noting that the number of countries participating in the TIMSS has also grown significantly over time. In the most recent administration of the TIMSS in 2007, more than 60 countries participated in the study,
13
making it the largest and most ambitious international achievement study in the history of international achievement assessments.
Why have international mathematics achievement assessment attracted more attention from countries around the world? The chief reason behind the importance of international mathematics achievement assessment is not new and has been discussed for decades. Much research has linked student mathematics achievement with the future economic power as well as security of a country (Akiba, LeTendre, & Scribner, 2007; Baker & LeTendre, 2005; Carter & O'Neill, 1995; Heyneman & Loxley, 1982, 1983; Wobmann, 2003). For this reason, the differences in student mathematics achievement across countries were often interpreted as a national issue rather than a mere comparison of student achievement. For example, in the United States, it was not uncommon for national leaders to address the issue of students’ poor performance in international mathematics assessments in the national agendas (see the nation’s response to Sputnik crisis in the 1960s [EER, 1960], to A Nation at Riskin 1983 [National Commission on Educational Excellence, 1983] and then to Goals 2000 in 1994 [Goals 2000, 1994]). Recently, President George W. Bush, after taking office in 2001, stated: “Quality education is a cornerstone of America’s future and my Administration, and the knowledge-based workplace of the 21st century requires that our students excel at the highest levels in math and science.” (Bush, 2001, p.1,). As a result of such national addresses, a series of educational policies were issued in order to improve students’ performance in mathematics. With the current Bush’s administration, the national act of “No Child Left Behind” was implemented as a primary solution for the improvement of educational quality in the United States.
14
Across countries in the world, the concerns about what students know and can do in math as well as what can be done to improve student math ability has also been addressed at the national level (Beaton, 1998). As highlighted in the TIMSS 1999 Benchmarking report, the differences in students’ performance in international mathematics achievements were taken seriously by many countries: “TIMSS results, which were first reported in 1996, have stirred debate, spurred reform efforts, and provided important information to educators and decision makers around the world” (TIMSS 1999 Benchmarking Introduction, 1999, p.16). Results from international mathematics achievement assessments were used for many purposes, including making changes in educational policies, setting performance standards for students, comparing with and validating national mathematics assessments, and conducting various
educational research studies (Baker & LeTendre, 2005; O’Leary, 2002; Rodriguez, 2004; TIMSS, 2003).
Given the importance and profound impact of student mathematics achievement on national economic growth and security (Akiba, LeTendre, & Scribner, 2007; Baker & LeTendre, 2005; Carter & O'Neill, 1995; Heyneman & Loxley, 1982, 1983; Wobmann, 2003), and the foreseen rapid changes within and across countries in the 21st century, it is important that educational researchers across the world, collaboratively and separately, continuously conduct empirical research to identify factors associated with student mathematics achievement so as to maximize student learning in mathematics.
Theoretical Framework
In an attempt to explain why students succeed or fail in their learning at school, John B. Carroll developed A Model of School Learningin 1963 (Carroll, 1963). This
15
model proposes that the student will succeed in learning a given task to the extent that he/she actually spends the amount of time he/she needs to learn the task, with time
defined as the time during which the student actively engaged in his/her learning (Carroll, 1963). According to Carroll (1963), there are five categories of variables which are associated with student’s success in learning: (1) Aptitude – the amount of time needed to learn the task under optimal instructional conditions, (2) Ability to understand
instruction, (3) Perseverance – the amount of time the learner is willing to engage
actively in learning, (4) Opportunity to learn – time allowed for learning, and (5) Quality of instruction – the extent to which instruction is presented so that no additional time is required for mastery beyond that required in regard to aptitude (Carroll, 1963).
The five categories of variables, which can be expressed in terms of time, can be worked into a formula with degree of learning as a function of the ratio of the amount of time a student actually spends on the learning task and the total amount of time the student needs to learn the task. Thus:
⎟⎟ ⎠ ⎞ ⎜⎜ ⎝ ⎛ = needed Time spent actually Time f learning of Degree
The numerator of this fraction is equal to the smallest of the three quantities: (1) opportunity to learn, (2) perseverance, and (3) aptitude after adjustment for quality of instruction and ability to understand instruction. The last quantity, aptitude, is also the denominator of the fraction (Carroll, 1963).
Inferring from the Model of School Learning, the first three categories of
variables (i.e., aptitude, ability to understand instruction, and perseverance) are related to the students; whereas the last two categories of variables are concerned with external
16
conditions (i.e., opportunity to learn and quality of instruction). It is worthy of note, however, that of these categories of variables, opportunity to learn, quality of instruction, and perseverance are more amenable to intervention and manipulation than aptitude and ability to understand instructions which tend to be relatively resistant to change (Carroll, 1963).
Student-related Factors and Student Achievement
Students’ Gender
Evidence accumulated through multiple research studies suggest that universally, a gender gap exists in math achievement (Beaton et al., 1996; Mullis et al., 2000;
Peterson & Fennema,1985; Rodriguez, 2004). However, the size and direction of
achievement gap varies across samples of students and tests. For examples, Bielinski and Davison (2001) found that the gender gap, albeit small, favors females in elementary school, and males in high school, and neither group in middle school. In contrast,
Fennema et al. (1998) observed that the gender gap in math achievement increases during middle schools and becomes profound at the higher educational level. Generally, research findings in this area support the view that boys tend to perform better than girls on
mathematics tasks such as problems that include spatial representation, measurement, proportions as well as complex problems; whereas girls tend to score higher on
computations, simple problems and graph reading (Beaton et al., 1996). Similarly, using the Scholastic Aptitude Test (SAT) and classifying the math items into six levels of cognitive complexity (i.e., a zero was assigned to items measuring recall of factual knowledge, and a five to items requiring application of higher mental processes), Harris and Carlton (1993) reported that females outperformed males on the three lowest levels,
17
whereas males outperformed females on the two highest levels, after the total test scores were controlled. When these SAT math items were grouped into two categories, applied or real world items and abstract or text-book items, the researchers found that females outscored males in abstract items; whereas males outscored females in applied items (Harris & Carlton, 1993).
Much effort has also been devoted to investigating reasons that are associated with differences in mathematics achievement between boys and girls in schools. For example, Davis and Carr (2001) suggest that the differences in use of strategies to tackle math problems in early elementary school age girls and boys are related to their
achievement gap. Their study showed that boys are more likely to retrieve information from memory and use covert cognitive strategies, such as decomposition; whereas girls are more likely to use overt strategies such as counting on fingers or manipulative
strategies to solve mathematics problems. Test item format is another factor that has often been linked with the gender gap in math achievement. Bolger and Kellaghan (1990), for example, have shown that boys perform better than girls in multiple-choice items and girls perform relatively better than boys in open-ended items. Findings from a more recent study conducted by Wester and Henriksson (2000), however, did not support this conclusion. In fact, Wester and Henriksson (2000) found that there was no significant change in gender differences when the item format was altered. Females seemed to perform slightly better than males when using multiple-choice items. Finally, using three nationally representative achievement databases, Bielinski and Davison(2001) examined test item difficulty as a plausible reason of gender gap in math achievement. Evidence from this study suggested an association between item difficulty and sex differences.
18
That is, easy test items tended to be easier for females than males, and hard test items tended to be harder for females than males. Therefore, if a math test consists of more easy items than hard items then females will outperform males in such a test, and vice versa.
Students’ Self-confidence
Many research studies have investigated the relationship between student self-confidence in learning math and student math achievement. For example, evidence from the study of House (2006) suggested that higher self-confidence in learning math was significantly associated with higher math achievement in adolescent students. Similarly, based on a study of middle school students in Germany, Koller, Baumert and Schnabel (2001) concluded that students with higher initial levels of interest in learning math were more likely to enroll in higher math courses. Likewise, there was also evidence that self-efficacy in learning math was significantly related to math achievement in middle school students (Pajeres & Graham, 1999). It is worth noting, however, that such a clear and positive association between student self-confidence in learning math and math achievement tended to be observed more frequently within countries. At the between-country level, the relationship between student self-confidence in learning math and math achievement appeared to be more complex. For instance, whereas self-confidence in learning math was found strongly and positively related to math achievement for students in Norway and Canada, it was not the case for students in the United States (Ercikan, McCreith & Lapointe, 2005). A similar pattern of results was also reported in the study of Mullis, Martin, Gonzalez and Chrostowski (2004) where the four countries with the lowest percentages of students in the high self-confidence category (i.e., Chinese Taipei, Hong Kong SAR, Japan, and Korea) all had high average math achievement. Likewise, in
19
examining the relationship between math achievement and students’ self-perceived competence in learning math across 38 countries that participated in the TIMSS 1995, Shen and Pedulla (2000) and Shen (2002) have shown that a negative relationship between self-perceived competence in learning math and math achievement was present between countries.
In an attempt to explain such interesting patterns of relationship, Mullis, Martin, Gonzalez and Chrostowski (2004) suggested that in Asian Pacific countries, students may share cultural traditions that encourage modest self-confidence and thus, they tended to rate themselves low in self-confidence in learning math but performed high in math assessments. Congruent with this explanation were findings from a study of Leung (2002) where the researcher observed that Japanese students tended to report more often that they were not doing well in math even though they scored high on mathematics tests. The researcher attributed such interesting patterns of students’ responses regarding their level of self-confidence in learning math to the unique culture in this region of the world where the expectations for student achievement in math tend to be high (Leung, 2002).
Students’ Valuing of Learning
Students’ valuing of learning, as defined by Ma and Kishor (1997), refers to students’ affective responses to the easy or difficult as well as the importance or unimportance of a certain school subject. In existing literature, students’ valuing of learning is also referred to as students’ attitudes, or beliefs, or perceptions towards learning. Thus, statements such as “I enjoy learning math” or “I think learning math will help me in my daily life” can be defined as students’ valuing of math or students’
20
Students’ valuing of learning has often been viewed as an important determinant of student achievement. As indicated by Ma and Kishor (1997):
Teachers and other mathematics educators generally believe that children learn more effectively when they are interested in what they learn and that they will achieve better in mathematics if they like mathematics. Therefore, continual attention should be directed towards creating, developing, maintaining and reinforcing positive attitudes (p. 27)
Empirical evidence, however, has shown little consensus concerning the
relationship between students’ attitudes toward learning and student achievement. Abu-Hilal (2000), for example, asserted that students’ perceptions regarding the importance of mathematics exerted a significant effect on math achievement. Similarly, findings from the study of Beaton et al. (1996) revealed that eighth grade students with more positive attitudes had higher average mathematics achievement. In a meta-analysis study, Ma and Kishor (1997) examined 113 studies that investigated the effects of students’ attitudes on math achievement for the period from 1966 to 1993 and found that approximately 90% of the studies showed positive relationship between attitudes and achievement. The overall weighted mean effect size obtained from this meta-analysis study was 0.12, with a 95% confidence interval from 0.12 to 0.13, suggesting a positive, albeit not strong,
relationship between attitudes and math achievement. More evidence supporting
significant relationships between the value students attach to math and their achievement in math can also be found in Marsh, Hau, and Kong (2002), Rao, Moely, and Sachs (2000) and Singh, Granville, and Dika (2002).
21
Opposing this view, Shen (2002) conducted a study on the relationship between eighth grade students’ achievement and their self-perception of learning math across 38 countries that participated in the TIMSS 1995 and concluded that empirical evidence is insufficient to support the claim that attitudes and achievement are strongly related. Although the researcher did find a positive relationship between math achievement and three measures of perception (i.e., how much students like the subject, their self-perceived competence in the subject, and their self-perceived easiness of the subject) for within-country data, the between-country analysis yielded opposite findings. That is, there was a negative relationship between self-perceptions and achievement. The correlation between math achievement and how much students like mathematics cross-nationally is -.68. The two countries with the highest scores for liking math (i.e., Morocco and South Africa) were also the countries that had the poorest performance in math. When correlating students’ perceived easiness of math and math achievement across countries, a stronger negative correlation (-.72) was observed, indicating that in poor performing countries students were likely to think of math as being easy whereas in high performing countries, students were likely to think of math as being difficult. Explaining this negative pattern of relationship between math achievement and students’ self-perception, Shen (2002) suggested that this pattern might reflect low academic standards and expectations in low performing countries and high academic standards and expectations in high performing countries.
Evidence from cross-national studies of Papanastasiou (2000, 2002) also did not support the contention that positive attitude towards learning is associated with greater student achievement. Of the three countries included in Papanastasiou’s (2000) study
22
(i.e., Cyprus, the United States, and Japan) Cyprus had the highest proportion of student who reported positive or strongly positive attitudes toward learning mathematics (79% as compared to 70% for the U.S. and 51% for Japan). However, Cyprus students’ average mathematics score was the lowest among the three countries (474 as compared to 500 for the U.S. and 605 for Japan). Later, in 2002, using the TIMSS 1999 data, Papanastasiou replicated this study on the samples of students from Cyprus, Hong Kong, and the United Stated. Interestingly, the new study yielded similar results. That is, having the largest proportion of students reporting positive or strongly positive attitude towards math did not make Cypress the country with the highest average math score.
In a recent international study, House (2006) looked at the relationship between students’ attitude towards math and math achievement in the TIMSS 1995. Fourth grade students from the United States and Japan who participated in the TIMSS 1995 were included in the study. Three attitude-related variables (i.e., I enjoy learning math, math is boring, and math is an easy subject) were simultaneously entered in a multiple regression model to predict student math achievement in each country. Results from this study indicated that “I enjoy learning math” had a statistically significant positive relationship with math achievement in Japan but not in the United States. Put differently, students in Japan who earned high math scores also tended to indicate that they enjoyed learning math; whereas the same relationship was not significant when tested with the sample of United States students. The researcher, however, noted some similarity between the two countries. That is, in both Japan and the United States, “math is boring” was significantly negatively related to student math scores. Specifically, students who expressed the belief that math was boring also tended to achieve low math test scores. Although “math is an
23
easy subject” appeared to have a negative relationship with math achievement in Japan and a positive relationship with math achievement in the United States, these
relationships were not statistically significant in either of the countries.
In another international study, using the sample of Swedish eighth grade students (n = 343) participating in the TIMSS 2003, Eklof (2007) examined the relationship of
math achievement with students’ value of math, math self-concept and test-taking
motivation. In this study, value of math was a composite variable which was computed as a mean score of six indicators and ranged from 1 (strongly agree) to 4 (strongly disagree). Results of the multiple linear regression analysis suggested that altogether the three predictors explained about 31% of the variation in the student math scores. However, when the effects of math self-concept and test-taking motivation were partialled out, the relationship between value of math and math achievement for the sample was weak and negative in direction (Eklof, 2007).
Students’ Family Background
Following the Coleman report (1966) which suggested strong evidence that home background-related factors had significant effects on student learning, extensive research has been carried out, both in the United States and in other countries, to validate
Coleman’s findings (Baker, Goesling, & LeTendre, 2002; Comber & Keeves, 1973; Coleman, 1975; Heyneman & Loxley, 1982; Fuller, 1987; Suter, 2000). Home
background here refers to a vast array of factors including, but not limited to, parental education level, family socioeconomic status, family size, and home resources. Unfortunately, results from these studies shared little agreement.
24
Three studies that provided conflicting results with Coleman (1966) are Comber and Keeves (1973), Heyneman and Loxley (1982), and Fuller (1987). For the first two studies, the researchers used the same data source [i.e., IEA’s (1971) First International Science Study (FISS)] for 18 countries to examine the relationship between home- and school-related factors and student achievement in science. It is worthy of note that the 18 countries included in the study consisted of both developed and developing countries. In the study of Comber and Keeves (1973), the researchers employed a three-step data reduction process to select variables for the analysis. First, only background variables that had correlation coefficients with achievement larger than twice their standard error were considered. Second, the effects of background variables were partialed out before other teacher- and school-related variables were entered in a regression model. The resulting standardized regression coefficients were then calculated for each background variable. Finally, the standardized regression coefficient was averaged across 18 countries and those that exceeded .05 were included in subsequent analyses. Results from this study showed that across countries, teacher- and school-related variables exerted stronger positive effects on student achievement than family background variables.
Arguing that Comber and Keeves’ (1973) method for variable reduction was essentially flawed because it assumed that a background variable had to be a strong predictor of science achievement in both developed and developing countries to be included in the final analysis, Heyneman and Loxley (1992) applied a new procedure of submitting each potential variable to the same test of importance, but in each country separately. As a result, the list of variables to be included in Heyneman and Loxley’s (1992) step-wise regression analysis varied from one country to another as opposed to the
25
same list of selected variable applied uniformly to all countries in the Comber and Keeves’ (1973) study. As suggested by this study, the poorer the country in economic status, the more impact teacher and school-related variables seemed to have on student achievement.
For the third study, Fuller (1987) used data from only developing countries to investigate the association between family background and student achievement. The statistical method employed in Fuller’s (1987) study was multiple regression analysis. Results from this study revealed that in developing countries, the effects of family
background on student achievement were non-significant relative to the effects of school. In fact, Fuller (1987) found that in India the effects of school explained up to 90% of the variance in student achievement.
Contradicting with the conclusion made in the studies of Comber and Keeves (1973), Heyneman and Loxley (1982), and Fuller (1987), were findings from a more recent study of Baker, Goesling, and LeTendre (2002). Evidence from this study
suggested that the relationship between family SES, a composite variable of mother’s and father’s education level and number of books in the home and student achievement were similar across countries, regardless of national income. For this study, the results were obtained from the analysis of the TIMSS 1995 data for both eighth grade math and science using hierarchical linear modeling (HLM) technique to control for the nesting structure of the data. A total of 36 countries with both low and high economic
development status were included in the study.
Most recently, using the TIMSS 2003 eighth grade mathematics data, Mullis, Martin, Gonzalez and Chrostowski (2004) studied the association between student home
26
resources and their math achievement. Once again, their findings did not agree with those of Baker et al. (2002). In particular, Mullis et al. (2004) highlighted that in many
countries, students from homes with a range of study aids such as computer, calculator, desk, and dictionary had higher achievement in math than their peers who did not have access to such resources at home.
Students’ Time on Homework
Time student spent on homework is a key variable in Caroll’s model for school learning (Caroll, 1963) and subsequent homework studies. There is ample evidence that time on homework is positively related to students’ academic performance (Cooper, 1989a; Cooper, Lindsay, Nye, & Greathouse, 1998; Cooper & Valentine, 2001; Keith & Cool, 1992; OECD, 2001; Peterson & Fennema, 1985; Singh, Granville, & Dika, 2002). Of these studies, the work of Cooper (1989a) has been widely cited in existing literature. Cooper (1989a) reviewed approximately 120 studies on the effects of homework
conducted between 1962 and 1987 which tended to fall in one of the two types of research designs: experimental and quasi-experimental.
In the 50 studies that specifically examined the relationships between time on homework and academic achievement, Cooper (1989a) noted that time spent on homework was operationalized as time spent on homework per week. Regarding achievement measure, the majority of these studies used standardized tests (33 studies), some used class grades (7 studies) and some used other outcome measures such as motivation to learn (10 studies). Statistical methods employed in these studies included structural equation modeling, path analysis, and repeated measures ANOVA. As a result of this comprehensive review, Cooper (1989a) concluded that most research showed a