Discussion
Papers
Statistics Norway Research department No. 774•
March 2014Tarjei Havnes and Magne Mogstad
Is universal child care leveling the
playing field?
Discussion Papers No. 774, March 2014 Statistics Norway, Research Department
Tarjei Havnes and Magne Mogstad
Is universal child care leveling the playing field?
Abstract:
We assess the case for universal child care programs in the context of a Norwegian reform which led to a large-scale expansion of subsidized child care. We use non-linear difference-in-differences methods to estimate the quantile treatment effects of the reform. We find that the effects of the child care expansion were positive in the lower and middle part of the earnings distribution of exposed children as adults, and negative in the uppermost part. We complement this analysis with local linear regressions of the child care effects by family income. We find that most of the gains in earnings associated with the universal child care program relate to children of low income parents, whereas upper-class children actually experience a loss in earnings. In line with the differential effects by family income, we estimate that the universal child care program substantially increased
intergenerational income mobility. To interpret the estimated heterogeneity in child care effects, we examine the mediating role of educational attainment and cognitive test scores, and show that our estimates are consistent with a simple model where parents make a tradeoff between current family consumption and investment in children. Taken together, our findings could have important
implications for the policy debate over universal child care programs, suggesting that the benefits of providing subsidized child care to middle and upper-class children are unlikely to exceed the costs. Our study also points to the importance of universal child care programs in explaining differences in earnings inequality and income mobility across countries and over time.
Keywords: universal child care, child development, non-linear difference-in-differences, heterogeneity, quantile treatment effects, income mobility
JEL classification: J13, H40, I28, D31
Address: Tarjei Havnes Univ of Oslo, ESOP & Statistics Norway. E-mail: Tarjei.Havnes@ssb.no Magne Mogstad University of Chicago, Statistics Norway & ESOP.
Discussion Papers comprise research papers intended for international journals or books. A preprint of a Discussion Paper may be longer and more elaborate than a standard journal article, as it may include intermediate calculations and background material etc.
© Statistics Norway
Abstracts with downloadable Discussion Papers in PDF are available on the Internet:
http://www.ssb.no/en/forskning/discussion-papers http://ideas.repec.org/s/ssb/dispap.html
3
Sammendrag
I 1975 vedtok Stortinget den nye barnehageloven, og i årene som fulgte økte antallet barn som gikk i barnehage dramatisk. Fra 1976 til 1979 økte dekningsgraden fra om lag 10 til 28 prosent for barn mellom tre og seks år. Overføringer på 230 millioner kroner til barnehager i statsbudsjettet for 1975 ble økt til om lag 700 millioner i 1977. Fordi den raske og store utbyggingen skjedde med ulik takt i ulike kommuner, gir dette oss en unik mulighet til å vurdere hvordan effektene av universell
barnehage varierer i befolkningen.
I denne studien følger vi barna som vokste opp i perioden fram inn i voksen alder for å evaluere hvorvidt universelle barnehager bidrar til å jevne ut forskjeller. Vi ser på endringen i fordelingen av inntekt målt i 30-årene fra barn som var akkurat for gamle til å få utbytte av utbyggingen til barn som var akkurat unge nok til å kunne få utbytte av den. Deretter utnytter vi at det var stor variasjon i hvor raskt kommunene bygde ut. Hvis inntektsveksten på et gitt punkt i fordelingen er større i kommuner som bygde ut barnehager enn i kommuner som ikke bygde ut, peker dette mot at barnehagene har hatt en positiv effekt på inntekten her. Ved hjelp av denne såkalte forskjeller-i-forskjeller-metoden tar vi altså hensyn til forskjeller mellom barna som ikke kan observeres. Ved hjelp av de omfattende norske registrene tar vi i tillegg hensyn til forskjeller mellom barna som kan observeres, som kjønn og foreldrenes utdanning og inntekt.
Vi finner at introduksjonen av barnehage har bidratt til å presse sammen inntektsfordelingen, først og fremst ved å øke lave og vanlige inntekter, men også til dels ved å presse ned de høyeste inntektene. Vi supplerer analysen av selve inntektsfordelingen med lokale lineære regresjoner av barnets inntekt på familiens inntekt da barnet var i barnehagealder. Vi finner at gevinstene fra barnehage er
konsentrert hos barn fra familier med lav inntekt, mens barn fra familier med høyere inntekter opplever et visst tap i inntekt. I tråd med disse resultatene estimerer vi at utbyggingen av barnehager økte den intergenerasjonelle inntektsmobiliteten. For å forstå mekanismene bak effektene, analyserer vi også hvordan barnehageutbyggingen påvirket barnas utdanning og kognitive prestasjoner.
Resultatene er konsistente med en enkel modell der familier gjør en avveining mellom familiens forbruk i dag og investeringer i barn for framtiden.
Studien viser at barnehage kan ha betydelige gevinster for barn, men at disse gevinstene ser ut til å være konsentrert hos barn fra lavere sosioøkonomisk bakgrunn. I sum tyder dette på at fordelene ved universelle barnhageordninger neppe overstiger kostnadene for barn fra bedre økonomiske kår. Vår studie peker også på at universelle ordninger for barnepass kan bidra til å forklare forskjeller i inntektsulikhet og -mobilitet mellom land og over tid.
1
Introduction
What is the case for universal child care programs? This question is important for both policy and scientific research. In the United States, most child care is provided by the private market, and publicly subsidized child care (or preschool) is predominantly targeted at low income families or single parents. An alternative model is supplied by the universal public programs found in Canada and the Scandinavian countries where all children are eligible for subsidized child care, regardless of family background. Many developed countries currently consider a move towards a universal child care program.1 Critics of such a move argue that society should focus its investment on children from low income families, where returns are likely to be greatest; extending subsidized child care to middle and upper-class children may require a considerable increase in taxes, at the cost of economic efficiency. Proponents of universal programs counter that even if returns are greater for the poor, publicly subsidized child care may still have benefits for middle or upper-class children that exceed its costs.
The challenge in assessing the case for universal child care programs is that the direct evidence on the impact of these policies is scarce. Perhaps as a consequence, the case for universal programs is often made drawing on evidence from targeted programs, suggesting that early childhood interventions can generate learning gains in the short-run and improve the long-run prospects of children from poor families.2 As emphasized by Baker
(2011), using the evidence from targeted programs for the promotion of universal ones is problematic for a number of reasons. First, the widely cited targeted programs offer levels of education and care that are typically not found in programs for all children. Therefore, it is not clear that universal child care can deliver similar benefits to disadvantaged children. Second, even if universal programs could offer similar levels of care and education, it may be that the benefits for middle or upper-class children do not exceed the costs.
In this paper, we examine the case for universal child care programs. Our context is a reform from late 1975 in Norway, which led to a large-scale expansion of subsidized child care. All children 3–6 years old were eligible regardless of their parents’ employment and marital status, and available child care slots were in general allocated according to length of time on the waiting list. The reform we study led to a staged expansion of subsidized child care, across Norway’s more than 400 municipalities. To control for unobserved differences between children born in different years as well as between children from treatment and comparison municipalities, we use a difference-in-differences (DiD)
1For example, the European Union’s Presidency formulated in 2002 as a policy goal “to provide child care by 2010 to at least 90 % of children between 3 years old and the mandatory school age and at least 33 % of children under 3 years of age” (EU, 2002, p. 13).
2The Perry Preschool and Abecedarian programs are commonly cited examples of how high-quality preschool services can improve the lives of disadvantaged children. See Barnett (1995) and Karoly et al. (2005) for surveys of the literature. We refer to Baker (2011) for examples of how policy documents draw on the evidence base for targeted programs to promote universal child care programs.
identification that exploits the temporal and spatial variation in child care coverage induced by this staged expansion. Roughly speaking, we compare the adult outcomes for 3 to 6 year olds before and after the reform, from municipalities where child care expanded a lot and municipalities with little or no increase in child care coverage. As described in detail below, subsidized child care both before the reform and during the expansion was severely rationed, with informal care arrangements (such as friends, relatives, and unlicensed care givers) servicing the excess demand. In our analysis, we will focus on the years immediately after the reform, when child care coverage increased from 10 % to 28 %, which likely reflects the abrupt slackening of constraints on the supply side caused by the reform, rather than a spike in local demand. We have found no other reforms or changes taking place in this period which could confound our estimated child care effects. Nevertheless, to increase our confidence in the empirical strategy, we perform a number of specification checks.
We begin by using non-linear DiD methods to estimate how the child care reform affected the earnings distribution of exposed children as adults. The estimated quantile treatment effects (QTE) allow us to assess the impact of the universal child care program on the lower, middle and upper part of the earnings distribution. We complement the QTE estimates with local linear regressions of the reform effects by family income. The local linear regression estimates quantify the effects of the universal child care program on the outcomes of middle and upper-class children as compared to children of lower-class parents. Lastly, we examine how the child care reform affected intergenerational income mobility. These results inform us about whether the universal child care program improved social mobility by attenuating the link between family background and children’s outcomes.
We find that mean impacts in the population of children as a whole miss a lot, concealing major heterogeneity in the effects of the child care reform. This is an important observation since previous empirical studies of universal child care have focused on mean impacts. While the reform had a small and insignificant mean impact on earnings, QTE-estimates are positive in the lower and middle part of the earnings distribution and negative in the uppermost part. The local linear regression estimates show that most of the gains in earnings associated with the universal child care program relate to children of low income parents, whereas upper-class children actually experience a loss in earnings because of the program. In line with the differential effects by family income, we find that the child care reform substantially reduced the intergenerational income elasticity. We show that the estimated heterogeneity in child care effects is consistent with a simple model where parents make a tradeoff between family consumption today and investment in children.
To clarify the nature of the relationship between the child care reform and the earnings of exposed children as adults, we examine the mediating role of educational attainment and cognitive test scores. We find a positive mean impact of the universal child care program on educational attainment. Most of the growth in educational attainment stems
from a substantial increase in the likelihood of completing high school. The increase in educational attainment is driven largely by children of low income parents, while there is no change in schooling levels of upper-class children. We find no reform effect on children’s scores on cognitive tests. All our QTE estimates on test scores are close to zero, and they are sufficiently precise to rule out any economically relevant effect. The absence of a change in cognitive test scores points to the importance of non-cognitive skill development to understand the long-run effects of universal child care.3
Our study is related to a small but growing literature on universal or large-scale child care programs.4 Researchers have examined the effect of these programs on several
measures of child outcomes. While these papers make important contributions to the evidence base on universal child care policy, there is no consensus across studies (for a review, see Baker, 2011). Consider the research most closely related to our study. Baker, Gruber, and Milligan (2008) and Lefebvre, Merrigan, and Verstraete (2008) analyze the introduction of subsidized, universally accessible child care in Quebec. The fact that pre-reform subsidies were targeted at low-income families implies that the policy change primarily affected middle and high income families. Baker, Gruber, and Milligan (2008) find negative mean impacts on indices of behaviour, while Lefebvre, Merrigan, and Verstraete (2008) report negative mean impacts on cognitive test scores. Datta Gupta and Simonsen (2010) exploit variation across municipalities in Denmark in access to center based care. They find that, compared to home care, being enrolled in center-based care at age three does not lead to significant differences in child outcomes at age seven. Havnes and Mogstad (2011b) examine the child care reform from late 1975 in Norway, reporting positive mean impacts on educational attainment and labor force participation.5
Our paper expands and clarifies this prior literature in several important ways. First, our findings suggest the effects of subsidized child care vary systematically across the outcome distribution, and that children of low income parents seem to be the primary beneficiaries. These findings could have important implications for the case for universal child care programs, since the benefits of providing subsidized child care to middle and upper-class children are unlikely to exceed the costs. Second, we are able to look at a broad range of child outcomes over time. This allows us to examine how the child care reform
3Evidence from targeted programs shows that even though cognitive test score advantages for children with preschool experiences tend to fade out as they go through school, the early interventions have large payoffs in educational attainment and the labor market because of improvements in non-cognitive skills (see e.g. Heckman and Masterov (2007)).
4There is also a growing body of evidence on pre-school programs that extend primary school to younger ages. This literature is reviewed in Baker (2011).
5Further evidence from Norway is provided by Black, Devereux, Løken, and Salvanes (2012), who show a positive impact of a price subsidy to child care on children’s school performance. By comparison, Herbst and Tekin (2008) find negative effects on children’s test scores of a price subsidy to child care in the United States. Since Black, Devereux, Løken, and Salvanes find little if any effect on child care utilization and parental labor force participation, they interpret their results as reflecting shocks to income, through child care subsidies. As a result, this study is more about the impact of cash transfers to low income families than about the effects of child care expansions.
may have affected the labor outcomes of exposed children as adults, by considering impacts on educational attainment and cognitive test scores. An advantage of our measures of long-run outcomes is that we get round the issues of whether short-run impacts of child care persist, and perhaps are amplified, over time.6 Third, we are able to hone in on the
counterfactual to subsidized child care because there is no evidence of crowding out of maternal care and there is little change in family income. This helps us interpret the expansions to subsidized child care as increases in the amount of time spent in the child care center versus informal care (including relatives and nannies).
Our study also points to potential explanations for the mixed evidence in previous studies of universal child care programs. Our theoretical framework predicts that the introduction of subsidized child care equalizes the outcome distribution of children, while there are no unambiguous predictions about the mean impact. If child care quality is a normal good, we expect a negative correlation between the effects of universal child care policy and family income. This could, for example, help in explaining the negative mean impacts of the child care reform in Quebec, which primarily affected middle and high income families. Differential effects both across different studies and across the outcome distribution in a given study, may operate through differences in child care take-up and differences in the impacts of uptake (depending on the quality of the child care center and the counterfactual form of care). Distinguishing empirically between these two sources to heterogeneity would be interesting, but requires data we do not have and an assumption about the policy not shifting the ranks of children in their potential outcome distribution (see Heckman, Smith, and Clements, 1997).
Another contribution of our paper is to highlight the importance of universal child care programs in explaining differences in earnings inequality and income mobility across countries and over time. It is widely argued that the early years are a particularly important time for efforts to equalize opportunities, because a good deal of inequality is already apparent by the time children start school, and because children’s development may be less amenable to change after they enter school (see e.g. Almond and Currie, 2010; Heckman and Moses, 2014). But it is less clear how much policies can reduce inequality or improve social mobility, or what policies might be effective (see e.g. Black and Devereux, 2011). We show that subsidized child care could level the playing field by reducing inequality in the earnings distribution of exposed children as adults and by attenuating the persistence of income across generations.
The size and detailed nature of our data also allow us to bring new evidence on the usefulness of non-linear DiD methods in assessing policy changes, when only observational
6For example, as pointed out by Baker, Gruber, and Milligan (2008), their findings of a negative short-run impact of child care on children’s non-cognitive development, could represent an initial cost of socialization, with little or no long-run consequences. Moreover, if investments in human capital have dynamic complementarities, then even a small learning gain in the short-run may improve the long-run prospects of children considerably (Heckman, Stixrud, and Urzua (2006)).
data is available and theory predicts heterogeneous treatment effects. To date, non-linear DiD methods have been rarely used in policy evaluation.7 To evaluate the sensitivity of the QTE estimates to the assumptions about the counterfactual outcome distribution, we implement three non-linear DiD methods that have been recently proposed but rarely used.8 Although the identifying assumptions differ, they all show that the consequences of
a policy change could be much more extensive than what mean impacts suggest.
The paper proceeds as follows. Section 2 reviews key facts regarding the child care system in Norway, describes the child care reform and discusses its expected impact on child development. Section 3 describes the empirical strategy and Section 4 presents the data. Section 5 presents our empirical findings and provides sensitivity analyses. Section 6 concludes.
2
Background
2.1 The child care reform
In the post-WWII years in Norway, the gradual entry on the labor market of particularly married women with children, caused growing demand for out-of-home child care. In a survey from 1968, when child care coverage was less than 5 %, about 35 % of mothers with 3 to 6 year olds stated demand for subsidized child care (Norwegian Ministry of Children’s and Family Affairs, 1972). In the same survey, only 34 % of the latter group of respondents stated that they were in fact using out-of-home child care on a regular basis. Out of these, just 14 % were in subsidized child care, while more than 85 % were using informal arrangements. The severe rationing of subsidized child care acted as a background for political progress towards public funding of child care.
In June 1975, the Kindergarten Act was passed by the Norwegian parliament with broad bipartisan political support. It assigned the responsibility for child care to local municipalities, but included federal provisions on the price, educational content, group size, staff skill composition, and physical environment. By increasing the level of federal subsidies for both running costs in general and investment costs for newly established institutions, the government aimed at quadrupling the number of child care places to reach a total of 100,000 by 1981. In the years following the reform, the child care expansion was progressively rolled out at a strong pace, with federal funding more than doubling from USD 34.9 million in 1975 to 85.8 million in 1976, before reaching 107.3 million in 1977.9 This implied an increase in the federal coverage of running costs from about 10 %
7By way of comparison, a growing literature estimates QTE to assess heterogenous effects in randomized controlled trials (see e.g. Bitler, Gelbach, and Hoynes, 2006).
8These methods are discussed in Athey and Imbens (2006) and Firpo, Fortin, and Lemieux (2009). While Firpo, Fortin, and Lemieux (2009) assumes selection on observables, we extend their approach to a DiD setting.
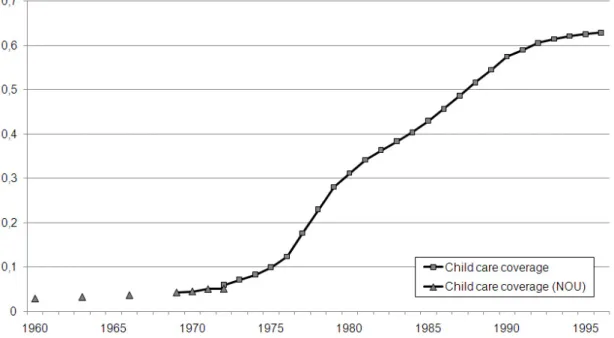
Figure 1. Child care coverage rates for children 3 to 6 years old, 1960–1996.
Notes: Data from 1972 are based on administrative registers. Data for 1960–1972 are taken from Norwegian Ministry of Children’s and Family Affairs (1972).
in 1973 to 17.6 % in 1976, and further to 30 % in 1977. From 1976, newly established child care places received additional federal funds for a period of five years. Municipalities with relatively low child care coverage rates were awarded the highest subsidies.
Altogether, the reform constituted a substantial positive shock to the supply of subsi-dized child care, which had been severely constrained by limited public funds. In succeeding years, the previously slow expansion in subsidized child care accelerated rapidly. From a total coverage rate of less than 10 % for 3 to 6 year olds in 1975, coverage had shot up above 28 % by 1979. Over the period, a total of almost 38,000 child care places were established, more than a doubling from the 1975-level. By contrast, there was almost no child care coverage for 1 and 2 year olds during this period. Figure 1 draws child care coverage rates in Norway from 1960 to 1996 for 3 to 6 year olds. As is apparent from the figure, there has been strong growth in child care coverage rates since 1975, particularly in the early years. In our analysis, we will focus on the early expansion, which likely reflects the abrupt slackening of constraints on the supply side caused by the reform, rather than a spike in the local demand.
A potential worry could have been that there were other policies implemented in the same period. However, there were no significant reforms or breaks in trends that could be of concern for our estimations (see e.g. Havnes and Mogstad, 2011b). One might also worry that the quality of child care differs between municipalities where child care expanded a lot (our treatment group) and municipalities with little or no increase in child care coverage (our comparison group). To investigate this issue, we considered data on municipal spending on child care during this period. Comparing treatment and
comparison municipalities, we find that the difference in municipal spending per child care place changes little over time, and produces a statistically insignificant estimate in our main DiD-model. When we consider structural indicators of quality, we again find litte evidence of quality degradation in treatment municipalities. For instance, the ratio of teachers to children was approximately stable around 5.5 % in both treatment and comparison municipalities. The absence of significant changes in both spending and observable measures of quality is consistent with the government regulation and oversight required for institutions to receive child care subsidies.
2.2 Types of child care
To interpret our results, we must understand the type of care we are studying. The Norwegian Ministry of Administration and Consumer Affairs was responsible for autho-rization, operation and supervision of formal child care. Both private and public child care institutions that satisfied the federal provisions received subsidies for running and establishment costs from the federal government. Regardless of ownership, formal child care institutions were required to satisfy federal provisions on educational content and activities, group size, staff skill composition and physical environment. The Kindergarten Act specified regulations, and guidelines were formulated for activities and content. To be eligible for subsidies, institutions were obliged to meet the requirements and follow the guidelines. Subsidies were determined on the basis of the number and age of children, and the amount of time they spend in subsidized child care. To receive subsidies from the federal government, child care institutions were obliged to meet provisions on the maximum price to be paid by the parents, educational content and activities, group size, staff skill composition and physical environment. As a consequence, subsidized child care was quite homogenous with respect to observable characteristics such as group size, staff-child ratio, and employee training.
The child care institutions were open during normal working hours. All children were eligible, and open slots were in general allocated according to length of time on the waiting list and age. Only under special circumstances could a child gain priority on the waiting list. Institutions were run by an educated preschool teacher responsible for day-to-day management. The preschool teacher education is a college degree, and the head teacher was to ensure satisfactory planning, observation, collaboration and evaluation of the work. The head teacher was also in charge of staff guidance, as well as collaboration with parents and local authorities, such as health stations, child welfare services, and educational/psychological services. Institutions were required to have at least one educated preschool teacher per 18 children aged 3–6. Teachers typically worked closely with one or two assistants, and were responsible for the educational programmes in separate groups and for day-to-day interaction with parents. There were no educational requirements for assistants. A tradition of social pedagogy has been dominant in forming the educational
content of Norwegian child care policy.10 This implies that children should develop social, language, and physical skills mainly through play and informal learning integrated with the day-to-day social interaction between children and staff, and combined with some age-specific activities.
Overall the quality of the program we study appears to be comparable to universal child care programs in other countries, but substantially lower than in most targeted programs (see Datta Gupta and Simonsen, 2010). The average yearly expenditure for a slot in subsidized child care was approximately USD 6,600. This is slightly higher than the expenditures for the universal Canadian child care program and somewhat lower than center based child care in Denmark. These expenditure levels are mirrored in the number of children per staff. In the Norwegian program, the average staff-child ratio was about 1:8; The corresponding ratio is 1:12 in Canada and 1:7 in Denmark.
To understand the estimated impacts of the child care reform, it is useful to know something about the counterfactual mode of care, i.e. the type of care the children would be exposed to absent the reform. Following Blau and Currie (2006), consider two distinct counterfactual modes of care. The first is parental care, while the second is informal care, including relatives, unlicensed care givers, and other irregular care givers such as friends and neighbors. A shift from parental care to subsidized formal child care could affect children differently than a shift from informal care, which is likely to be of inferior quality.
Unfortunately, we do not have information about the mode of care of individual children. However, if we knew the effect of the child care expansion on maternal employment, we could hone in on the counterfactual mode of care. Following Blau and Currie (2006), consider the following three combination of mother’s work and child care decision: not working and maternal care, working and informal care, and working and subsidized formal care. If the new subsidized formal child care led to a shift from parental to formal care, we would expect it to affect maternal employment rates also.11 The effect of the child
care reform on full-time and part-time work of married mothers is estimated in Havnes and Mogstad (2011a), using the same DiD approach. The analysis suggests that the new subsidized child care crowds out informal care arrangements, with almost no net increase in total (informal and subsidized) care use or maternal labor supply. This evidence points to informal care as the alternative to subsidized formal care for most children in our study. The shift from informal to formal care seems relevant for debates about universally accessible child care also in other countries.12
10The social pedagogy tradition to early education has been especially influential in the Nordic countries and Central-Europe. In contrast, a so-called pre-primary pedagogic approach to early education has dominated many English and French-speaking countries, favoring formal learning processes to meet explicit standards for what children should know and be able to do before they start school.
11It is possible that non-working mothers were taking up some of the new care child care slots. However, survey results reported in Leira (1992) suggests that the number of non-working mothers using formal child care did not increase over the period 1973–1985.
2.3 The expected effects
The child care reform can be interpreted as a subsidy to parents for choosing out-of-home care of a particular quality, generating at least one and possibly two convex kinks in the family’s budget constraints. Depending on counterfactual quality of care, the effects of the subsidized child care may vary in magnitude and even sign. To see this, consider a simple model of parental investment where families are unitary and can affect their child’s quality
Q by investing in the quality of care q and by purchasing market goods k, according to a child production function h(q, k) that is increasing and concave in both arguments. Assume that both quality of care and market goods can be purchased at pricespq and pk,
respectively. With a total time endowment L and a potential wage w, the family budget is then
wL=c+pqq+pkk (1)
where the numeraire good cis leisure or consumption not affecting child quality.13
Before the introduction of subsidized care, parents minimize the cost of producing a given level of child quality by equating the marginal cost of care quality q and child goods
k. The effective family budget can then be summarized as
wL = c+pQ(Q)
where pQ(Q) is the minimum total cost in consumption units of producing a given child
quality Q, which is increasing and convex. Given the budget wL, we can then map out the consumption possibility frontier of the parents, drawn in panel (a) of Figure 2.
As usual, assume that parents optimize utility by equating the marginal benefit of child quality to the marginal cost of provision in terms of foregone consumption. In panel (a) of Figure 2, this is illustrated in the tangency between an indifference curve and the consumption possibility frontier. The upper tangency is for a family with a high value of consumption relative to child quality, while the lower tangency is for a family with low value of consumption relative to child quality.
Subsidized care makes child care of a particular quality, say ¯q, available at a price ¯pq
lower than the market price. A family that opts into subsidized care locks in the quality of care, higher or lower than what they would choose in the market. The family may compensate for lower quality care by purchasing more child goods k. Families may also
labor supply among married mothers in the US and Sweden, respectively. By comparison, Gelbach (2002), Berlinski and Galiani (2009) and Baker et al. (2008) find positive but modest effect on maternal labor supply. All these studies suggest that subsidized child care substantially crowds out of informal care arrangements.
13Note that this model does not rule out that parents care about other aspects of their children, but assumes that features that do not affect child quality can be summarized in the numeraire ’family consumption good’. As such, to the extent that it does not improve upon their quality, a more pleasant environment for their children may, for instance, be part of the trade-off between child quality and family consumption faced by parents.
choose not to use subsidized care, going instead to the market analyzed above. Using the budget and production function, the total cost of child quality is now
¯
pQ(Q) = ¯pqq¯+pk(Q; ¯q)
wherepk(Q; ¯q) is total expenditure on market goods to produce child qualityQ, given the
quality of subsidized care. Opting into subsidized care changes the consumption possibility frontier, as compared to the market. First, note that at Q= 0, ¯pQ(0) = ¯pqq > p¯ Q(0) = 0
such that maximum family consumption is unambiguously reduced by choosing subsidized care. Second, families opt into the subsidized program only if ¯pQ(Q)≤pQ(Q) for someQ,
implying that the frontier with subsidies is outside the market frontier. Finally, maximum child quality depends on the ability of parents to compensate for a lower quality of care. That is, it depends on the complementarity between quality of care and market goods in the production of child quality. If market goods are a poor substitute for quality of care, then families with a strong preference for child outcomes may not be able to fully compensate for the lower quality offered in subsidized care. The new frontier may then cross the former a second time.
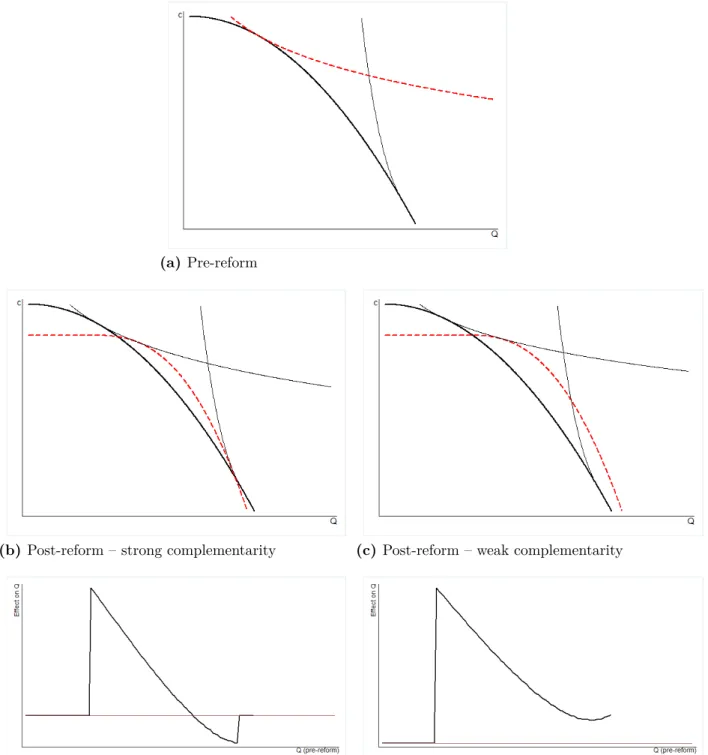
Two alternative scenarios are illustrated in panels (b) and (c) of Figure 2. In panel (b), complementarity between care quality and market goods is strong, such that families with a strong preference for child quality are unable to fully compensate for the lower care quality if they opt into subsidized care. In panel (c), complementarity between care quality and market goods is weaker, and families are able to fully compensate by purchasing market goods if subsidized care is of lower quality than what they would purchase in the market.
Panels (d) and (e) of Figure 2 draw the predicted effects on child outcomes of introducing subsidized child care. For very low or very high levels of child quality, parents do not opt into subsidized care, and effects are zero. In the intermediate region, effects are positive in the lower parts of the distribution, then decrease in size, and may turn negative at the top. Families may accept some negative effects on children because of the associated gains in family consumption. There are no unambiguous predictions about the mean impacts of introducing subsidized child care: The sign and magnitude depend on the size of the different effects weighted by the relative number of children along the family’s budget constraint without subsidized care. The model does, however, predict that the introduction of subsidized care equalizes the outcome distribution of children. If child care quality is a normal good, we also expect that the benefits of subsidized care is negatively correlated with family income. This means that subsidized child care should reduce the intergenerational income elasticity.
(a)Pre-reform
(b) Post-reform – strong complementarity (c) Post-reform – weak complementarity
(d) Effect of reform – strong complementarity (e) Effect of reform – weak complementarity
Figure 2. Predicted effects of introducing subsidized care.
Notes: To generate the graphs, we have parametrized the model in Section 2.3 assuming that the child production function is of the CES-form, while the parental utility function is CRRA.
3
Empirical strategies
To estimate the effect of the expansion of subsidized child care on children’s outcomes we follow Havnes and Mogstad (2011b) in applying a DiD approach, exploiting that the supply shocks to subsidized child care were larger in some areas than others. Below, we will first describe the identification strategy, before discussing the econometric models we use to estimate distributional impacts and mean impacts.
3.1 Identification strategy
Our identification strategy is the following: We compare the adult outcome of interest for 3 to 6 year olds before and after the reform, from municipalities where child care expanded a lot (i.e. the treatment group) and municipalities with little or no increase in child care coverage (i.e. the comparison group).
The child care expansion started in 1976, affecting the post-reform cohorts born 1973–1976 with full force. The pre-reform cohorts consist of children born in the period 1967–1969. We consider the period 1976–1979 as the child care expansion period. Starting in 1976 gives the municipalities some time to plan and react to the policy change. Also, 1976–1979 was the period with the largest growth in child care coverage. In the robustness analysis, we make sure that our results are robust to changes in the exact choice of expansion period.
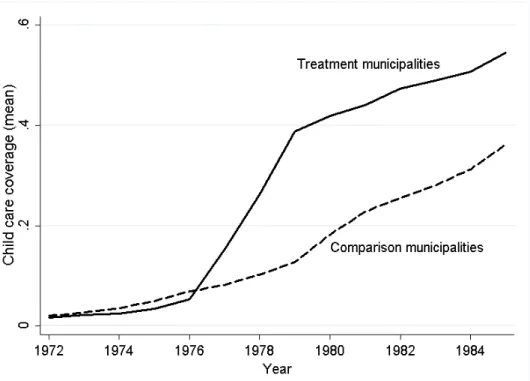
To define the treatment and comparison group, we order municipalities according to the percentage point increase in child care coverage rates from 1976 to 1979. We then separate the sample at the median, the upper half constituting thetreatment municipalities and the lower half the comparison municipalities. Figure 3 shows child care coverage before and after the 1975 reform in treatment and comparison municipalities (weighted by population size). The graphs move almost in parallel before the reform, while child care coverage in treatment municipalities kinks heavily after the reform. This illustrates that our study compares municipalities that differ distinctly in terms of changes in child care coverage within a narrow time frame. In the robustness analysis, we take several steps to ensure that our results are robust to the exact child care coverage cut-off, defining treatment and comparison municipalities.
Our identification strategy raises two key selection issues. First, there could be selection of municipalities into expanding child care depending on the gains in child development from subsidized child care. For instance, it could be that child care expanded most in municipalities where child development were most responsive to subsidized child care. This means that we need to be cautious in extrapolating the DiD estimates to effects for the population of children at large.
Second, if there is selection of municipalities into expanding child care depending on the underlying time trends in child outcomes in the absence of the child care expansion,
Figure 3. Child care coverage rates for children 3 to 6 years old by treatment (solid) and comparison group (dashed).
Notes: Treatment (comparison) municipalities are above (below) the median in child care coverage from 1976 to 1979.
then the DiD approach will provide biased estimates of the effects on children who reside in the treatment area in the post-expansion period. For instance, it could be that the municipalities that expanded child care the most did so to counteract a negative trend in child outcomes. To address the concern for selection bias in the effects of subsidized child care, Section 4 looks closely into the determinants of the child care expansion across municipalities. We also run a battery of specification checks, which are discussed after the main results in Section 5.
3.2 Econometric models
We will use non-linear DiD methods to estimate how the child care reform affected the outcome distribution of exposed children as adults. The estimated quantile treatment effects (QTE) allow us to assess the impact of the universal child care program on the lower, middle and upper part of the outcome distribution.
To fix ideas, suppose that subsidized child care was randomly assigned to municipalities. Then the QTE could have been identified directly from the earnings distributions of the post-reform cohorts from treatment and comparison municipalities: At any quantile
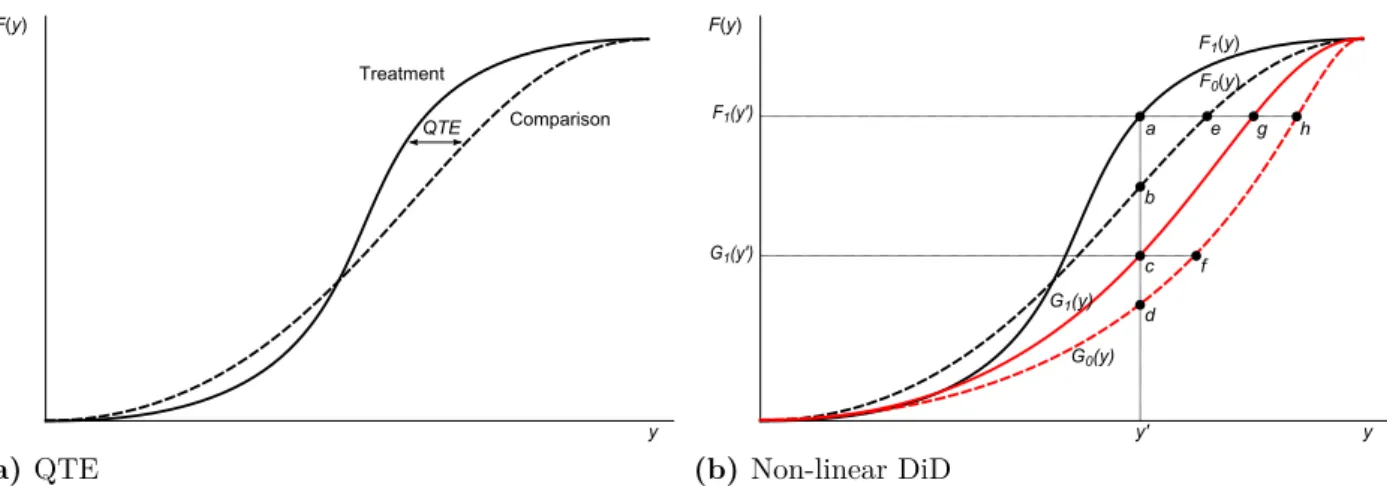
q ∈(0,1), the QTE is simply the difference in the q-th earnings quantile in the treatment versus the comparison group. Figure 4a illustrates by showing how the QTEs are given by the horizontal differences in the cumulative distribution functions of the outcome between
the treatment and the comparison group.
With observational data, identification of QTE requires assumptions about the coun-terfactual earnings distribution in the absence of subsidized child care. In the spirit of the standard DiD estimator, non-linear DiD methods use the observed change in the distribution of the comparison group, from before to after treatment assignment, as an estimate of the change that would have occurred in the treatment group over this period in the absence of treatment. Let Ft(y) (Gt(y)) be the adult earnings distribution of
children from treatment (comparison) municipalities born in period t, where t= 0 denotes pre-reform cohorts and t= 1 denotes post-reform cohorts. The counterfactual earnings distribution of the post-reform cohorts from treatment municipalities is assumed to be
F1(y)RIF =F0(y) + (G1(y)−G0(y)).
The estimated DiD-effect in probability points is then given by the difference between the actual and the counterfactual earnings distribution at any earnings level y, i.e. (1−F1(y))−(1− F1(y)RIF).
Figure 4b illustrates the procedure, which compares the vertical difference in the earnings distribution of pre- and post-reform cohorts from treatment and comparison municipalities. In Figure 4b, the estimated impact at y = y0, measured in population shares, is −[(a−b)−(c−d)]. Following Firpo, Fortin, and Lemieux (2009), we can divide this difference by a kernel estimate of the joint density of earnings at y0 to arrive at the associated QTE. This prodedure may be viewed as a recentered influence function (RIF) regression (Firpo, Fortin, and Lemieux, 2009), and we refer to it as RIF-DiD. In Section 5, we show that the QTE estimates are robust to the use of the alternative non-linear DiD methods discussed by Athey and Imbens (2006).
The identifying assumption underlying the RIF-DiD estimator is thatthe change in
population shares from before to after treatment around a given level of earnings would be
the same in the treatment group as in the comparison group, in the absence of treatment. In comparison, the standard DiD-estimator assumes a common trend in mean earnings in the absence of treatment. The counterfactual mean earnings of the treatment group in the post-reform period is then µDD
F1 =µF0 + (µG1 −µG0), where µF denotes the mean
of the distribution F. The mean impact estimate is then µF1 −µ
DD
F1 . In contrast to the
standard DiD-estimator, the identifying assumption of RiF-DID is invariant to monotonic transformations of the outcome (e.g. considering the log of earnings instead of earnings levels).
As in Baker, Gruber, and Milligan (2008) and Havnes and Mogstad (2011b), we focus on the reduced form effects on all children from post-reform cohorts who reside in treatment municipalities. An advantage of these reduced form parameters is that they capture the full reform impact of the introduction of subsidized child care, including any changes in
F(y) Comparison Treatment y QTE (a) QTE F(y) F0(y) F1(y) G0(y) G1(y) a b d e g h y' c f F1(y') G1(y') y (b) Non-linear DiD
Figure 4. Illustration of the empirical strategy: Quantile treatment effects and non-linear DiD-estimators.
Notes: Ft(y) (Gt(y)) are simulated outcome distributions for treated (comparison) before (t= 0) and after (t= 1) treatment. Indicated points illustrate alternative non-linear DiD estimators aty=y0: RIF-DiD:
−[(a−b)−(c−d)]; CiC: (a−e)−(c−f); QDiD: (a−e)−(g−h).
parental behavior and spillover effects on children who were not attending subsidized care. To interpret the magnitude of the reduced form effects, we scale them by the increase in child care spending or child care coverage following the reform in the treatment group relative to the comparison group. The scaled estimates give the impact of the introduction of subsidized child care – per dollar spent or per child care place offered – on children born to post-reform cohorts in treatment municipalities. A limitation of the reduced form parameters is that we cannot tell whether differential effects of the child care reform operate through differences in child care take-up and potentially heterogenous impacts of uptake (depending on the quality of the child care center and the counterfactual form of care). Distinguishing empirically between these two sources to heterogeneity would be interesting, but requires data we do not have and an assumption about the policy not shifting the ranks of children in their potential outcome distribution (see Heckman, Smith, and Clements, 1997).14
14One could explore these channels by estimating the marginal treatment effects of subsidized child care relative to each alternative form of care. This would require data on the take-up of subsidized care and the counterfactual form of care of each child. One would also need instruments that generate continuous support from 0 to 1 on the probability of taking-up subsidized care instead of the alternative forms of care for every value of the observable characteristics of children and parents. See Heckman and Vytlacil (2007) for a discussion of identification of marginal treatment effects in unordered choice models.
4
Data
4.1 Data and sample restrictions
Our analysis employs several register data sets from Norway that we can link through unique identifiers for each individual.15 We begin with a rich longitudinal database that
covers every resident from 1967 to 2009. For each year, it contains individual demographic information (including gender, date of birth, and municipality of residency) and socio-economic data (including education and earnings). The data set includes unique family identifiers that allow us to match parents to their children. We link this data with the national military records with information on cognitive test scores. We also use an administrative register that covers all child care institutions eligible for public subsidies from from 1972 to 2009. In each year, the child care institutions report the number of children in child care by age. Merging this data with the demographic files containing information about the total number of children according to age and residency, we construct a time series of annual child care coverage (by age of child) in each municipality.
We focus on children born 1967–1969 (pre-reform cohorts) and children born 1973–1976 (post-reform cohorts). We restrict the sample to children of married mothers (prior to the reform), which makes up about 93 % of the above sample. The reason for this choice is that our data does not allow us to distinguish between cohabitants and single parents in these years. Family background characteristics (including family income and parental education) are measured prior to the reform. Rather than dropping a small number observations where information on family background characteristics is missing, we include separate categories for missing values. The final sample used in the estimations consists of 341,170 children.
The primary outcome variable of interest is the child’s average earnings over the period 2006–2009. Our earnings measure includes wages and income from self-employment. We also consider the child’s educational attainment and ability test scores. The ability score is only available for males because they are collected from military records, and military service is compulsory for men only.16 Before entering the military, their cognitive ability
is assessed; this occurs for the great majority between their eighteenth and twentieth birthdays. The ability test score at these ages is particularly interesting as it is about the time of entry to the labor market or to higher education. The test score is a composite
15The coverage and reliability of Norwegian register data is considered to be exceptional, as illustrated by the fact that they received the highest rating in a data quality assessment conducted by Atkinson et al. (1995).
16We have test scores for about 84 % of all Norwegian men born in the years we consider. Eide, Øyen, Skjærven, Nilsen, Bjerkedal, and Tell (2005) examine patterns of missing scores for the men in the 1967–1987 cohorts. Of those, 1.2 % died within 1 year and 0.9 % died between 1 year of age and registering with the military at about age 18. About 1 % of men had emigrated before age 18, and 1.4 % were exempted because they were permanently disabled. An additional 6.2 % of scores are missing for a variety of reasons, most notably foreign citizenship.
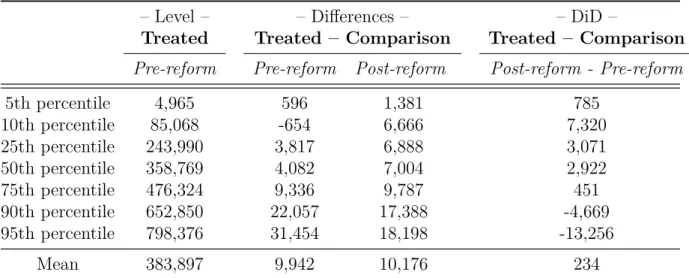
Table 1. Distribution of earnings.
– Level – – Differences – – DiD –
Treated Treated – Comparison Treated – Comparison
Pre-reform Pre-reform Post-reform Post-reform - Pre-reform
5th percentile 4,965 596 1,381 785 10th percentile 85,068 -654 6,666 7,320 25th percentile 243,990 3,817 6,888 3,071 50th percentile 358,769 4,082 7,004 2,922 75th percentile 476,324 9,336 9,787 451 90th percentile 652,850 22,057 17,388 -4,669 95th percentile 798,376 31,454 18,198 -13,256 Mean 383,897 9,942 10,176 234
Notes: Pre-reform cohorts are born 1967–1969 and post-reform cohorts are born 1973–1976. Treatment (comparison) municipalities are above (below) the median in child care coverage growth from 1976 to 1979. The earnings variable is defined as the child’s average earnings over the period 2006–2009 measured in NOK (N OK/U SD≈6).
score from three timed tests—arithmetic, word similarities, and figures (see Thrane 1977, and Sundet et al. 2004, 2005). The composite test score is an unweighted mean of the three subtests. The raw scores are standardized into a a nine point scale that has a discrete approximation to a normal distribution, a mean of 100, and a standard deviation of 15.
4.2 Descriptive statistics
Table 1 shows mean earnings and earnings levels at different percentiles. As is evident from the table, there are systematic changes in the differences in the earnings of the treatment and comparison group, between the pre-reform and post-reform cohorts. In our DiD approach, this pattern is suggestive of significant effects of child care on children’s earnings. In particular, Table 1 indicates positive effects in the lower and central parts, and negative effects in the upper parts of the earnings distribution. In contrast, there is no evidence of changes over time in the characteristics of children and parents from the treatment municipalities as compared to the comparison municipalities (see Table A1 in the Appendix). This finding is reassuring since substantial changes over time in the differences in the observable characteristics of the two groups may suggest unobserved compositional changes, which would call our empirical strategy into question.17
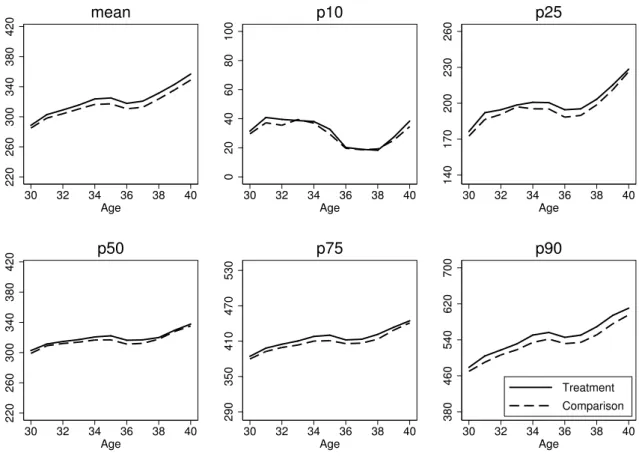
We have also explored the pre-existing patterns in the earnings distribution in treatment and comparison municipalities. Figure 5 shows the evolution of earnings at the mean and selected percentiles in the 1967-cohort. The profiles of children from treatment
17We have also performed balancing tests with and without Oslo. In either case, there is no evidence of changes over time in the characteristics of children and parents from the treatment municipalities as compared to the comparison municipalities. This holds true also when we exclude the three or five largest cities.
220 260 300 340 380 420 30 32 34 36 38 40 Age mean 0 20 40 60 80 100 30 32 34 36 38 40 Age p10 140 170 200 230 260 30 32 34 36 38 40 Age p25 220 260 300 340 380 420 30 32 34 36 38 40 Age p50 290 350 410 470 530 30 32 34 36 38 40 Age p75 380 460 540 620 700 30 32 34 36 38 40 Age Treatment Comparison p90
Figure 5. Mean and selected percentiles of earnings at ages 30–40, 1967-cohort from treatment and comparison municipalities.
Note: The figure graphs means and percentiles of the distribution of earnings at ages 30–40 of the cohort born in 1967, separately for children from treatment and comparison municipalities. Treatment (comparison) municipalities are above (below) the median in child care coverage growth from 1976 to 1979. Earnings refer to income from wages and self-employment measured in 1,000 NOK fixed at the 2006-level (N OK/U SD≈6).
municipalities mirror closely the ones of children from comparison municipalities. This suggests that the our estimation strategy should not pick up differential earnings trends across these groups.
Because we use a DiD approach, it is not necessary that the child care expansion is unrelated to municipality characteristics. It is useful, however, to understand the determi-nants of the expansion across municipalities. The treatment and comparison municipalities are quite well spread out over Norway, covering urban and rural municipalities.18 In our baseline specification, five of the ten largest cities – by the number of children in our sample – are defined as treatment municipalities (Oslo, Bergen, Stavanger, Bærum and Fredrikstad), while the others are defined as comparison municipalities (Trondheim, Kris-tiansand, Tromsø, Skien and Drammen). Furthermore, there appears to be no substantial differences in terms of local government expenditure per capita, in total or on primary
school in particular.19 This is most likely because of strict federal provisions for minimum standards of different local public services, and considerable ear-marked grants-in-aid from the central government. The same holds for local government income, consisting largely of grants-in-aid from the central government, local income taxes, and user fees. This comes as no surprise, as the federal government determines the tax rate and the tax base of the income tax. Also, the federal government used equalization transfers to redistribute income from rich to poor municipalities, such that local differences in revenues are largely offset. Interestingly, there are no noticeable differences in the share of female voters between the municipalities of the treatment and comparison area, nor is there significant disparity in the socialist shares of voters. This conforms well to the fact that there was broad bipartisan support for child care expansion in Norway in the 1970s. Further, we do not find any substantial differences in population size or the population shares of neither 0 to 6 year olds, nor females of fecund age, 19–35 or 36–55 years old.
There are, however, some notable differences between treatment and comparison municipalities. Most importantly, the ratio of child care coverage to employment rate of mothers of 3–6 year olds pre-reform, is substantially lower in treatment than in comparison municipalities. In treatment municipalities, there is on average more than four employed mothers for each child care place, while the same ratio is less than three-to-one in comparison municipalities. This is not surprising, since federal subsidy rates were higher for municipalities with low child care coverage prior to the reform, but also because local political pressure for expansion of subsidized care is likely to be stronger in areas where child care was severely rationed. Two of the variables indicating a rural municipality also have a small positive relationship with the child care expansion (average distance to zone center and ear marks per capita). This might be due to the discreteness of child care expansion; Establishing a typical child care institution increases the child care coverage rate more in smaller than in larger municipalities. In Norway, there was a very slow process of urbanization until the mid 1980s, which implies that rural status is likely to be more or less constant during the period we consider.20
Although the DiD approach controls for the direct effects of pre-determined factors in the municipalities, like differences in rationing of subsidized child care prior to the reform, bias can arise from the determinants of the child care expansion being systematically
19Table A2, reported in the Appendix, displays characteristics of the municipalities in 1976, in the treatment and comparison area. In addition, when examining the pre-reform trends in time-varying municipality characteristics (such as municipal expenditures, primary school expenditures, tax income, average education, labor force participation, family patterns), we find a good coherence between the treatment and the comparison municipalities. As expected, we find a good coherence between the time trends of the treatment and the comparison municipalities.
20We have also regressed the change in the municipality’s child care coverage between 1976 and 1979 on the characteristics of the municipalities. Consistent with the descriptive statistics, there is little evidence of systematic relationships between the child care expansion and the characteristics of the municipalities. A notable exception is the ratio of child care to maternal employment rate prior to the reform. In addition, we have examined the pre-reform trends in time-varying municipality characteristics.
related to underlying trends in child outcome. After the main results, we thereforeperform a number of specification checks which show that our findings are robust to allowing for differential time trends in outcomes across municipalities.
5
Empirical results
5.1 Main findings
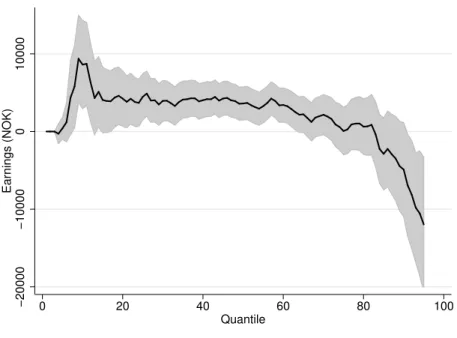
The first row of Panel (a) in Table 2 shows the standard DiD estimates for the population of children as a whole. The mean impact estimate of NOK 333 implies an increase in average earnings of $ 0.05 for every dollar spent on subsidized child care (or $ 311 per child care slot). In contrast to this small and insignificant estimate of the mean impact, the QTE estimates suggest substantial effects of the reform. Figure 6 graphs the QTE estimates from the RiF-DiD estimator. The point estimates are zero or positive for all percentiles until the 82nd percentile. The effect peaks at the 11th percentile, suggesting an impact of about NOK 9,000 from the universal child care program. This estimate translates into a $ 1.27 increase in earnings per dollar spent (or $ 8,403 per child care slot). Between the 15th and the 60th percentile estimates remain positive, at about half the size, but then fade out and turn negative in the upper part of the distribution.21
Taken together, the QTE estimates suggest that the introduction of subsidized care equalized the outcome distribution of children, in line with our simple model of parental investments. In order to quantify the equalizing effect of the child care reform, we compute the Gini coefficient in the counterfactual (F1(y)RIF) and the actual (F1(y)) earnings
distribution of the post-reform cohorts from the treatment municipalities. We find that the child care reform reduced the Gini coefficient by 2.9 percent. Put into perspective, this reduction in the Gini coefficient corresponds to introducing a 2.9 percent proportional tax on earnings and then redistributing the derived tax revenue as equal sized amounts to the individuals (Aaberge, 1997). This indicates that the child care reform has been an important equalizer for the distribution of earnings of exposed children as adults.
Another prediction from the simple model is that the benefits of subsidized care should be negatively correlated with family income (insofar as child care quality is a normal good). To assess this prediction, we examine how the impact of the child care reform varies with family income. The third row of Panel (a) in Table 2 shows subsgroup DiD estimates by family income. These estimates suggest that upper-class children suffer a mean loss of $ 1.15 for every dollar spent on subsidized child care (or $ 7,558 per child care slot), whereas children of low income parents experience an average gain of $ 1.31 for every dollar spent (or $8,671 per child care slot). By comparison, there is no evidence of differential effects by child gender, as shown in the second row in Panel (a) of Table
21We have estimated QTE at quantiles 96–99, but do not include them in the figures below because of little overlap in the uppermost part of the earnings distributions of the pre and post-reform cohorts.
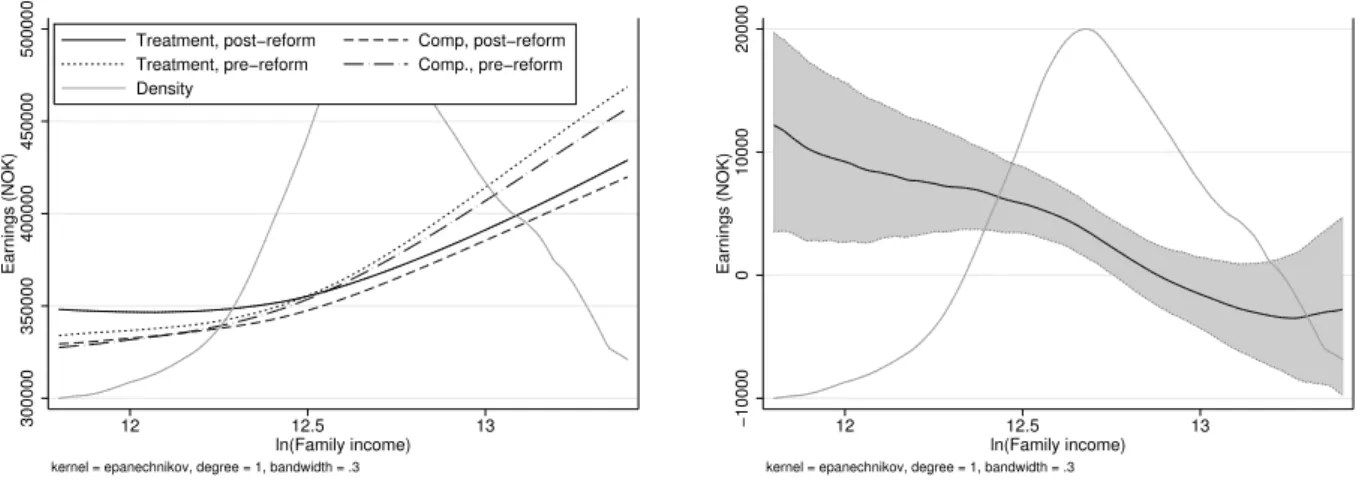
2.22 Panel (a) of Figure 7 graphs the results from local linear regressions of childrens’ earnings on (log) family income. We run the local linear regression separately for pre- and post-reform cohorts in the treatment and the comparison municipalities. We can then map out the DiD effect of the child care expansion by family income as the difference in earnings between the pre- and post-reform cohorts in the treatment municipalities as compared to the comparison municipalities. In Panel (b), we graph these DiD estimates by family income alongside the density of family income in treatment municipalities before the reform. We see that the gains in earnings associated with the reform are steadily declining in family income.
The differential effects by parental income suggest the child care reform could be improving social mobility. To quantify the effect on intergenerational income persistence, we extend the standard DiD-model with a full set of interactions beween family income (F aminc) and dummy variables for post-reform cohort (P), treatment municipalities (T),
and their interaction:
yit =γt+α1Ti+α2Ti·Pt+ (β0+β1Pt+β2Ti+β3Ti·Pt)F amincit+it
where yit represents average earnings in 2006–2009 of child i born in yeart, γt denotes
the birth cohort fixed effect, and is the error term. Our estimates suggest that the child care reform reduced the intergenerational income elasticity by 2.5 percentage points. This reduction corresponds to a decrease in intergenerational persistence of just over 9 %.23
5.2 Mediating relationships
To clarify the nature of the relationship between the child care reform and the earnings of exposed children as adults, we examine the mediating role of educational attainment and cognitive test scores.
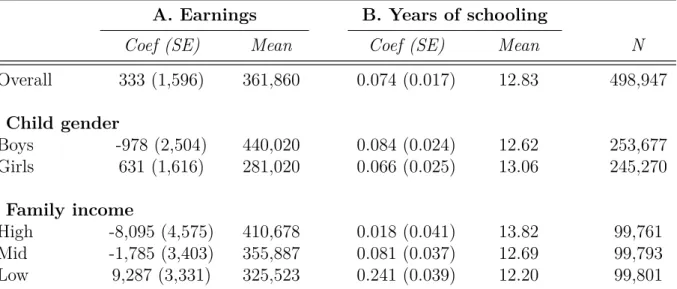
Panel (b) of Table 2 shows the effect of the universal child care program on years of schooling. While there is a positive mean impact on years of schooling, the effect is largely driven by children of low income parents. There is no change in the educational attainment of upper-class children. In Panel (a) of Figure 8, we report QTE estimates from the RiF-DiD estimator for years of schooling. The estimates reveal that most of the growth in educational attainment stems from a substantial increase in the likelihood of completing high school and attending college. This finding aligns well with the differential
22Because child gender is as good as random, the subgroup estimates by gender are not confounded by differences in family income.
23We estimate that ˆβ 3 = −.0239 with SE = 0.010, while ˆ β0,βˆ2 = (0.248,0.0165) with SE = (0.005,0.008). If we define the intergenerational income elasticity as (∂y/∂F aminc)×(F aminc/y), then
ˆ
β0+ ˆβ2 translates into an intergenerational income elasticity of.275 among pre-reform cohorts in the treatment group, while ˆβ3suggests a reduction of .0248 percentage points in this elasticity. Alternative specifications, using the log of family income and/or the log of child’s earnings, give very similar estimates.
−20000 −10000 0 10000 Earnings (NOK) 0 20 40 60 80 100 Quantile
Figure 6. QTE estimates on earnings.
Notes: This figure graphs QTE estimates from the RIF-DID estimator, including a 90 % confidence interval based on a non-parametric bootstrap with 500 replications. Pre-reform cohorts are born 1967–1969 and post-reform cohorts are born 1973–1976. Treatment (comparison) municipalities are above (below) the median in child care coverage growth from 1976 to 1979. The earnings variable is defined as the child’s average earnings over the period 2006–2009 measured in NOK (N OK/U SD≈6).
effect on years of schooling by family income, as there is little room for improvement in high school completion and college attendance among upper-class children.24
Panel (b) of Figure 8 displays the RIF-DID estimates on cognitive tests scores. Recall that the test scores are normalized to mean 100 and standard deviation of 15. We see that the QTE estimates on test scores are close to zero, and they are sufficiently precise to rule out any economically relevant effect. The combination of substantial effects on earnings and educational attainment and no impact on cognitive test scores points to the importance of non-cognitive skill development. This conforms with evidence from targeted programs showing that early interventions have large returns in the labor market because of improvements in non-cognitive skills, even though cognitive test score advantages for children with preschool experiences tend to fade out quickly as they go through school (see e.g. Heckman and Masterov, 2007). Unfortunately, we do not have information on
non-cognitive skills, and therefore cannot assess this conjecture.
24For the pre-reform cohorts from treatment municipalities, the high school completion rate is 65.3 % for children of low-income parents and 86.2 % for children of high-income parents.
300000 350000 400000 450000 500000 Earnings (NOK) 12 12.5 13 ln(Family income)
Treatment, post−reform Comp, post−reform Treatment, pre−reform Comp., pre−reform Density
kernel = epanechnikov, degree = 1, bandwidth = .3
(a) Earnings levels
−10000 0 10000 20000 Earnings (NOK) 12 12.5 13 ln(Family income)
kernel = epanechnikov, degree = 1, bandwidth = .3
(b) DiD estimates
Figure 7. Child earnings and reform effects by family income.
Notes: Panel (a) shows predictions from a local linear regression of earnings on the natural logarithm of family income (at age 3–6) by treatment status for children born in 1967–1969 (pre-reform) and 1973–1976 (post-reform), using an epanechnikov kernel with bandwidth = 0.3. Birth cohort effects were removed from earnings prior to estimation, and the residuals were rescaled to fit the level of earnings in the 1967-cohort. Panel (b) shows the density of log family income in the treatment group pre-reform, and DiD-estimates constructed from the graphs in panel (a), including a 90 % confidence interval based on a non-parametric bootstrap with 500 replications. Treatment (comparison) municipalities are above (below) the median in child care coverage growth from 1976 to 1979. The earnings variable is defined as the child’s average earnings over the period 2006–2009 measured in NOK (N OK/U SD≈6).
5.3 Sensitivity analysis
As always in policy evaluation using non-experimental data, we cannot completely guard against selection bias. However, to increase the credibility of our findings, this section reports results from a battery of specification checks. It is reassuring to find that the effects of child care on the distribution of children’s adult earnings are similar across specifications. Importantly, these checks are performed for each percentile in the outcome distributions, rather than just the mean.25
Identifying assumption. The identifying assumption underlying the RIF-DiD estimator is
that the change in population shares from before to after treatment around a given level of earnings would be the same in the treatment group as in the comparison group, in the absence of treatment. A concern is that the QTE estimates may reflect differential time trends between the treatment and comparison municipalities in the population shares, rather than true policy impacts. For instance, the QTE estimates would be biased if the time trend in earnings differs by, say, parent’s education, while there are differential changes over time in parental education between treatment and comparison municipalities. To
25For brevity, we do not report the estimates for every specification check, but these results are available from the authors upon request.