No. 2011-083
THE FIXED-EFFECTS ZERO-INFLATED POISSON MODEL
WITH AN APPLICATION TO HEALTH CARE UTILIZATION
By Maria Cristina Majo, Arthur van Soest
July 25, 2011
The Fixed-Effects Zero-Inflated Poisson Model
with an Application to Health Care Utilization
∗Maria Cristina Majo†
Trimbos Institute
Arthur van Soest‡
Tilburg University, Netspar July 25, 2011
Abstract
Response variables that are scored as counts and that present a large number of zeros often arise in quantitative health care analysis. We define a zero-inflated Poisson model with fixed-effects in both of its equations to identify respondent and health-related characteristics as-sociated with health care demand. This is a new model that is pro-posed to model count measures of health care utilization and account for the panel structure of the data. Parameter estimation is achieved by conditional maximum likelihood. An application of the new model is implemented using micro level data from the 2004–2006 Survey of Health, Ageing and Retirement in Europe (SHARE), and compared to existing panel data models for count data. Results show that sepa-rately controlling for whether outcomes are zero or positive in one of the two years does make a difference for counts with a larger number of zeros.
Keywords: Count Data; Zero-Inflated Poisson Model; Fixed-effects; SHARE
JEL classification: J14, C14, C33
∗
Acknowledgements: M.C. Majo acknowledges research funding of Tor Vergata Univer-sity and Tilburg UniverUniver-sity and the financial support provided through the RTN European Program (HPRN-CT-2002-00235). We thank Jochem de Bresser, Vasilios Andrikopoulos, Vincenzo Atella, Daniele Fabbri, Mario Padula, Franco Peracchi, Marianna Brunetti, and seminar participants at Tor Vergata University for help and comments. This paper uses data from SHARE. Data collection and infrastructure was funded by the European Com-mission (CIT5-CT-2005-028857, QLK6-CT-2001-00360; RII-CT-2006-062193), NIA (U01 AG09740-13S2; P01 AG005842; P01 AG08291; P30 AG12815; Y1-AG-4553-01; OGHA 04-064; R21 AG025169) and various national sources (see http://www.share-project.org).
†
Corresponding author: M.C. Majo, Trimbos Institute, Postbus 725, 3500 AS Utrecht (NL), Tel. +31(0)302959363, E-mail: [email protected].
‡
1
Introduction
Count data models have become increasingly popular in many fields of empirical economics and other social sciences; see, for example, Cameron and Trivedi (1998), Wooldridge (2002, Chapter 19), Winkelmann (2003), or Cameron and Trivedi (2005, Chapter 20). Applications include, for example, studies in transportation (on the number of accidents or trips), demography (on the number of births), health economics (on the number of doctor visits or hospital stays), industrial organization (on the number of patents), mar-keting (on the number of products purchased) and labor economics (on the number of job market transitions, for example). Models for cross-section data range from the standard Poisson model to models allowing for overdis-persion such as the negative binomial model, and hurdle models or zero inflated models that account for unusually large numbers of zero outcomes (see, e.g., Lambert 1992). Our focus here is on the latter type of models.
Count outcomes are particularly common in many medical and public health studies explaining the use of specific types of health care, with data that often present a large number of zeros. In order to adjust for extra zero counts, and to avoid biased parameter estimates and misleading inferences, various modifications of the Poisson regression model have been proposed. There are mainly two streams of literature. The first considers utilization of health care as a two-part decision making process (hurdle models; see, e.g., Mullahy, 1986 or Pohlmeier and Ulrich, 1995) and distinguishes between users and non-users; this model has essentially two equations: one explaining whether the count is zero or positive, and another one determining the count if it is positive. The second approach considers individuals belonging to latent classes and distinguishes between low frequency and high frequency users (finite mixture negative binomial models; see Deb and Trivedi, 1997). Deb and Trivedi (1997, 2002) argue that the distinction between low and high frequency users of health care is a better approach, and this has been supported by the subsequent literature (see, for example, Deb and Holmes 2000). In some applications, and given different distributional assumptions on the traditional hurdle model (for example Jimenez-Martin et al., 2002,
and Bago D’Uva, 2006), it has been found that the hurdle model performs better than the finite mixture models. On the other hand, Winkelmann (2004) found that the finite mixture approach outperforms the traditional hurdle model, unless in the latter different distributional assumptions are made than the standard assumptions.
Since the seminal article of Hausman et al. (1984), many studies have also used panel data models for count data, such as the (static or dynamic) fixed-effects Poisson and negative binomial models and a random fixed-effects version of the (static) zero-inflated Poisson model (Crepon and Duguet 1997; Wang et al. 2002). Fixed-effects models are more flexible than random effects models and are often found to outperform the corresponding random effects models in empirical studies. To the best of our knowledge, there are no existing studies that use a fixed-effects version of the (static) zero-inflated Poisson model. This study fills this gap and allows for fixed effects in both equations of the zero-inflated Poisson model. We show that the zero inflated Poisson model with fixed-effects can be estimated in a similar way as the fixed-effects logit model or fixed-effects Poisson and negative binomial models. We then apply this model to analyze three types of health care service utilization using micro level data from the first two waves (2004 and 2006) of the Survey of Health, Ageing and Retirement in Europe (SHARE), covering individuals of age 50 and older and their spouses in 11 European countries (see B¨ orsch-Supan and J¨urges, 2005). We compare our zero inflated Poisson model with fixed-effects (ZIP FE) with the Poisson (P) and the negative binomial (NB) model, in order to determine which model better fits the data. We conclude that ZIP FE outperforms existing panel data models for count data and therefore represents an interesting alternative to other panel data models for count data with excess zeros.
The remainder of the paper is organized as follows: Section 2 describes frequently applied count data models for panel data and introduces the zero inflated model (ZIP) and its extension with fixed-effects for panel data (ZIP FE). Section 3 presents the data that we use for the application. Sec-tion 4 presents the estimaSec-tion results and compares our model with com-peting models for count data. Section 5 concludes.
2
Panel Data Models for Count Data
2.1 Poisson and Negative Binomial Models
A frequently applied model for the distribution of the count observations
Yit in panel data (i = 1, . . . , N;t = 1, . . . , T) is the Poisson (P) regression
model. It assumes that Yi1, . . . , YiT are independent over time conditional
onXi1, . . . , XiT, αi and that the conditional distribution ofYitfor individual
(or cross-section unit)iin time periodt, given (strictly exogenous) regressors
Xit and an individual effectαi, is a Poisson distribution with parameterµit:
P r(Yit =y|µit) =P o(y;µit) =exp(−µit)µyit/y!, for y = 0,1,2, . . . ,
(1) where
µit=exp(Xit0 β+αi) (2)
Hereβ is a vector of unknown parameters to be estimated. In the fixed-effects version of the model, no assumptions are made on αi and they are
treated as unknown nuisance parameters. In the random effects version, it is assumed that the αi are independent of all Xit and follow a specific
distribution, usually a Gamma distribution (with a mean normalized to one). Finally, the pooled version of the model treats the panel data set as a cross-section, assumingαi= 0 for all i.
The Poisson model has the properties
E(Yit|Xit, αi) =V ar(Yit|Xit, αi) =µit (3)
It therefore assumes that data are “equidispersed”: the conditional vari-ance is equal to the conditional mean. In practice, it is often found that this assumption is too restrictive, and the data are better described by a model allowing for “overdispersion”, that is a variance that is larger than the mean.
The most common model allowing for overdispersion is the negative bi-nomial model (NB). The NB model accounts for overdispersion through an additional parameter θi ≥ 0 (assumed constant over time for a given
indi-vidual), replacing the distributional assumptions by: P r(Yit=y|µit, θi) = Γ(y+θ−i 1) y! Γ(θi−1) θi−1 θi−1+µit θ −1 i µit θi−1+µit y , (4) for y= 0,1,2, . . . .
In the NB model, we have:
E(Yit|µit, θi) =µit and V ar(Yit|µit, θi) = (1 +θi)µit (5)
The parameter θi therefore reflects overdispersion. The NB model can be
derived as a mixture distribution of a Poisson model in which the Poisson parameter follows a Gamma distribution with coefficient of variation (stan-dard error divided by the mean) equal to √θi (Cameron and Trivedi 2005,
p. 675); the Poisson model is the limiting case of the NB model withθi = 0.
We use the parametrization of the NB model defined by Hausman et al. (1984).1:
µit = θiλit (6)
λit = exp(Xit0β) (7)
This specification has the advantage that it can be estimated using con-ditional maximum likelihood, in a similar way as the Poisson model with fixed effects: Since, for a given individual i, the Yit are assumed to be
in-dependent over time, it can be shown that P
tYit has a NB distribution
with parametersθi andθi
P
tλit. The conditional likelihood contribution of
individual igiven the total countP
tYit is then given by:
Li = Γ(P tλit)Γ(PtYit+ 1) Γ(P tYit+ P tλit) Y t Γ(Yit+λit) Γ(Yit+ 1)Γ(λit)
Note that the individual specific nuisance parameterθi does not appear
in this conditional likelihood, like αi in the fixed effects Poisson model.
Standard numerical maximization routines can be applied to maximize the conditional likelihood and obtain the conditional fixed-effects estimator, and are implemented in several econometric packages (e.g. Stata).2
1
See also Allison and Waterman (2002) or Cameron and Trivedi (1998)
2.2 Zero-inflated Poisson Model
It often happens that the data are characterized by a larger frequency of extra zeros than a P model or an NB model predicts, and that whether or not the outcome is zero is driven by different factors than the mean of the positive outcomes. A popular approach to account for these features of the data is the zero inflated Poisson regression model (ZIP; Lambert 1992). One way to present the ZIP distribution is as a mixture of the Poisson distribution (with probability p) and a degenerate distribution with point mass one at zero (with probability (1−p); see Johnson et al. 1992, or Lambert 1992). For a Poisson distribution with parameterµ, this gives the following probability mass function: f(y; ˜p, µ) = ( (1−p˜) + ˜p P o(0;µ) ify = 0, ˜ p P o(y;µ) ify = 1,2,3, . . . (8)
Here 0<p˜≤1. The Poisson distribution is the special case with ˜p= 1. If ˜
p < 1, the distribution has a larger probability of zero outcomes than the
corresponding Poisson distribution. It is easy to show that the mean and variance of this distribution are given by:
E(Y) = ˜p µ and V ar(Y) = ˜p µ+ ˜p(1−p˜)µ2 (9)
Thus the ZIP model also incorporates (a special form of) overdispersion: for ˜
p <1, the variance is larger than the mean.
A problem with the ZIP distribution written in this way is that there are two types of zeros: the extra zeros, and the zeros from the Poisson model. This makes it hard to say something about ˜pwithout also estimatingµ. This problem can be avoided by writing the ZIP distribution in an alternative way – as a mixture of a truncated Poisson distribution (with parameter
µ) and a degenerate distribution with all its mass at zero, with weights
p= ˜p[1−P o(0;µ)] and 1−p(see, e.g., Lee et al., 2002):
model in the sense that the individual effects and the covariates do not enter in exactly the same way; in particular, they influence the conditional variance in different manners; see Rabe-Hesketh and Skrondal (2008). As a consequence, it is possible in this model to estimate the coefficients of time invariant regressors.
f(y;p, µ) =
(
(1−p) ify= 0,
p P o(y;µ)/[1−P o(0;µ)] ify= 1,2,3, . . . (10)
The probability mass function of this distribution can also be written as:
f(y;p, µ) = (1−p) ify= 0, p exp(−µ)µ y y! [1−exp(−µ)] ify= 1,2,3, . . . (11)
This parametrization has the advantage that 1−p is simply the probability of outcome zero, while µ is now the parameter of the truncated Poisson distribution describing the non-zero outcomes. As a consequence, and as will be demonstrated below, it is more convenient to take this parametrization as the starting point of the econometric model than to take the parametrization with ˜p.
To obtain the (static) zero inflated panel data model, we specify p and
µfor each observation (i, t) as follows:
pit= exp(Xit0βp+αp i) 1 +exp(Xit0βp+αp i) (12) µit=exp(Xit0βµ+α µ i) (13)
We consider the fixed-effects version of the model – making no assump-tions on the individual effects αpi and αµi and treating them as nuisance parameters. The parameters of interest are βp and βµ. The parametersβp
determine which factors determine whether Yit is zero or not; equation (12
corresponds to an fixed effects logit model to explain this binary outcome. The parameters βµ determine the conditional distribution of Yit (and its
mean and variance) given that Yit is positive; equation (13) is similar to a
fixed effects truncated Poisson model for positive counts.
Estimation ofβpis straightforward, since whetherYitis positive or not is
now explained by a fixed-effects logit model. We can therefore estimateβp
using the standard conditional maximum likelihood estimator of Chamber-lain (1980). For the case of two time periods (as in our empirical example), this boils down to estimating a binary logit model explaining whether i
Yi1 = 0 and Yi2 >0 or Yi1 >0 and Yi2 = 0 (discarding all the other
obser-vations), with regressorsXi2−Xi1. The estimates of the slope coefficients
in this logit model are consistent estimates forβp.3
Estimation of βµ is less standard (and we do not know of studies that have estimated the corresponding truncated Poisson model with fixed ef-fects). We focus on the case of two time periods (t = 1,2), which is also what we have in our empirical example. First, we discard all observations with Yi1 = 0 orYi2=0. Second, we apply conditional maximum likelihood
on the remaining observations, conditioning on Yi1+Yi2. This is similar to
the usual conditional maximum likelihood for the FE Poisson model, but using the truncated Poisson distribution instead of the Poisson distribution. Starting from the truncated Poisson distribution with probabilities
P r(yit=k|Xit, αµi, yit>0) = µkitexp(−µit) k! (1−exp(−µit)) , (14) with k= 1,2, . . .; t= 1,2; µit=exp(x0itβµ+α µ i),
and using that outcomes in the two time periods are conditionally indepen-dent givenXit (and αµi), it can be easily shown that the conditional
likeli-hood contribution for an observationiwithyi1 =k >0 andyi2 =w−k >0,
conditional onXi1, Xi2, αµi,yi1+yi2 =w,yi1>0, andyi2 >0, is given by:
LCi = P(yit=k|yi1+yi2 =w, yi1>0, yi2 >0, Xi1, Xi2, αµi) = = w!µ k i1µ (w−k) i2 k! (n−k)! [(µi1+µi2)w−µwi1−µwi2] (15)
Withλit=exp(Xit0βµ) =µitexp(−αµi), this can also be written as
P(yit = k|yi1+yi2 =w, Xi1, Xi2) = = w!λ k i1λ (w−k) i2 k! (n−k)! [(λi1+λi2)w−λwi1−λwi2] (16)
The important thing here is that this expression no longer depends on
αµi: as in the FE-Poisson model (see Hausman et al. 1984, for example),
in this FE-truncated Poisson model, the sum of the outcomes yi1+yi2 is
a sufficient statistic for the individual effect αµi. As a consequence, this conditional maximum likelihood estimator maximizing P
LCi (where the
summation is over the subsample of observations withYi1 >0 andYi2 >0)
only involves maximization overβµand will be consistent for βµ.
The actual estimation can be done using maximum likelihood routines in Stata (see Gould et al. 2006). The syntax for the conditional likelihood to estimateβµ is given in the Appendix (in Stata 9).
The ZIP FE model combines two attractive features of count data mod-els. First, it makes it possible to account for fully flexible fixed individual effects in both equations of the model, whereas previous applications of the ZIP model have either used cross-sectional data, or (in a few cases) panel data models with random effects, which impose strong assumptions on the individual effects and are therefore more restrictive than our fixed-effects specification. For example, Wang et al. (2002) used a random effects ZIP model to account for inter-hospital variation in hospital stays within diag-nosis related groups, and Crepon and Duguet (1997) used a random effects ZIP model to analyze innovation in firms on the basis of the number of patents. To our knowledge our current study is the first time that fixed-effects are introduced in a ZIP setting. Second, the ZIP FE model has the same flexibility of the ZIP model for cross-section data in dealing with zero observations. While our derivations (and the Stata code in the Appendix) are for the case of two panel waves only, generalizing the estimator to the case of more than two waves is in principle straightforward. It requires much more notation and programming, however, and is therefore left for future work.
3
Data
This paper uses data from the Survey of Health, Ageing and Retirement in Europe (SHARE). SHARE is a multidisciplinary and cross-national panel survey of micro-level data on health, socio-economic status, and social and family networks of individuals aged 50 or over and their spouses and house-holds (see B¨orsch-Supan and J¨urges, 2005, for details on survey design and
methodological issues). The project started in 2004 (baseline study) in 11 European countries. In 2006 and 2007 the second wave has been carried out, extending the study to four additional countries: the Czech Republic, Ireland, Israel, and Poland. Since we are interested in the longitudinal di-mension of the data, we consider only the 11 countries with data in both waves: Austria, Belgium, Denmark, France, Germany, Greece, Italy, the Netherlands, Spain, Sweden, and Switzerland. The harmonized nature of the sample design and questionnaires ensures a good level of comparability across countries and over time.
The final sample consists of 34,350 observations – a balanced panel of 17,175 individuals observed in two years. The outcome variables represent-ing health care utilization that are used here are the number of doctor visits during the past twelve months (DOCT), the number of visits to a general practitioner during the past twelve months (GP), and the number of visits to a specialist and outpatient treatments in a clinic or an emergency room (SPOUTER) during the past twelve months. The variable SPOUTER has been obtained as the difference between the reported variables DOCT and GP. To be precise, DOCT and GP are the answers to the following ques-tions:4
• DOCT: “Since last year, about how many times in total have you seen or talked to a medical doctor about your health? Please exclude dentist visits and hospital stays, but include emergency room or outpatient clinic visits.” (0,. . . ,98).
• GP: “How many of these contacts were with a general practitioner or with a doctor at your health care center?” (0,. . . ,98).
Table 1 shows how the dependent and independent variables used in our analysis are defined. As independent variables, we use individual charac-teristics that are commonly considered to explain the demand for health care (see, for example, Lee and Kobayashi, 2001). The socio-economic char-acteristics include the logarithm of family income adjusted for household
size (LOGINCOME),5 and occupational status, categorized as employed (EMP), retired (RETIRED), and not employed (NOTEMP; the base cate-gory).6 Gender (FEM), age (AGE), controls for educational qualifications (low education (EDUQUAL1) is used as the base category; EDUQUAL2 is a dummy for intermediate education level, and EDUQUAL3 for high education level), and country dummies are added to those models where time invariant regressors can be included (Austria is used as the bench-mark country; ten dummies are used for the other countries).7 Household composition is controlled for using a dummy for living with a partner or having a spouse (MSTAT2, with living as a single (never married, divorced, or widowed) as the base category). Health status variables considered are: a dummy whether the individual considers his health to be less than good (SPHS), and dummy variables for the prevalence of at least two chronic con-ditions (CHRONIC), one ore more limitations with activity of daily living (ADL), and one or more physical limitations (MOBILIT). These variables summarize the rich information on health that is available in the survey; we experimented with larger sets of health indicators but this did not change the qualitative results and we therefore decided to present the results for this parsimonious specification.8
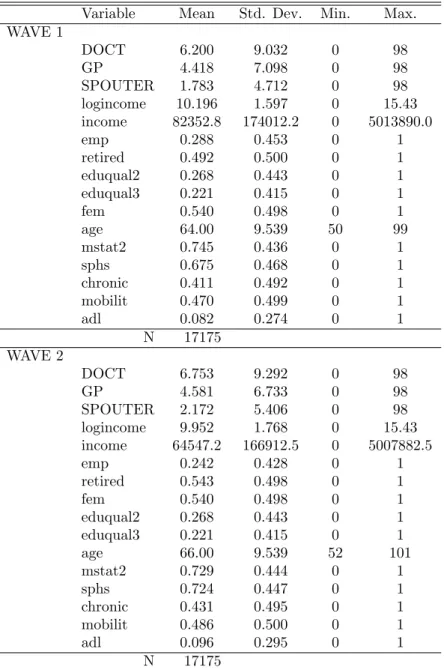
Table 2 shows summary statistics of our estimation sample for each of the two waves. The changes in the means from wave 1 to wave 2 are all in line with the notion that respondents in this balanced sample are older and less healthy in wave 2 than in wave 1. In the second wave, they are more often retired and less often employed, have lower income, are more likely to have lost their spouse, more often have health problems, and more often visit a doctor than in the first wave. In all cases, the three outcome variables
5Total household income has been divided by the square root of household size; the
im-putations provided by the SHARE team were used to replace missing values (see Christelis, 2011).
6
We also controlled for household wealth, but this was never significant; we therefore excluded it from the final model. Results are available upon request.
7
This refers to the pooled and random effects models, see Section 4; of course AGE is time varying but age differences are multi-collinear with the time dummy.
8We treat health as exogenous and do not address potential endogeneity problems.
Some support for this assumption os given by Windmeijer and Santos da Silva who do not reject exogeneity of health for UK cross-section data on doctor visits.
DOCT, GP, and SPOUTER, present evidence of strong overdispersion, with the unconditional variance being much larger than the mean, something that would not be captured by standard Poisson models for each cross-section, as discussed in Section 2.
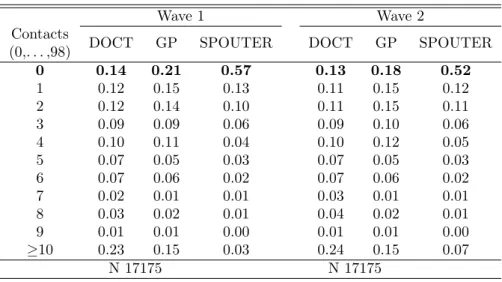
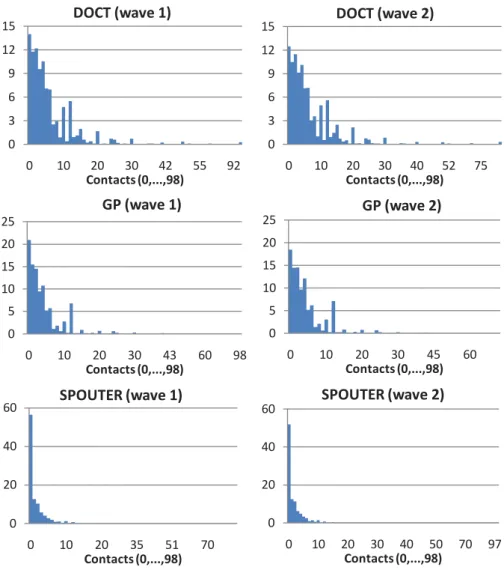
Table 3 and Figure 1 show the distribution of the three outcome vari-ables. The maximum number of consultations is 98 for each of the three services. This is the maximum number that can be reported; respondents with more than 98 visits are also coded as 98. It can be seen that, especially for SPOUTER visits, there is a large number of zeros, with more than 50% of the respondents reporting zero visits in both waves. For DOCT and GP visits the distribution is less skewed than for the SPOUTER distribution, but still, a large number of zeros is found in both cases (almost 15% and 20% of zero counts, respectively). The fraction of zeros is always much larger than the fraction implied by a Poisson distribution with parameter equal to the total sample mean in Table 2, suggesting that there may be a separate process underlying the first contact decision, which is different from the second stage process determining the number of visits once the contact has been made.
In this situation of highly overdispersed data and a large frequency of extra zeros in the distribution, the traditional count data models, such as the P and the NB, may not be appropriate to fit the health care utilization data, and their zero-inflated variants may be more appropriate. On the other hand, overdispersion and zeros can also be explained by individual effects, and the extent to which they do is not something that can be derived directly from the raw data. The next section will address this by comparing the estimates of various panel data models, focusing on the ZIP FE model introduced in Section 2.
4
Application to Health Care Utilization Data:
Results
This section presents the estimation results for several cross-section and panel data versions (pooled, random effects, and fixed-effects) of the P and the NB model, and for the ZIP FE model introduced in Section 2. All models
use the same estimation sample of 34,350 observations (the balanced panel of 17,175 individuals observed twice) described in the previous section.
4.1 Poisson and Negative Binomial Models
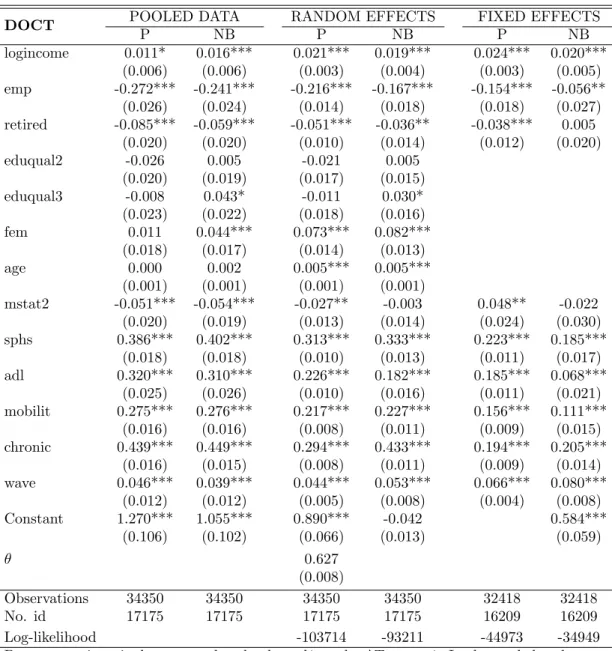
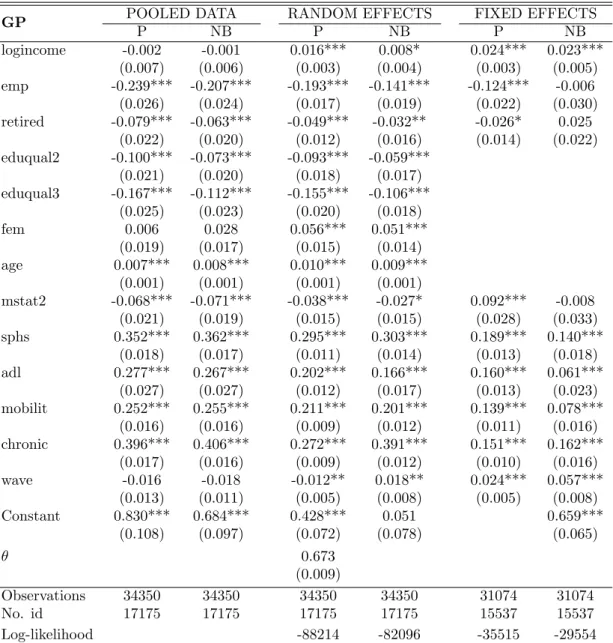
Tables 4, 5, and 6 show the estimation results for the three types of health care services that we consider. The models used in these tables have all been presented in Section 2.
It is interesting to compare the results for the panel data models to the results for the P and NB with pooled data both for the estimates obtained and also the precision of the estimates. The parameter estimates generally seem more precise in the random effects panel data models, which have smaller standard errors. This may be because the pooled “pseudo maximum likelihood” estimates are consistent but inefficient if the RE model is the correct specification, while the maximum likelihood estimates of the RE model are (asymptotically) efficient. Most of the estimated coefficients have the same sign in the three models, but there are a few notable exceptions.
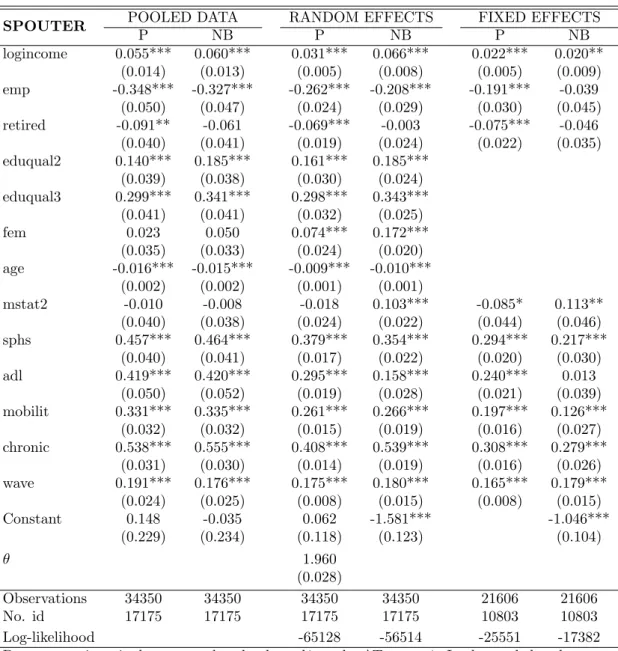
Logincome has a positive and significant effect according to all fixed-effects specifications and in most random fixed-effects specifications. The positive effect of log income is in line with the findings of Bago d’Uva (2006) for US data; on the other hand, Deb and Trivedi (1997) who consider various types of health care demand by the elderly in the US and Lee and Kobayashi (2001) who analyze doctor visits do not find a significant income effect, and Windmeijer and Santos da Silva find significantly negative effects in the UK. In the pooled and the random effects NB model for GP visits, however, logincome is not significant, and also in the RE Poisson model, the effect of income is much smaller than according to the fixed effects models. This suggests that individual effects are negatively correlated with log income, leading to a negative bias in the Pooled and RE estimates: the same unobserved characteristics that raise income also make respondents less likely to visit a GP. The opposite is found for specialist and outpatient visits, where the income effect in the pooled and random effects models is substantially larger than in the fixed effects models. According to the FE models, the elasticities of the expected number of visits are rather small:
between 0.020 and 0.024 for all three types of treatments.
According to most models, employed respondents use significantly less health care than retired and other non-employed respondents, and the re-tired use less care than other non-employed respondents (the benchmark). These differences are typically much larger according to the pooled and ran-dom effects models than according to the fixed effects models, particularly the fixed effects NB model where retired and other non-employed are not significantly different.
Marital status (MSTAT2) also changes sign. It has a negative and often significant effect in the pooled and in most random effects specifications, but becomes significantly positive in three of the six fixed effects specifications (and in one of the RE models). This might suggest that individual effects are negatively correlated with being married, but the differences between the various RE estimates and between the various FE estimates suggest that other types of misspecification also lead to biases.
The estimated coefficients of the health variables have the same sign and significance in the three models, always showing that health problems lead to more use of health care facilities, as expected. Education (which is time invariant and therefore not included in the fixed effects models) has no significant relation with doctor visits, has a negative association with GP visits effect, and a positive association with specialist and outpatient visits. Bago d’Uva (2006) also finds a significant positive effect of education on outpatient visits; Deb and Trivedi (1997) find significant positive effects of education on several types of health care use. This can be a causal effect but may also be due to unobserved heterogeneity – common unobserved factors driving education as well as health care use. Gender differences are significant in the RE models (but not in the pooled models), suggesting that women search more health care than men. This is in line with the existing studies of Bago d’Uva (2006) and Windmeijer and Santos da Silva (1997), while Deb and Trivedi (1997) find mixed results.
Age is not time invariant but the time variation in age is perfectly cor-related with the wave dummy, so that age cannot be included in the FE models either. According to the RE models visits to the GP increase but
specialist and outpatient visits fall with age. The wave dummies are always significantly positive in the FE models (and also in most pooled and most RE models), but in the FE models, due to the same collinearity, we cannot say whether this is a time effect or a genuine age effects.
Finally, the tables show that in the NB model the overdispersion param-eterθis particularly large in the SPOUTER visits case, where the difference between the variance and the mean was the largest (see Table 2).
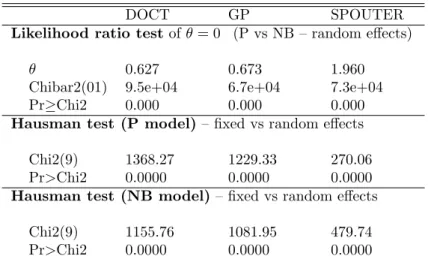
Tables 7 presents the model selection tests. To assess which model be-tween P and NB (random effects) performs better, the significance of the
θ parameter can be tested by a likelihood ratio test (since the two models are nested), with H0 :θ = 0 versus H1 : θ 6= 0. For all three health care
services analyzed,θis significantly different from zero, implying that NB is preferred over P. We use a Hausman test to choose between random and fixed-effects models (for both P and NB and for all three health care ser-vices). The Hausman test tests the null hypothesis that the random effects assumptions on the individual effects are valid, against the fixed-effects al-ternative without assumptions on the individual effects. The small p-values in the table indicate that random effects models are rejected against the corresponding fixed-effects models in all cases, implying that fixed-effects models are always preferred.
4.2 ZIP FE
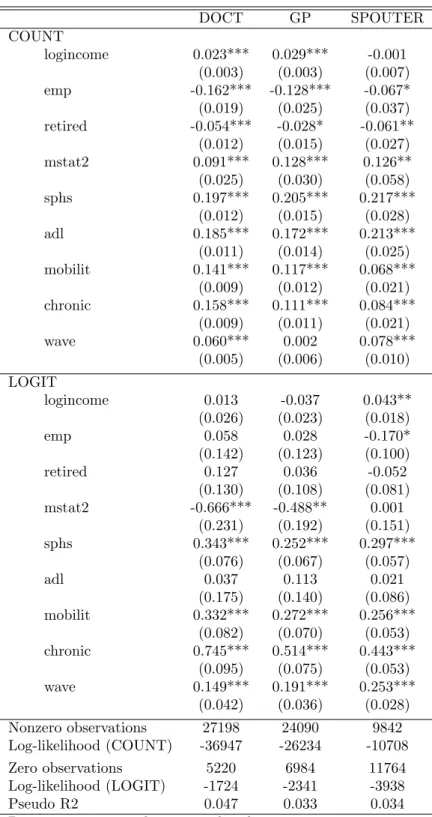
Table 8 shows the estimates of the parameters of the model ZIP FE. As explained in Section 2, the ZIP FE generates two separate models. First, a count data model predicts counts of the truncated Poisson model for re-spondents with at least one visit. Second, a fixed-effects logit model is used to explain whether an outcome is zero or not. This model uses only the transitions from zero to a positive outcome or the reverse. If we look at Table 8, the first part ‘COUNT’ is the response variable (DOCT, or GP, or SPOUTER) predicted by the truncated model estimated by conditional maximum likelihood, and the second part ‘LOGIT’ refers to the logistic model predicting whether a respondent is likely to have at least one visit in a given year.
We first look at the ‘COUNT’ portion of the output, which refers to the respondents who have at least one consultation per year. The effect of income on the number of DOCT visits in a year is significantly positive (holding all other variables in the model constant) and the effect is similar in size to the effect in the fixed-effect models in Table 4. The same is for GP visits, with an increase of GP consultations in a year by a factor of about
exp(0.029) = 1.029 for every unit increase in the logincome. The income effect is not significant and virtually equal to zero for SPOUTER visits. If we compare it with the models in the previous section, we see that the sign is the same that we had in the fixed-effects models, with the exception of SPOUTER, where coefficients were positive and significant. If we look at the ‘LOGIT’ portion of the output, which predicts whether outcomes are positive or zero, we find a significant effect for SPOUTER only: the higher a respondent’s logincome, the more likely the respondent will have a visit. The estimated marginal effect of a 10 percent income increase for an average respondent (with probability 0.48 that SPOUTER is positive) is about 0.10*0.043*0.48*(1-0.48)*100% = 0.11 percentage points.
We can compare the income effects in the two parts of our hurdle model with the effects found in cross-section hurdle models by Winkelmann (2004) for doctor visits in Germany and Bago d’Uva (2006) for outpatient visits in the US. Winkelmann (2004, Table IV) finds a significant negative effect of income on the probability of at least one doctor visit, and a marginally significant positive effect on the expected number of doctor visits. Bago d’Uva (2006, Table 1) finds a significant positive effect of log income on the probability of at least one outpatient visit, and a marginally significant positive effect on the expected number of outpatient visits. Two of these four findings are in line with our findings. Of course there may be various reasons for the differences, not only the fixed effects nature of our model, but also the difference in age group considered or the country considered.
The estimated coefficients for MSTAT2 are positive and significant for the number of visits, in line with the fixed-effects models in the previous section, whereas in both the pooled and the random effects panel models these coefficients were negative and significant. Respondents who are
mar-ried or living with a partner tend to visit a doctor more often than single respondents, once they have decided to go at least once (keeping all other variables in the model constant). In the ‘LOGIT’ part of the model, how-ever, we find the opposite effect: a non-single-respondent is less likely to have a DOCT or a GP consultation than a single respondent with identical scores for the other predictors. This is an example where the effect in the two equations is quite different, supporting the use of the ZIP model which has the flexibility to capture this.
All the other variables are consistent with the models presented in the previous section for the ‘COUNT’ part of the model. Occupational status is not significant in the ‘LOGIT’ portion of the model. If we look at the ‘COUNT’ portion of the model, an employed (retired) respondent decreases her SPOUTER visits by exp(0.067) = 1.07 (exp(0.061) = 1.06) compared to a respondent who is nor employed neither retired, everything else being the same. Health status is positive and significant for all estimated coef-ficients in both the ‘COUNT’ and the ‘LOGIT’ model portions (where a higher score in the health status variable, means a worse health status for the respondent), with the exception of ADL that is not significant for the zero/positive decision.
All in all we find a strong income-health care visit gradient for the number of visits given that this is positive for DOCT and GP, while the income effect is absent in the ‘LOGIT’ portion of the model. In SPOUTER visits we find the opposite, the income-health care visit gradient is in the decision to have at least one visit or not.
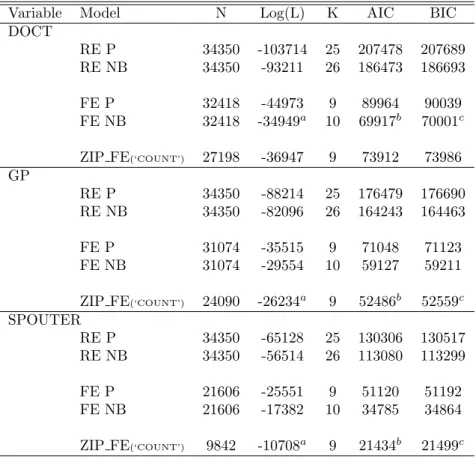
Table 9 shows the log-likelihood, AIC and BIC (respectively, Akaike and Schwarz information criteria) for the estimated models. The information criteria AIC and BIC are used in comparison of non-nested models, where a log-likelihood test cannot be performed. The ZIP FE model outperforms all the alternative models for GP and SPOUTER, whereas the fixed-effects NB should be preferred over the other models for DOCT visits. This results are also in line with Table 3, where we showed excess zeros for both GP and SPOUTER.
5
Conclusions
In this paper we defined and estimated a zero-inflated Poisson model with fixed-effects to identify respondent- and health-related characteristics asso-ciated with health care demand using a two-wave panel. This is a new model that is proposed to model count measures of health care utilization and ac-count for the panel structure of the data. The estimation method and syntax developed in this paper can accommodate ZIP models with fixed-effects in both the logistic (already available in Stata) and the truncated Poisson part (for which we have developed the syntax). The computer program for the maximum likelihood estimation in Stata provides a flexible tool for analyz-ing the health care service count variables. We find that controllanalyz-ing for the portion of respondents that are certain zeros in one of the two years of the two waves does make a difference for counts with a larger number of zeros, where traditional count data models are not able to disentangle the effects. All in all we find a strong income-health care visit gradient for the “non certain zeros” group for DOCT and GP, while the income effect is absent in the “certain zeros” group. In SPOUTER visits we find the opposite, the income-health care visit gradient is in the “certain zeros” group. In general, the previous applications of the ZIP model have used cross-sectional data, with a few exceptions to random effects. To our knowledge this is the first time that fixed-effects are introduced in a ZIP setting. The ZIP FE model has some attractive features. It makes it possible to account for individual effect in panel data: fixed-effects can explain overdispersion, where P model can not. It allows the correction for extra zeros defining two latent classes of low users in the probability of visiting a doctor, and high users in the conditional positive number of visits. Extending the estimator and the esti-mation algorithm to the case of more than two time periods and developing model selection tests will be further steps in future research developments.
References
Allison PD, and Waterman RP. 2002. Fixed-effects negative binomial regression models. Sociological Methodology 32 : 247–265.
Atella V, Brindisi F, Deb P, and Rosati FC. 2003. Determinants of access to physician service in Italy: A latent class simingly unrelated probit approach. Research Paper Series CEIS Tor Vergata 12.
Bago d’Uva T. 2006. Latent class models for utilisation of health care. Health Economics 15 : 329–343.
Bago d’Uva T, Jones AM, and Doorslaer E van. 2007. Measurements of horizon-tal inequity in health care utilisation using European Panel Data. HEDG Working Paper 07/17.
B¨ohning D. 1998. Zero-inflated Poisson models and C.A.Man: a tutorial collection of evidence. Biometrical Journal 40 : 833–843.
B¨orsch-Supan A, and J¨urges H. 2005. The Survey of Health, Aging, and Re-tirement in Europe Methodology. Mannheim Research Institute for the Economics of Aging: MEA.
Cameron C, and Trivedi PK. 1998. Regression analysis of count data. Econometric Society Monographs Cambridge University Press: Cambridge, UK.
Cameron C, and Trivedi PK. 2005. Microeconometrics: Methods and Applica-tions. Econometric Society Monographs Cambridge University Press: New York.
Chamberlain G. 1980. Analysis of covariance with qualitative data. Review of Economic Studies 47 : 225-238.
Chamberlain G. 1984. Panel data. Handbook of econometrics. Griliches A and Intriligator MD Eds.: North-Holland, Amsterdam. Vol. 2: 1247-1318. Christelis D. 2011. Imputation of missing data in waves 1 and 2 of SHARE.
http://www.share-project.org.
Crepon B, and Duguet E. 1997. Research and development, competition and in-novation. Pseudo maximum likelihood and simulated maximum likelihood methods applied to count data models with heterogeneity. Journal of Econo-metrics 79 : 355–378.
Deb P, and Holmes AM. 2000. Estimates of use and costs of behavioural health care: A comparison of standard and finite mixture models. Health Economics 9 : 475–489.
Deb P, and Trivedi PK. 1997. Demand for medical care by the elderly: A finite mixture approach. Journal of Applied Econometrics 12 : 313–336.
Deb P, and Trivedi PK. 2002. The structure for demand for health care: Latent class versus two-part models. Journal of Health Economics 21 : 601–625. Fabbri D, and Monfardini C. 2002. Public vs. private health care services demand
Gould W, Pitblado J, and Sribney W. 2006. Maximum likelihood estimation with Stata. Stata Corporation.
Greene W. 2008. Functional forms for the negative binomial model for count data. Economic Letters 99 : 585–590.
Guimaraes P. 2008. The fixed-effects negative binomial model revisited. Economic Letters 99 : 63–66.
Hausman JA, Hall BH, and Griliches Z. 1984. Econometric models for count data with an application to the patents-R&D relationship. Econometrica 524 : 909–938.
Hausman JA. 1978. Specification Tests in Econometrics. Econometrica 466 : 1251-1271.
Jimenez-Martin S, Labeaga JM, and Martinez-Granado M. 2002. Latent class versus two-part models in the demand for physicians services across the Eu-ropean Union. Health Economics 11 : 301–321.
Johnson N, Kotz S, and Kemp AW. 1992. Univariate discrete distributions. Wiley: New York.
Lambert D. 1992. Zero-inflated Poisson regression, with an application to defects in manufacturing. Technometrics 34 : 1–14.
Lee M, and Kobayashi S. 2001. Proportional treatment effects for count response panel data: Effects of binary exercise on health care demand. Health Eco-nomics 10 : 411–428.
Lee AH, Stevenson MR, Wang K, and Yau KKW. 2002. Modeling young driver motor vehicle crashes: data with extra zeros. Accid. Anal. Prev. 34 : 515– 521.
Pohlmeier W, and Ulrich V. 1995. An econometric model of the two-part decision making process in the demand for health care. Journal of Human Resources 30 : 339–361.
Rabe-Hesketh S, and Skrondal A. 2008. Multilevel and longitudinal modeling using Stata. Stata Corporation.
Vuong QH. 1989. Likelihood ratio tests for model selection and non nested hy-potheses. Econometrica 57 : 307–333.
Wang K, Yau KWK, and Lee AH. 2002. A zero-inflated Poisson mixed model to analyze diagnosis related groups with majority of same-day hospital stays. Computer Methods and Programs in Biomedicine 68 : 195–203.
Windmeijer FAG, and Santos Silva JMC. 1997. Endogeneity in count data models: an application to demand for health care. Journal of Applied Econometrics 12 : 281-294.
Winkelmann R. 2003. Econometric Analysis of Count Data. 4th edition. Springer-Verlag: Berlin.
Winkelmann R. 2004. Health care reform and the number of doctor visits – an econometric analysis. Journal of Applied Econometrics 19 : 455–472. Wooldridge J. 2002. Econometric Analysis of Cross-section and Panel Data.
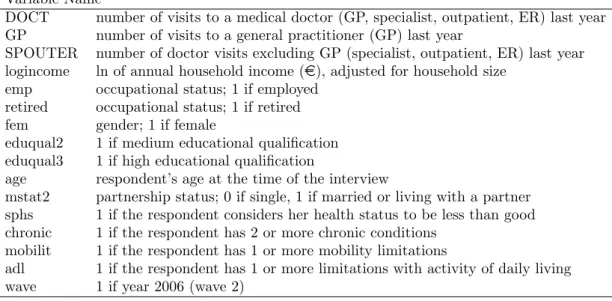
Table 1: Variables Definition
Variable Name
DOCT number of visits to a medical doctor (GP, specialist, outpatient, ER) last year GP number of visits to a general practitioner (GP) last year
SPOUTER number of doctor visits excluding GP (specialist, outpatient, ER) last year logincome ln of annual household income (e), adjusted for household size
emp occupational status; 1 if employed retired occupational status; 1 if retired fem gender; 1 if female
eduqual2 1 if medium educational qualification eduqual3 1 if high educational qualification
age respondent’s age at the time of the interview
mstat2 partnership status; 0 if single, 1 if married or living with a partner sphs 1 if the respondent considers her health status to be less than good chronic 1 if the respondent has 2 or more chronic conditions
mobilit 1 if the respondent has 1 or more mobility limitations
adl 1 if the respondent has 1 or more limitations with activity of daily living wave 1 if year 2006 (wave 2)
Table 2: Summary Statistics by Wave – Full Sample
Variable Mean Std. Dev. Min. Max. WAVE 1 DOCT 6.200 9.032 0 98 GP 4.418 7.098 0 98 SPOUTER 1.783 4.712 0 98 logincome 10.196 1.597 0 15.43 income 82352.8 174012.2 0 5013890.0 emp 0.288 0.453 0 1 retired 0.492 0.500 0 1 eduqual2 0.268 0.443 0 1 eduqual3 0.221 0.415 0 1 fem 0.540 0.498 0 1 age 64.00 9.539 50 99 mstat2 0.745 0.436 0 1 sphs 0.675 0.468 0 1 chronic 0.411 0.492 0 1 mobilit 0.470 0.499 0 1 adl 0.082 0.274 0 1 N 17175 WAVE 2 DOCT 6.753 9.292 0 98 GP 4.581 6.733 0 98 SPOUTER 2.172 5.406 0 98 logincome 9.952 1.768 0 15.43 income 64547.2 166912.5 0 5007882.5 emp 0.242 0.428 0 1 retired 0.543 0.498 0 1 fem 0.540 0.498 0 1 eduqual2 0.268 0.443 0 1 eduqual3 0.221 0.415 0 1 age 66.00 9.539 52 101 mstat2 0.729 0.444 0 1 sphs 0.724 0.447 0 1 chronic 0.431 0.495 0 1 mobilit 0.486 0.500 0 1 adl 0.096 0.295 0 1 N 17175
Table 3: Fraction of Respondents with Zero and Non-Zero Visits
Wave 1 Wave 2
Contacts
DOCT GP SPOUTER DOCT GP SPOUTER (0,. . . ,98) 0 0.14 0.21 0.57 0.13 0.18 0.52 1 0.12 0.15 0.13 0.11 0.15 0.12 2 0.12 0.14 0.10 0.11 0.15 0.11 3 0.09 0.09 0.06 0.09 0.10 0.06 4 0.10 0.11 0.04 0.10 0.12 0.05 5 0.07 0.05 0.03 0.07 0.05 0.03 6 0.07 0.06 0.02 0.07 0.06 0.02 7 0.02 0.01 0.01 0.03 0.01 0.01 8 0.03 0.02 0.01 0.04 0.02 0.01 9 0.01 0.01 0.00 0.01 0.01 0.00 ≥10 0.23 0.15 0.03 0.24 0.15 0.07 N 17175 N 17175
! " # $ %& %'
! %! &! "! (& '' $&
!"#$%&$'()*+,,,+-./ 01!2()3%45(6/ ! ' %! %' &! &' ! %! &! "! (" #! $) !"#$%&$'()*+,,,+-./ 78()3%45(6/ ! &! (! #! ! %! &! "' '% *! !"#$%&$'()*+,,,+-./ 981:2;<()3%45(6/ ! " # $ %& %' ! %! &! "! (! '& *' !"#$%&$'()*+,,,+-./ 01!2()3%45(=/ ! ' %! %' &! &' ! %! &! "! (' #! !"#$%&$'()*+,,,+-./ 78()3%45(=/ ! &! (! #! ! %! &! "! (! '! *! $* !"#$%&$'()*+,,,+-./ 981:2;<()3%45(=/
Table 4: Doctor Visits
DOCT POOLED DATA RANDOM EFFECTS FIXED EFFECTS
P NB P NB P NB logincome 0.011* 0.016*** 0.021*** 0.019*** 0.024*** 0.020*** (0.006) (0.006) (0.003) (0.004) (0.003) (0.005) emp -0.272*** -0.241*** -0.216*** -0.167*** -0.154*** -0.056** (0.026) (0.024) (0.014) (0.018) (0.018) (0.027) retired -0.085*** -0.059*** -0.051*** -0.036** -0.038*** 0.005 (0.020) (0.020) (0.010) (0.014) (0.012) (0.020) eduqual2 -0.026 0.005 -0.021 0.005 (0.020) (0.019) (0.017) (0.015) eduqual3 -0.008 0.043* -0.011 0.030* (0.023) (0.022) (0.018) (0.016) fem 0.011 0.044*** 0.073*** 0.082*** (0.018) (0.017) (0.014) (0.013) age 0.000 0.002 0.005*** 0.005*** (0.001) (0.001) (0.001) (0.001) mstat2 -0.051*** -0.054*** -0.027** -0.003 0.048** -0.022 (0.020) (0.019) (0.013) (0.014) (0.024) (0.030) sphs 0.386*** 0.402*** 0.313*** 0.333*** 0.223*** 0.185*** (0.018) (0.018) (0.010) (0.013) (0.011) (0.017) adl 0.320*** 0.310*** 0.226*** 0.182*** 0.185*** 0.068*** (0.025) (0.026) (0.010) (0.016) (0.011) (0.021) mobilit 0.275*** 0.276*** 0.217*** 0.227*** 0.156*** 0.111*** (0.016) (0.016) (0.008) (0.011) (0.009) (0.015) chronic 0.439*** 0.449*** 0.294*** 0.433*** 0.194*** 0.205*** (0.016) (0.015) (0.008) (0.011) (0.009) (0.014) wave 0.046*** 0.039*** 0.044*** 0.053*** 0.066*** 0.080*** (0.012) (0.012) (0.005) (0.008) (0.004) (0.008) Constant 1.270*** 1.055*** 0.890*** -0.042 0.584*** (0.106) (0.102) (0.066) (0.013) (0.059) θ 0.627 (0.008) Observations 34350 34350 34350 34350 32418 32418 No. id 17175 17175 17175 17175 16209 16209 Log-likelihood -103714 -93211 -44973 -34949
Base categories: single, not employed, eduqual1, male, AT, wave 1. In the pooled and random effect models country dummies are included but not reported. Results are available upon request. In P and NB fixed-effects only time varying regressors can be included. Standard errors in parentheses, adjusted for clustering on 17175 id in the pooled model. *** p<0.01, ** p<0.05, * p<0.1.
Table 5: GP Visits
GP POOLED DATA RANDOM EFFECTS FIXED EFFECTS
P NB P NB P NB logincome -0.002 -0.001 0.016*** 0.008* 0.024*** 0.023*** (0.007) (0.006) (0.003) (0.004) (0.003) (0.005) emp -0.239*** -0.207*** -0.193*** -0.141*** -0.124*** -0.006 (0.026) (0.024) (0.017) (0.019) (0.022) (0.030) retired -0.079*** -0.063*** -0.049*** -0.032** -0.026* 0.025 (0.022) (0.020) (0.012) (0.016) (0.014) (0.022) eduqual2 -0.100*** -0.073*** -0.093*** -0.059*** (0.021) (0.020) (0.018) (0.017) eduqual3 -0.167*** -0.112*** -0.155*** -0.106*** (0.025) (0.023) (0.020) (0.018) fem 0.006 0.028 0.056*** 0.051*** (0.019) (0.017) (0.015) (0.014) age 0.007*** 0.008*** 0.010*** 0.009*** (0.001) (0.001) (0.001) (0.001) mstat2 -0.068*** -0.071*** -0.038*** -0.027* 0.092*** -0.008 (0.021) (0.019) (0.015) (0.015) (0.028) (0.033) sphs 0.352*** 0.362*** 0.295*** 0.303*** 0.189*** 0.140*** (0.018) (0.017) (0.011) (0.014) (0.013) (0.018) adl 0.277*** 0.267*** 0.202*** 0.166*** 0.160*** 0.061*** (0.027) (0.027) (0.012) (0.017) (0.013) (0.023) mobilit 0.252*** 0.255*** 0.211*** 0.201*** 0.139*** 0.078*** (0.016) (0.016) (0.009) (0.012) (0.011) (0.016) chronic 0.396*** 0.406*** 0.272*** 0.391*** 0.151*** 0.162*** (0.017) (0.016) (0.009) (0.012) (0.010) (0.016) wave -0.016 -0.018 -0.012** 0.018** 0.024*** 0.057*** (0.013) (0.011) (0.005) (0.008) (0.005) (0.008) Constant 0.830*** 0.684*** 0.428*** 0.051 0.659*** (0.108) (0.097) (0.072) (0.078) (0.065) θ 0.673 (0.009) Observations 34350 34350 34350 34350 31074 31074 No. id 17175 17175 17175 17175 15537 15537 Log-likelihood -88214 -82096 -35515 -29554
Base categories: single, not employed, eduqual1, male, AT, wave 1. In the pooled and random effect models country dummies are included but not reported. Results are available upon request. In P and NB fixed-effects only time varying regressors can be included. Standard errors in parentheses, adjusted for clustering on 17175 id in the pooled model. *** p<0.01, ** p<0.05, * p<0.1.
Table 6: Specialist, Outpatient, and Emergency Room Visits
SPOUTER POOLED DATA RANDOM EFFECTS FIXED EFFECTS
P NB P NB P NB logincome 0.055*** 0.060*** 0.031*** 0.066*** 0.022*** 0.020** (0.014) (0.013) (0.005) (0.008) (0.005) (0.009) emp -0.348*** -0.327*** -0.262*** -0.208*** -0.191*** -0.039 (0.050) (0.047) (0.024) (0.029) (0.030) (0.045) retired -0.091** -0.061 -0.069*** -0.003 -0.075*** -0.046 (0.040) (0.041) (0.019) (0.024) (0.022) (0.035) eduqual2 0.140*** 0.185*** 0.161*** 0.185*** (0.039) (0.038) (0.030) (0.024) eduqual3 0.299*** 0.341*** 0.298*** 0.343*** (0.041) (0.041) (0.032) (0.025) fem 0.023 0.050 0.074*** 0.172*** (0.035) (0.033) (0.024) (0.020) age -0.016*** -0.015*** -0.009*** -0.010*** (0.002) (0.002) (0.001) (0.001) mstat2 -0.010 -0.008 -0.018 0.103*** -0.085* 0.113** (0.040) (0.038) (0.024) (0.022) (0.044) (0.046) sphs 0.457*** 0.464*** 0.379*** 0.354*** 0.294*** 0.217*** (0.040) (0.041) (0.017) (0.022) (0.020) (0.030) adl 0.419*** 0.420*** 0.295*** 0.158*** 0.240*** 0.013 (0.050) (0.052) (0.019) (0.028) (0.021) (0.039) mobilit 0.331*** 0.335*** 0.261*** 0.266*** 0.197*** 0.126*** (0.032) (0.032) (0.015) (0.019) (0.016) (0.027) chronic 0.538*** 0.555*** 0.408*** 0.539*** 0.308*** 0.279*** (0.031) (0.030) (0.014) (0.019) (0.016) (0.026) wave 0.191*** 0.176*** 0.175*** 0.180*** 0.165*** 0.179*** (0.024) (0.025) (0.008) (0.015) (0.008) (0.015) Constant 0.148 -0.035 0.062 -1.581*** -1.046*** (0.229) (0.234) (0.118) (0.123) (0.104) θ 1.960 (0.028) Observations 34350 34350 34350 34350 21606 21606 No. id 17175 17175 17175 17175 10803 10803 Log-likelihood -65128 -56514 -25551 -17382
Base categories: single, not employed, eduqual1, male, AT, wave 1. In the pooled and random effect models country dummies are included but not reported. Results are available upon request. In P and NB fixed-effects only time varying regressors can be included. Standard errors in parentheses, adjusted for clustering on 17175 id in the pooled model. *** p<0.01, ** p<0.05, * p<0.1.
Table 7: Model Selection
DOCT GP SPOUTER
Likelihood ratio test ofθ= 0 (P vs NB – random effects)
θ 0.627 0.673 1.960
Chibar2(01) 9.5e+04 6.7e+04 7.3e+04 Pr≥Chi2 0.000 0.000 0.000
Hausman test (P model) – fixed vs random effects Chi2(9) 1368.27 1229.33 270.06 Pr>Chi2 0.0000 0.0000 0.0000
Hausman test (NB model) – fixed vs random effects Chi2(9) 1155.76 1081.95 479.74 Pr>Chi2 0.0000 0.0000 0.0000
Table 8: ZIP FE DOCT GP SPOUTER COUNT logincome 0.023*** 0.029*** -0.001 (0.003) (0.003) (0.007) emp -0.162*** -0.128*** -0.067* (0.019) (0.025) (0.037) retired -0.054*** -0.028* -0.061** (0.012) (0.015) (0.027) mstat2 0.091*** 0.128*** 0.126** (0.025) (0.030) (0.058) sphs 0.197*** 0.205*** 0.217*** (0.012) (0.015) (0.028) adl 0.185*** 0.172*** 0.213*** (0.011) (0.014) (0.025) mobilit 0.141*** 0.117*** 0.068*** (0.009) (0.012) (0.021) chronic 0.158*** 0.111*** 0.084*** (0.009) (0.011) (0.021) wave 0.060*** 0.002 0.078*** (0.005) (0.006) (0.010) LOGIT logincome 0.013 -0.037 0.043** (0.026) (0.023) (0.018) emp 0.058 0.028 -0.170* (0.142) (0.123) (0.100) retired 0.127 0.036 -0.052 (0.130) (0.108) (0.081) mstat2 -0.666*** -0.488** 0.001 (0.231) (0.192) (0.151) sphs 0.343*** 0.252*** 0.297*** (0.076) (0.067) (0.057) adl 0.037 0.113 0.021 (0.175) (0.140) (0.086) mobilit 0.332*** 0.272*** 0.256*** (0.082) (0.070) (0.053) chronic 0.745*** 0.514*** 0.443*** (0.095) (0.075) (0.053) wave 0.149*** 0.191*** 0.253*** (0.042) (0.036) (0.028) Nonzero observations 27198 24090 9842 Log-likelihood (COUNT) -36947 -26234 -10708 Zero observations 5220 6984 11764 Log-likelihood (LOGIT) -1724 -2341 -3938 Pseudo R2 0.047 0.033 0.034
Base categories: single, not employed, wave 1.
Table 9: Log Likelihood and Information Criteria for Estimated Models
Variable Model N Log(L) K AIC BIC
DOCT RE P 34350 -103714 25 207478 207689 RE NB 34350 -93211 26 186473 186693 FE P 32418 -44973 9 89964 90039 FE NB 32418 -34949a 10 69917b 70001c ZIP FE(‘COUNT’) 27198 -36947 9 73912 73986 GP RE P 34350 -88214 25 176479 176690 RE NB 34350 -82096 26 164243 164463 FE P 31074 -35515 9 71048 71123 FE NB 31074 -29554 10 59127 59211 ZIP FE(‘COUNT’) 24090 -26234a 9 52486b 52559c SPOUTER RE P 34350 -65128 25 130306 130517 RE NB 34350 -56514 26 113080 113299 FE P 21606 -25551 9 51120 51192 FE NB 21606 -17382 10 34785 34864 ZIP FE(‘COUNT’) 9842 -10708a 9 21434b 21499c Notes: RE, random effects; FE, fixed-effects; AIC, Akaike information
criterion:AIC=−2log(L) + 2K; BIC, Schwarz information
criterion:BIC=−2log(L) +K log(N); whereLis the maximized log likelihood of the model,Kis the number of parameters; and N is the number of observations. [a] Model with the bigger log likelihood value; [b] Model preferred by AIC; [c] Model preferred by BIC.
A
Stata Syntax for ZIP FE Model
The syntax below shows how to estimate a ZIP fixed-effects model (ZIP FE) via conditional maximum likelihood with Stata. You need to know how to use the optimization tool in Stata, see Gould et al. (2006).
set more off
capture program drop ZIP_FE_model program define ZIP_FE_model version 9.1
args todo b lnf
tempvar theta1 lambda last nonz w sln0 sln r0 r nb0 nb1 nb00 nb2 L2 local by "$MY_panel"
local byby "by ‘by’" sort ‘by’ wave local y "$ML_y1" mleval ‘theta1’ = ‘b’ quietly {
gen double ‘lambda’ = exp(‘theta1’)
‘byby’: gen double ‘last’= (_n==_N)
‘byby’: egen double ‘nonz’= min(‘y’)
‘byby’: egen double ‘w’ = sum(‘y’)
‘byby’: gen double ‘sln0’= lngamma(‘y’+1)
‘byby’: egen double ‘sln’ = sum(‘sln0’)
‘byby’: gen double ‘r0’ = ‘y’*ln(‘lambda’)
‘byby’: egen double ‘r’ = sum(‘r0’)
‘byby’: egen double ‘nb0’ = sum(‘lambda’)
‘byby’: gen double ‘nb1’ = ‘nb0’^‘w’
‘byby’: gen double ‘nb00’= ‘lambda’^‘w’
‘byby’: egen double ‘nb2’ = sum(‘nb00’)
‘byby’: gen double ‘L2’ = lngamma(‘w’+1) - ‘sln’ + ‘r’ - ln( ‘nb1’ - ‘nb2’ ) /*
*/ if (‘last’ == 1 & ‘nonz’>0)
mlsum ‘lnf’ = ‘L2’ if (‘last’ == 1 & ‘nonz’>0) }
end
sort id wave global MY_panel id
ml model d0 ZIP_FE_model (y = x1 x2, nocons) if nonz>0 ml check
ml search