To Cloud or Not to Cloud: A Mobile Device
Perspective on Energy Consumption of Applications
Vinod Namboodiri, Toolika Ghose
Department of Electrical Engineering and Computer Science Wichita State University
Wichita, Kansas 67260–0083
Email:{vinod.namboodiri,txghose}@wichita.edu
Abstract—The cloud computing paradigm enables the work anywhere anytime paradigm by allowing application execution and data storage on remote servers. This is especially useful for mobile computing and communication devices that are constrained in terms of computation power and storage. It is however not clear how preferable cloud-based applications would be for mobile device users. For users of such battery life constrained devices, the most important criteria might be the energy consumed by the applications they run. The goal of this work is to characterize under what scenarios cloud-based applications would be relatively more energy-efficient for users of mobile devices. This work first empirically studies the energy consumption for various types of applications and for multiple classes of devices to make this determination. Subsequently, it presents a analytical model that helps characterize energy consumption of mobile devices under both the cloud and non-cloud application scenarios. Finally, an algorithm GreenSpot is presented that considers application features and energy-performance tradeoffs to determine whether cloud or local execution will be more preferable.
I. INTRODUCTION
A Cloud is used as a metaphor for the Internet, where resources, information, software, and hardware are shared [5]. The main advantages for using cloud-computing are scalability, ubiquitous availability, and maintenance costs. The cloud com-puting concept is being furthered by many major technology companies today like Google, IBM, Microsoft, etc. (e.g., [1], [2]). Cloud computing is typically a client-server architecture, where the client can be a laptop, phone, browser, or any other operating system-enabled device. Google recently introduced ChromeBooks that do not need a local OS at all [12].
Computing with mobile devices have always presented chal-lenges in terms of storage, memory, processing, network con-nectivity, bandwidth, and battery lifetime in comparison to their static counterparts like desktop computers. With the technolog-ical advances in recent years improving ubiquitous connectivity and bandwidth, cloud computing has become feasible allowing these constrained devices to utilize the greater storage, memory, and processing capabilities of powerful remote servers. With battery life being one of the biggest constraints in mobile devices, it becomes important to characterize the relative energy consumption of using cloud-based applications as opposed to more traditional non-cloud versions executed locally on the device.
Consider a mobile device like a smartphone being used to play the game of chess by a person who is mobile. The game could be played locally on the device itself, or it could be played online. In the former version, all the computing required
to make a move by the computer (the game opponent in a two-player format) is done using the device’s resources. In the latter, online version, all the computation is done through a powerful remote server and conveyed through communication to the device. The latter scenario allows the user to play games without installing a local copy, and provides the flexibility of playing the game from any device, anywhere. It is easy to see that more communication is required in the cloud-based scenario by the mobile device, but possibly significantly less computation.
This work explores the impact of cloud-based applications on battery life of mobile devices. It tries to answer the question: “For some user defined application performance criteria, when is the usage of cloud-based applications more preferable in terms of energy consumption than non-cloud based applications that are executed locally on a user’s device?”. This is answered by further investigating the following two questions:
1) For what types of applications is cloud-based execution more energy-efficient? The answer to this question re-lies on studying the relative impact of local process-ing/computation and communication required for a cloud based application versus the local processing/computation required for a non-cloud application. In this paper we study three different types of applications that require varying amounts of processing and communication either locally or when relying on a remote server. Our results indicate that cloud computing for mobile devices is most energy-inefficient for multimedia applications which are computation-intensive regardless of where they are run, while it is most energy-efficient for applications like a game of chess that are computation-intensive only if run locally.
2) What is the impact of device form-factor on the energy efficiency of cloud-based applications?As mobile devices can come in various form-factors (which can be indicative of device capabilities), it is important to explore the energy consumption of cloud computing for more than one class of device. Our results indicate that form-factor does indeed make a big difference based on the overall share of power consumed for communication in the device. Energy consumed for communication is a smaller percentage in larger form-factor devices compared to other components, making cloud based applications more preferable in terms of energy consumption.
The specific contributions of this work include the following: 1) An empirical comparison of energy consumption with three different cloud and non-cloud applications for mo-bile devices having both a large form factor (laptops) and a small form factor (smartphones).
2) An analytical model to evaluate of the impact of various parameters involved, and a condition to test whether cloud-based applications are more energy-efficient in a specific application and device scenario. This analytical characterization helps verify our empirical results and explore the impact of additional application and network characteristics, and device form factors.
3) An application comparison metric called AppScore that helps evaluate the relative functionality and perfor-mance of applications executed on the cloud or local device. AppScore incorporates important aspects like application features, network connectivity, and relative server speedup. Application functionality and perfor-mance would be the primary expectation from a user, and any energy savings would be a secondary goal. 4) An algorithm, GreenSpot, that can be deployed on mobile
devices to seamlessly decide between cloud or non-cloud versions of applications. This algorithm considers the AppScore rating of applications if executed over the cloud or locally, and allows a tunable tradeoff between user ex-perience and energy savings. GreenSpot is implemented as an ‘app’ for Android OS based smartphones.
II. BACKGROUND
Prior work on energy efficiency in cloud-computing has focused mainly on the server side and how it can help reduce data center energy costs (e.g., [3], [4]). Cloud computing has not been widely visualized as a means for energy-efficient and sustainable mobile computing. As a result, not much work characterizing the energy consumption of mobile devices for such applications exists. The authors of [21] discuss the use of cloudlets in mobile computing that places cloud-like functionalities closer to a mobile device to avoid WAN delays, and issues of congestion and jitter. They reinforce how cloud-computing can be of great utility for mobile devices, but do not quantify the energy benefits.
The goal of offloading computation from a mobile device to more powerful servers has been looked at for many years now (e.g. [11]), mainly for performance gains. It is only recently that such work have considered the aspect of energy consumption of the mobile devices [15], [7], [14], [9], [8], with the last three being the most recent. The work in [14] used a simple analytical model to answer the question whether offloading computation can save energy. Though a useful start, the work did not study application characteristics, empirically or analytically, and the model used did not consider aspects like power save mode (PSM) of the wireless interface or performance constraints imposed by users. The work in [9], [8] approached the prob-lem we consider from a system-level perspective, identifying opportunities when code and its individual methods should be offloaded to a server to save energy. In contrast, this work takes an application-level perspective considering an application as a single unit that cannot be decomposed into multiple methods
and must be run either on the cloud or locally without requiring any lower level operating system support. We feel this approach is justified as most existing applications are designed in this fashion to either run on the cloud or locally, not both. Further, we do not make the assumption that both the cloud and local applications are ‘clones’ of each other; in fact, we incorporate the difference in features between the two versions as part of the decision process. In addition, in this work the impact of device form factor is studied analytically as well as through empirical measurements on both laptops and smartphones.
Other research efforts closest to our work from a cloud-computing perspective are that of [22] and [17]. The first [22] considers energy efficiency in thin client solutions. This work, however, does not consider the issues of the wireless medium. Further, it places emphasis on the total end-to-end energy consumption comparison between a cloud-based model and a traditional model. The work in [17] has the same goal as ours of determining the critical factors affecting the energy consumption of mobile clients in cloud computing, and comparing the relative impact of communication and local processing. The study is however limited to empirical studies with two smartphones without an analytical characterization, and provides no guidelines on how mobile devices could choose between cloud or local application execution.
III. EMPIRICALMEASUREMENTS
In this section we describe results from empirical measure-ments on mobile devices of two form factors: laptops and smartphones.
A. Applications under consideration and their characteristics In this work three types of applications were compared: (i) word processing, (ii) multimedia, and (iii) gaming. These applications vary in the degree of local computation and communication required, providing a variety of possibilities, and allow us to gain better insight into the local versus cloud comparison in terms of energy. The local word processing application has the advantage of requiring no network con-nectivity and a rich feature set on the software while a cloud version provides ubiquitous access through any terminal device at any time through a network connection. Local execution of word processing software is expected to involve little or no communication, but possibly using up a good amount of resources to run the application. Cloud-based execution on the other hand would require some communication, but little local processing. Multimedia application options include those that allow files to be played remotely from servers over the Internet or those that let multiple files be downloaded and stored which can then be played when offline (e.g. podcasts or non-streamed webcasts). Finally, gaming options in mobile devices could involve locally installed applications or those played over a web browser. There are also games that could be accessed over a web browser but require no further network involvement and are locally executed subsequently (e.g. Adobe Flash based games). The amount of processing required for playing games locally depends on the nature of the game. Flash based games require little local processing compared to games like chess that could require extensive processing from the ‘computer’
opponent. Games played over the network, possibly against other players or a computer again, would vary in the amount of communication based on the interactivity of the game, with little local processing required.
All cloud based applications were played on remote servers that were at least 7 hops away from the client as determined by the common traceroute tool. The mean round trip delay varied from 33ms (for YouTube) to 98 ms (for StickCricket) with none of the routes found to be particularly lossy (all had losses ≤0.1%) at the time of our experiments. As the power save mode for the Wi-Fi interface was not used (coupled with little or no re-transmissions required for the non-lossy links), the network delay was not expected to play a role in the energy consumed for communication.1 We could thus expect similar energy consumption results regardless of the location of remote servers. We consider the impact of the interface’s ability to transition to the sleep mode later in the paper in Section IV and explore network connectivity as a factor to determine whether an application should be executed over the cloud in Section VI. B. Results for a Laptop Computer
In this sub-section we will look at energy consumed for three different applications (both cloud and non-cloud versions) for a laptop, a large form-factor device.
Methodology
Our laptop used in the project is a Lenovo SL400.2 Energy consumed in the laptop device under test was investigated on both open-source Ubuntu 9.04 and the Windows 7 operating systems. On Ubuntu, the battery statistics were obtained from a file updated by an ACPI module. On Windows 7, a soft battery meter called a battery barwas used to provide the same statistics as Ubuntu. For our experiments, the WiFi interface was the only interface used for communication in cloud-based applications. For non-cloud based applications, which do not require the device to communicate, the WiFi interface was kept switched off.
Word processing applications
For Ubuntu, the experiments were done using the cloud and non-cloud applications of Google’s Docs and Sun MicroSys-tems’ Open Office respectively. For Windows, the study had a wider scope due to more compatible applications. Cloud applications used were Google’s Docsand Microsoft’s Office Live, and non-cloud applications were Microsoft’s Officeand Sun’sOpen Office. For each application, the same text was entered manually at a constant typing rate. The Xnee tool that can imitate user actions was used on Ubuntu to confirm that slight variabilities in typing rates did not have any impact on our results.
Figure 1(a) shows the comparison of energy consumed for the three cases: (i) when the laptop was idling with no
1Interested readers can refer to [13] and [19] on the impact of network delay on energy savings when using the power save mode.
2Detailed specifications of all devices and applications used in our empirical measurements in this section can be found in our technical report in [18]. This report also contains additional details on our energy measurement methodology and power consumption of individual components obtained through direct measurements from a multimeter. These details are omitted in this paper due to space limitations.
other applications running, (ii) was running a word processing application locally (with WiFI off), or (iii) running a word processing application on the cloud. It can be observed that for Ubuntu, there is little difference in energy consumption between the cloud and non-cloud applications. However, for Windows, the cloud version consumes significantly lesser energy.3Further investigation using the Wireshark packet capture tool revealed that the packet communication for applications on Ubuntu were bursty, while those on Windows were more steady in nature. What is apparent from this result is that cloud based applications are at least as energy-efficient as non-cloud based applications when the application uses up a good amount of resources for local execution, but does not involve a lot of communication. Further, it must be noted that we had kept the WiFi interface inactive for the non-cloud application. Most users always keep their WiFi interface active, which will then add additional energy costs to the non-cloud application results. A Wi-Fi interface in the low-power sleep mode can still consume 10% of the power if it were in an active but idle mode [10], [19].
Multimedia applications
For multimedia, we studied the energy consumed for playing audio and video files. For audio, an MP3 file was played using Windows Media Player and Movie Player on Windows and Ubuntu respectively. To analyze the energy pattern when played on the cloud, we experimented with online radio which was available on the media player itself. We carefully chose the radio station which had the same audio characteristics as that of the local MP3 file played. For video we captured energy readings for two different file formats: FLV and MPEG-II. The same media players were used as explained for the audio format for local execution. The results obtained were compared when the same files were uploaded and accessed over the cloud (YouTube) through different browsers: Firefox, Internet Explorer, and Chrome. On Ubuntu there is no support for Internet Explorer, and hence we only show results for the other two browsers.
The results for our experiment with audio files in Figure 1(b) show that cloud based applications consume more energy. More detailed results obtained for video files in Figure 1(c) show the same trend with non-cloud application execution being more energy-efficient. We believe this result for multimedia appli-cations is due to the significant local processing requirement on the device for a cloud based application. For example, playing an online video requires a good deal of work by the local graphics processor to render the image on the display. This is in addition to the heavy burden of communicating a constant stream of data. Playing the file locally seems to require only a similar amount of local processing resources, without the additional cost for communication with the WiFi interface inactive.Thus, for applications like multimedia which require significant local resources, cloud versions consume more energy.
Gaming
For gaming, we tried two different applications with varying
3In general, we found the Windows 7 operating system to consume lesser power overall than Ubuntu 9.04.
0 50 100 150 200 250 300 350
Idle Cloud Non-cloud(local)
E n e rg y ( m W h ) c o n su m e d p e r m in u te Word Processing Windows Ubuntu
(a) Composing a document.
0 50 100 150 200 250 300 350
Audio MP3 (local) Audio MP3 (cloud) Audio Windows Ubuntu E n e rg y ( m W H ) p e r m in u te
(b) Playing audio files.
240 250 260 270 280 290 300 310 320 330 )/9
ORFDO 03(*ORFDO )LUHIR[FORXG &KURPHFORXG ,(FORXG
Video :LQGRZV 8EXQWX (Q HUJ \ P : + S HU P LQ XW H
(c) Playing video files. Fig. 1. Energy consumption while composing a document and playing audio and video files on a laptop.
levels of computation requirement locally on the client ma-chine. For both cases, we used only our laptop running Ubuntu, with Firefox as the browser. We began with the application of cricket from the web page www.stickcricket.com that allows flash based games to be played both locally with the computer as opponent, and online interactively with other opponents. It was observed that the local and online versions consume almost an identical amount of energy over time. We feel this is due to the game requiring little resources locally. Next, we tried the game of chess, which requires more local computation than the cricket game. The online version from www.chess.com allows playing the game against a computer remotely. The difficulty level, an indicator of the amount of possible moves a computer explores before it decides on one, was set to the highest. The experiment was made repeatable ensuring the human played each move at a pre-determined interval, and repeated the same moves from a previous game. Our laptop running Ubuntu had a local version of the game as well, with a similar difficulty level and response time against the computer.
0 10000 20000 30000 40000 50000 60000 0 5 10 15 20 25 30 35 40 45 50 55 60 En e rg y (m W h) Time in minutes Chess Cloud (mWh) Non-Cloud (mWh) Idle (mWh)
Fig. 2. Battery capacity over time while playing chess on a laptop.
Figure 2 shows that with intensive computation involved for local execution, the cloud-based version is most beneficial for the client device.Most of the computation required is offloaded to the server, reducing the energy consumed from a mobile device’s battery.
C. Results for a smartphone
In this section we will look at energy consumed for the same three applications (both cloud and non-cloud versions) for a smartphone, a small form-factor device.
Methodology
The results shown in this section are based on the HTC Desire phone which runs on Android 2.1. Energy consumption was measured using thepower tutorapplication for the Android OS. This application provides the total power consumed by all the components, and also displays remaining energy in the bat-tery. For all local applications, both the WiFi and 3G interfaces were turned off. For remote applications, we only had the WiFi interface turned on. For the experiments, all sync services were disabled to avoid interference from applications which update periodically. For our smartphone we used theQuickOffice application found on Android OS. As there was no equivalent cloud-based version, we used Google’sDocs. For multimedia, we played a video file locally, as well as through YouTube, similar to our laptop experiments. And finally, for gaming, we played chess locally against the computer and remotely, again similar to our laptop experiments.
Results
Figures 3(a), 3(b), and 3(c) show the comparison of energy consumption for all three types of applications we consider in this paper.4 Interestingly, all three results point to cloud based applications consuming more energy than non-cloud ones. We believe this is due to the fact that the WiFi interface is a much bigger share of the power consumption in smartphones than laptops [20]. All cloud-based applications use this interface, while for non-cloud based applications we kept this interface turned off.
IV. ANALYTICALCHARACTERIZATION
In this section we develop an analytical model to characterize the energy consumption of a device. Our earlier empirical study provided an idea of the impact of applications and device form factors on the relative energy consumption of cloud versus local applications. Our analytical model allows us to generalize these results and further evaluate energy consumption for varying communication and processing characteristics of mobile de-vices when executing applications.
4There is a level of discreteness at which the energy values were computed; this is in part due to the refresh rate of thepower tutortool and in part due to the intervals at which we translated the power values to energy consumed.
4400 4600 4800 5000 5200 5400 5600 5800 6000 0 5 10 15 20 25 30 E n e r g y (m W h ) Time in minutes Office Non-Cloud Idle Cloud
(a) Composing a Document
0 1000 2000 3000 4000 5000 6000 7000 0 10 20 30 40 50 60 70 80 90 100 E n e r g y ( m W h ) Time in minutes Youtube Cloud Non-Cloud Idle (b) Video Files 0 1000 2000 3000 4000 5000 6000 7000 0 10 20 30 40 5060 70 80 90 100 E n e r g y ( m W h ) Time in minutes Chess Cloud Non-Cloud Idle (c) Chess Game Fig. 3. Battery capacity over time while composing a document, playing video files, or games on a mobile phone.
A. Model
Let pm be the power consumed by a mobile device at
an instant. pm can be written down as the sum of three
components:
pm=P0+PCP Uλ+pN IC, (1)
where P0 is the base idle power of the device, PCP U is the
power consumed by the CPU of the device at maximum load,
λ is the specific CPU load fraction under consideration, and
pN IC is the power consumed by the network interface for
communication. As a wireless interface could be in one of four possible states (active, idle, sleep, or off), pN IC can be
expressed as
pN IC =factivePactive+fidlePidle+fsleepPsleep+fof fPof f.
(2) In the above equation, f(.) is the fraction of time an interface
spends in a specific state, with the sum of all fractions equal to one. Power consumed when the interface is in the off state is zero, hence we can safely drop the last term. For local, non-cloud applications the interface could be assumed to be either in the off state, or in the low-power sleep state.
B. Condition for energy-efficient cloud based execution Under the model, cloud based execution will be more energy-efficient if
pcm< plm,
where c and l super-scripts denote cloud and non-cloud ap-plication execution respectively. Expressing these terms using Equation 1 and 2 with similar super-script notation for cloud and local gives the condition
P0+PCP Uλc+pcN IC ≤P0+PCP Uλl+plN IC.
Note that the base power for the device remains the same regardless of where the application is executed. We can simplify the above condition together with the fact that local execution does not need the communication interface (plN IC = 0 with
fof f = 1), and thus arrive at the condition
PCP Uλc+pcN IC ≤PCP Uλl (3)
or
(λl−λc)PCP U ≥pcN IC. (4)
Equation 4 reinforces the insight gained from our empirical study that cloud computing will be energy-efficient if and only if the reduction in local processing load can offset the power consumed for communication. The outcome of this condition could be different depending on the application under consideration and device form factor. Note thatpc
N IC,λl, and λc are variables based on application characteristics5, while
PCP U is a constant for a specific device.
C. Determining an energy-efficient range for cloud computing Here we numerically evaluate our model through some practical values of power consumption and determine a range of various parameters involved for energy-efficient cloud com-puting. We begin by defining two new terms following up from Equation 4 as Power Ratio= p c N IC δλPCP U <1, (5)
where the load difference between local and cloud processing,
δλ = λl − λc. Cloud-computing for mobile devices will
consume less energy than local execution only if the value of Power Ratio as defined above is less than unity.
We begin byconsidering the simple case where the commu-nication interface can only be in the active or idle state (or
factive+fidle = 1). Note that this was the setting used in
all our empirical measurements earlier in the paper. We will vary values of δλ andfactive to study the relative impacts of
computation and communication loads. We will look at two different values of maximum power at full load required for processing,PCP Uof 2 W and 10 W, representing a small
form-factor device and a large form-form-factor device.6 We use power consumption values of a Wi-Fi interface provided in [19].
The results shown in Figure 4(a) perfectly validate our empirical results. It can be seen that for a large form factor device (PCP U = 10 W), the Power Ratio is less than unity
5pN IC could also depend on the NIC manufacturer and the specifications
used, which we assume to be the similar for a specific communication standard. For example, it should be reasonable to assume that WiFi interfaces from all manufacturers following the 802.11n standard consume similar power.
6These values are based on practical values seen for smartphones and laptop devices respectively [6], [16], taking care to choose upper bounds to represent values at 100% load. Later in this section we will examine the whole spectrum of power values in between these two chosen values, including some lower values ofPCP U as well.
0.010 0.1 0.2 0.3 0.4 0.5 0.6 0.7 0.8 0.9 1 1 2 3 4 5 6 7 Difference in load, δλ Power Ratio f active = 0.05 f active = 0.1 f active = 0.2 f active = 0.3 factive = 0.5 P CPU = 2 W P CPU = 10 W
Cloud Energy Efficiency Threshold
(a)fsleep= 0. 0.010 0.1 0.2 0.3 0.4 0.5 0.6 0.7 0.8 0.9 1 1 2 3 4 5 6 Difference in load, δλ Power Ratio f sleep = 0 f sleep = 0.1 f sleep = 0.3 f sleep = 0.5 f sleep = 0.9 P CPU = 2 W P
CPU = 10 WCloud Energy Efficiency Threshold
(b)factive= 0.1. 0.5 1 2 3 4 5 6 7 8 9 10 0 1 2 3 4 5 6 7 P CPU (W) Power Ratio δλ = 0.1 δλ = 0.25 δλ = 0.5 δλ = 0.75 δλ = 0.9
Cloud Energy Efficiency Threshold
(c)factive= 0.1,fsleep= 0.5.
Fig. 4. Power ratioas a function of a) varyingδλandfactive, b) varyingδλandfsleep, and c) varyingPCP Uandδλ. There are two sets of lines in plots a) and b), one forPCP U= 10W representing a large form-factor device, andPCP U= 2W representing a small form-factor device.
except for the smallest values of load difference δλ. This
explains why for our laptop device, except for multimedia, cloud computing was found to be more desirable in terms of energy consumption. For multimedia, the load difference is very small with significant local processing required even if the application was run remotely. For a small form-factor device (PCP U = 2 W) we can see that thePower Ratio is less
than unity only for δλ greater than 0.3, which is a significant
difference.
Next, we consider the possibility that the communication interface has an opportunity to transition to the sleep mode. Enabling the power save mode in Wi-Fi provides such an option in current deployments. Without the power save mode, an interface when not communicating packets, stays in the idle mode. The fraction of time an interface gets to spend in the sleep mode as opposed to the idle mode depends on the nature of application; this fraction could be large for bursty applications like web browsing [13], or small for applications like VoIP that require continuous communication [19]. We already considered the latter scenario without a sleep mode. Next, we consider the former scenario by fixing factive to
0.1 and varying fsleep for this experiment to understand its
effect. Note that the fraction of time in idle mode is now
just 1 −factive − fsleep. The results in Figure 4(b) show
that in contrast to the results in Figure 4(a), a sleep mode option reduces the load difference threshold required for cloud-computing to be energy-efficient on a device. This increases the possibility that small form-factor devices could find cloud execution of applications desirable as well.
Finally, we investigate the energy efficiency of cloud com-puting for varying values ofPCP U. This allows us to consider
a much wider range of device form-factors, possibly study-ing devices with form-factors other than that of laptops or smartphones. 7 The result in Figure 4(c) repeats the trend we have seen so far: small form-factor devices with low PCP U
values require larger values of δλ for energy-efficient
cloud-computing. For δλ greater than 0.5, devices of almost all
form-factors devices considered find cloud-computing energy
7For example, tablets and netbooks are expected to havePCP Uvalues that lie between that of laptops and smartphones. Our study here enables us to quantify what load difference would be required for cloud application execution to be desirable over a range of possible device form-factors and capabilities.
efficient. Looking at the data in another way, devices with
PCP U ≥3 W find cloud application execution desirable even
for the smallest load differences.
V. PERFORMANCECONSIDERATIONS
The condition for a cloud-based application to save energy was shown in Equation 4. But saving energy is typically secondary to user experience while running the application. We will introduce a application functionality and performance metric called AppScore that will be used by the GreenSpot algorithm to manage the energy and user experience tradeoff. A. Application Performance Score
We assume the desirability of any application is a function of the features it offers a user, and performance during execution. Features could include application functionality, ubiquitous access, availability of other users to interact with, to name a few. Performance could be measured based on execution speed and response time. For cloud-based applications, the network connectivity is an important factor in meeting performance goals.
We define an application performance score (AppScore),R
(−∞ ≤ R ≤ 1), as a weighted score of the desirability of an application based on the features it offers a user and its performance. It can be expressed as
R=w1F+ (1−w1)S, (6)
where w1 is a weight used to assign relative importance
between features, with a score of F, and performance, with a score ofS, to a user, and0≤w1, F ≤1.
Performance when running an application on a remote server will be function of network conditions, and the capabilities and load at the server. Performance when running the application locally is a function of its processor capability and load. Score
S (−∞ ≤S≤1) can thus be expressed as
S=
{
w2N+ (1−w2), cloud execution 1
Speedup, local execution
(7) where N (−∞ ≤ N ≤ 1) is a score assigned based on network connectivity to the remote server. If network conditions are bad, a negative score can be assigned favoring the use of
local applications. w2 (0 ≤ w2 ≤ 1) is a weight used to
as-sign a relative importance between network characteristics and processing capabilities when running cloud applications. This weight could be assigned based on how often the network will be used and processing requirements at the server for a specific application. The term Speedup used above can be defined as the ratio of server processing capabilities to local processing capabilities. With the server capability normalized to unity, the local performance would be 1
Speedup, with Speedup ≥ 0. A
Speedupvalue of unity indicates similar processing capabilities locally as well as in the cloud, while a larger value denotes more powerful cloud based processing. TheSpeedupvalue can be less than unity when the servers are unable to handle the additional load.
We define N as a function of both packet loss rate e and network latency l with the following relation:
N =w3(1− e te ) + (1−w3)(1− l tl ), (8) where te and tl are application specific desirable packet loss
rate and network latency respectively, andw3 (0≤w3≤1) is
a weight to assign relative importance to one network factor or the other. Applications such a Video over UDP, for example, are more tolerable to packet loss than latency and a higher weight needs to be assigned to the latter. It is assumed that impact of other network parameters like available bandwidth will be manifested as either packet loss or latency; if needed, the model can easily extended to add other parameters.
Lemma 5.1: Given user preference weight w1 and
applica-tion specific weightw2, feature scoreFc for the cloud
applica-tion andFlfor the local application, and network connectivity
score N, the minimum speedup required for Rcloud > Rlocal
is given by
Speedup > 1−w1
w1(Fc−Fl) + (1−w1)[w2N+ (1−w2)]
(9) Proof: This follows trivially from the expressions of
Rcloud=w1Fc+(1−w1)[w2N+1−w2]andRlocal =w1Fl+
1−w1
Speedup using Equation 6 and the conditionRcloud > Rlocal.
Note that when the denominator of Equation 9 is less than or equal to 0, there exists no Speedup value where Rcloud >
Rlocal. A condition for N given Speedup can be expressed
similarly. The next lemma, Lemma 5.2, provides a lower bound on the difference in features required for cloud based execution to be more desirable, and ifSpeedupis known beforehand, can prove to be a useful preliminary check before gauging network conditions.
Lemma 5.2: Given user preference weightw1, feature score Fc for the cloud application and Fl for the local application,
and relative processing capability Speedup, the minimum dif-ference in feature scores for the cloud application to have a better AppScore than the local application under any network conditions is given by Fc−Fl> 1 Speedup ( w 1 1−w1 ) −1 (10)
Proof: This follows from the expressions of Rcloud =
w1Fc+ (1−w1)[w2N+ 1−w2]andRlocal =w1Fl+Speedup1−w1
using Equation 6 and the conditionRcloud> Rlocal. By using
the best possible score for network connectivity N = 1 the condition reduces to the desired one.
B. AppScore Numerical Evaluations
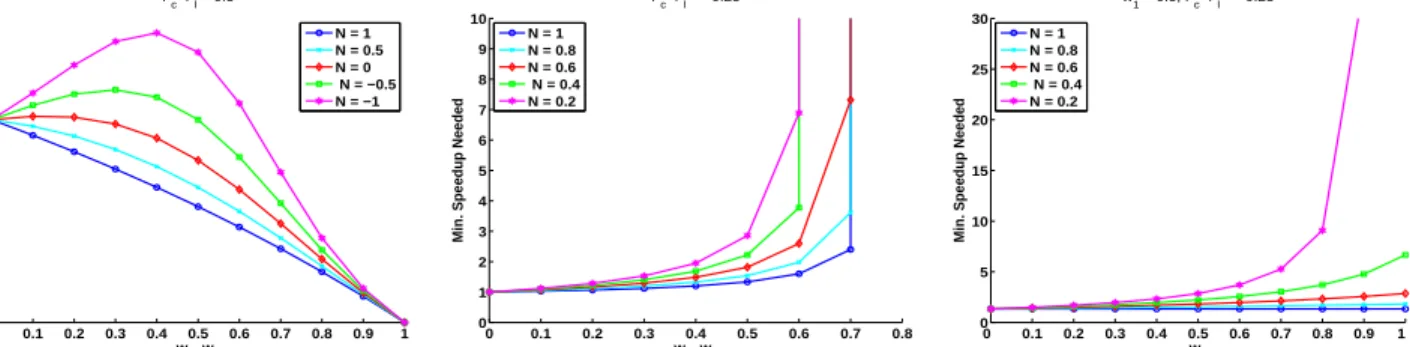
To get a sense of the impact of various parameters on AppScores, we show two sets of numerical evaluations in Figures 5 and 6. The first set of evaluations mainly shows the minimum Speedupnecessary for Rcloud > Rlocal considering
an overall score N without the underlying relative weight w3
between packet loss and network latency. The second set looks all three weightsw1, w2, andw3.
The set of plots in Figure 5 shows examples of how much server Speedup is necessary to overcome limitations of the network or application functionality. Figure 5(a) shows that with Fc−Fl = 0.5, the cloud application score can exceed
the local application even with a network score N as low as -1 for small values ofSpeedup. Figure 5(b) shows that when
Fc−Fl = −0.25, that is the local application functionality
score is higher by 0.25, positive values ofN are required. By keepingw1fixed at 0.5, the plot in Figure 5(c) reveals that large
values ofw1is the reason no value ofSpeedupis feasible in the
plot in Figure 5(b) for largew1, w2. When the weight assigned
to application functionality is higher, it becomes more difficult for the cloud application to overcome its lack of features, even under good network conditions and high values ofSpeedup.
1 5 10 15 20 25 0 500 1000 1500 2000 2500 Speedup
Tolerable Latency for Cloud Execution (ms)
Loss Ratio = 0.1, Latency Threshold = 300ms, and w1 = w2 = w3 = 0.5
Fc−Fl = −1 Fc−Fl=−0.5 Fc−Fl = 0 Fc−Fl = 0.5 Fc−Fl = 1 (a)w1=w2=w3= 0.5. 1 5 10 15 20 25 0 500 1000 1500 2000 2500 3000 3500 4000 4500 5000 Speedup
Tolerable Latency for Cloud Execution (ms)
Loss Ratio = 0.1, Latency Threshold = 300ms, and w1 = 0.75, w2 = w3 = 0.5
Fc−Fl = −1 Fc−Fl=−0.5 Fc−Fl = 0 Fc−Fl = 0.5 Fc−Fl = 1 (b)w1= 0.75,w2=w3= 0.5.
Fig. 6. Maximum tolerable network latency for cloud applications to be favorable.
As the impact of network connectivity is very critical in the decision between a cloud and local application, Figures 6(a) and 6(b) look at the maximum tolerable network latency for a range ofSpeedup values and difference in features. The ratio of packet loss rate to tolerable loss rate was kept fixed at 0.1 to focus on the impact on just network latency; the same could be easily done for packet loss. The desirable network latencytlwas kept at 300 ms, which is a round trip value. The
results for weights w1, w2, w3 = 0.5 (Figure 6(a)) show that
if the cloud application is lacking in features, it can tolerate very little increase in network latency over the desirable value to provide a good user experience. If features are given more weight by increasing w1 to0.75 as in Figure 6(b) this effect
is more pronounced with cloud applications required to have better features than the local applications.
Computing AppScore
ap-0 0.1 0.2 0.3 0.4 0.5 0.6 0.7 0.8 0.9 1 0 0.5 1 1.5 w 1, w2
Min. Speedup Needed
F c−Fl = 0.5 N = 1 N = 0.5 N = 0 N = −0.5 N = −1
(a) Speedup needed for Rcloud ≥ Rlocal for varying values ofN, and w1, w2 (w1 = w2),
withFc−Fl= 0.5. 0 0.1 0.2 0.3 0.4 0.5 0.6 0.7 0.8 0 1 2 3 4 5 6 7 8 9 10 w 1, w2
Min. Speedup Needed
F c−Fl = −0.25 N = 1 N = 0.8 N = 0.6 N = 0.4 N = 0.2
(b) Speedup needed for Rcloud ≥ Rlocal for varying values of N, and w1, w2 (w1 = w2),
withFc−Fl=−0.25. Vertical lines after certain
w1, w2 indicate an infeasible condition.
0 0.1 0.2 0.3 0.4 0.5 0.6 0.7 0.8 0.9 1 0 5 10 15 20 25 30 w 2
Min. Speedup Needed
w 1 = 0.5, Fc−Fl = −0.25 N = 1 N = 0.8 N = 0.6 N = 0.4 N = 0.2
(c) Speedup needed for Rcloud ≥ Rlocal for varying values ofN, andw2.w1was kept fixed
at 0.5 withFc−Fl=−0.25.
Fig. 5. Using AppScore to judge whether cloud execution provides the necessary speedup over local applications to improve user experience given network conditions and difference in application functionality.
plications are compared. Network conditions (through metrics packet loss and latency) at the time the decision is made can be determined by sending a stream of test packets of the same size as used by the application. A 10 KB stream as part of a TCP connection to the server was found to be a reliable indicator in [9]. This should require no more than a few seconds on typical network connections. The server could provide information on its processing capabilities considering the load it is handling at that time. AppScore can be re-evaluated periodically, and if there is software support to transfer application state from cloud to the device or vice-versa, the location of application execution can be switched as done in [9], [8]. Most applications run by users on a mobile device, however, would be of a short duration (order of a few minutes). The network and server conditions may not vary significantly enough within that duration to change execution modes and justify the overhead of state transfer; the user can be given the option overriding the model’s decision if a change in network conditions is highly probable.
VI. THEGREENSPOTALGORITHM
Based on our empirical and analytical results earlier in the paper, we designed an algorithm GreenSpot that can help a mobile device determine whether it should run a cloud or non-cloud version of any application, if the choice is available.
The algorithm (listed as Algorithm 1) begins with the user requesting an application. The algorithm checks if both a cloud and local version of the application is available. If not, the algorithm uses the version available. If yes, it proceeds with evaluating the two options. This check is important as users may only have a cloud version of an application (e.g. a device which does not have MicrosoftOfficewith the user relying on Google’s Docsfor word processing).
The next phase of the algorithm is used to get parameter values to compute relative desirability of the application and its performance for the cloud version and local version. It gathers information on the features available in both versions, Fc and Fl, assigns weightsw1, w2, w3, and tolerable loss ratete and
latency tl based on user-preferences and nature of application
requested. Test packets as described in Section V-B are sent to
Algorithm 1 The GreenSpot Algorithm
1: if only one of cloud or local version availablethen
2: Use that version
3: end if
4: Get weights w1, w2, w3, and te, tl based on
user-preferences and nature of application
5: GetFc andFl
6: Send test packets to cloud server to get eandlto evaluate
N (Equation 8), and get server capabilities to compute Speedup
7: ComputeRcloud andRlocal
8: if Rcloud> τ Rlocal then
9: Get parameterspc
N IC,δλ, andPCP U and computePower
Ratio (Equation 5)
10: if Power Ratio<1 then
11: Use cloud version of the application
12: end if
13: end if
14: Use local version of the application
the server get current estimates on packet loss rate and latency to compute N, and to fetch information to compute Speedup relative to local device capabilities. If the cloud AppScore
Rcloud is found greater than someτ factor of the local device
AppScore Rlocal, expected performance to execute the cloud
version of the application is deemed satisfactory. The factorτ
(0 ≤τ ≤1) is introduced to let the user tradeoff application desirability and performance for possible energy savings in the next step.
Finally, after all the checks above, the algorithm computes thePower Ratioand uses the condition presented in Equation 5 to determine whether the cloud or non-cloud version consumes less energy, and hence, is more preferable.8
GreenSpot Implementation
We have implemented the GreenSpot algorithm as an ‘app’ on Android OS for smartphones. A chess application was created
8Note that if application execution location is selected based only on performance, the check for Power Ratio can be safely removed from the algorithm.
that decides between a local version of the game and a remote version. The application executes the steps outlined in the algorithm and then calls as sub-routines either a cloud based application of the game (Chesspresso from the Android market) or a local, non-cloud application of the game (Chess by AI from the Android market). The network connectivity was determined by sending a series of ping packets at intervals of 20ms for 2 seconds providing 100 samples. The most chal-lenging aspect was getting the relative Speedup value without any method implemented at the remote server that provides the information. The best solution without such support would be to run a benchmark that resembles the application workload most closely both locally and on the remote server to compare performance. Without access to such tools at the server, esti-mates based on prior history of execution speed can be used. Our current implementation uses a simple manual entry of this information based on server response times and knowledge of local hardware. In general the parameters needed by the GreenSpot algorithm are device specific, application specific, or need to be obtained from the network and remote server. The device specific parameters could be easily obtained at initializa-tion through the operating system or known specificainitializa-tions. The application specific parameters can be learned through prior history of execution. The first time an application is executed as either a cloud or a non-cloud version, parameters from this run could be stored along with network conditions at that time. The user could be encouraged to try both versions the first time so that the necessary history could be gathered. Such history for an application could also be shared across users keeping in mind differences in device type and network conditions.
Fig. 7. Snapshots of the Chess application implemented on a HTC Desire phone running Android OS. The left part shows an instance where local application was found better proceeding onto a local version of the game, while the right part is of an instance favoring the remote cloud version.
Future work to be done would include studying the energy consumption of mobile devices when there is no local OS, like that of the Chrome OS from Google [12] and working on meth-ods to get better estimates of relative processing capabilities between the server and local device.
REFERENCES [1] Flickr. http://www.flickr.com.
[2] Picasa. http://picasa.google.com.
[3] E. G. A. Berl, M. di Girolamo, G. Giuliani, H. de Meer, M. Q. Dang, and K. Pentikousis. Energy-efficient cloud computing. The Computer Journal, August 2009.
[4] H. S. Abdelsalam, K. Maly, R. Mukkamala, M. Zubair, and D. Kaminsky. Analysis of energy efficiency in clouds. In COMPUTATIONWORLD ’09: Proceedings of the 2009 Computation World: Future Computing, Service Computation, Cognitive, Adaptive, Content, Patterns, pages 416– 421, 2009.
[5] M. Armbrust, A. Fox, R. Griffith, A. D. Joseph, R. H. Katz, A. Kon-winski, G. Lee, D. A. Patterson, A. Rabkin, I. Stoica, and M. Zaharia. Above the clouds: A berkeley view of cloud computing. Technical report, EECS Department, University of California, Berkeley, Feb 2009. http://www.eecs.berkeley.edu/Pubs/TechRpts/2009/EECS-2009-28.html. [6] A. Carroll and G. Heiser. An analysis of power consumption in a
smartphone. InProceedings of the 2010 USENIX conference on USENIX annual technical conference, USENIXATC’10, 2010.
[7] G. Chen, B.-T. Kang, M. Kandemir, N. Vijaykrishnan, M. J. Irwin, and R. Chandramouli. Studying energy trade offs in offloading computa-tion/compilation in java-enabled mobile devices. IEEE Trans. Parallel Distrib. Syst., 15:795–809, September 2004.
[8] B.-G. Chun, S. Ihm, P. Maniatis, M. Naik, and A. Patti. Clonecloud: elastic execution between mobile device and cloud. In Proceedings of the sixth conference on Computer systems, EuroSys ’11, pages 301–314, 2011.
[9] E. Cuervo, A. Balasubramanian, D. ki Cho, A. Wolman, S. Saroiu, R. Chandra, and P. Bahl. Maui: making smartphones last longer with code offload. InMobiSys, pages 49–62, 2010.
[10] L. Feeney and M. Nilsson. Investigating the Energy Consumption of a Wireless Network Interface in an Ad-Hoc Networking Environment. In
IEEE INFOCOM, 2001.
[11] J. Flinn, S. Park, and M. Satyanarayanan. Balancing performance, energy, and quality in pervasive computing. InProceedings of the 22 nd International Conference on Distributed Computing Systems (ICDCS’02), ICDCS ’02, pages 217–226, 2002.
[12] Google. Chrome OS - Nothing but the web. http://www.google.com/chromeos/.
[13] R. Krashinsky and H. Balakrishnan. Minimizing energy for wireless web access with bounded slowdown. InACM MOBICOM, 2002.
[14] K. Kumar and Y.-H. Lu. Cloud computing for mobile users: Can offloading computation save energy?IEEE Computer, 43(4):51–56, 2010. [15] Z. Li, C. Wang, and R. Xu. Computation offloading to save energy on handheld devices: a partition scheme. In Proceedings of the 2001 international conference on Compilers, architecture, and synthesis for embedded systems, CASES ’01, pages 238–246, 2001.
[16] A. Mahesri and V. Vardhan. Power consumption breakdown on a modern laptop. InPACS, 2004.
[17] A. P. Miettinen and J. K. Nurminen. Energy efficiency of mobile clients in cloud computing. InProceedings of the 2nd USENIX conference on Hot topics in cloud computing, HotCloud’10, 2010.
[18] V. Namboodiri. On the Energy Consumption of Cloud Based Applications for Mobile Devices. Technical Report EECS-TR-2011-02, Wichita State University, 2011.
[19] V. Namboodiri and L. Gao. Energy Efficient VoIP over Wireless LANs.
IEEE Transactions on Mobile Computing, 9(4):566–581, April 2010. [20] V. Raghunathan, T. Pering, R. Want, A. Nguyen, and P. Jensen.
Experi-ence with a low power wireless mobile computing platform. InISLPED ’04: Proceedings of the 2004 international symposium on Low power electronics and design, pages 363–368, 2004.
[21] M. Satyanarayanan, P. Bahl, R. Caceres, and N. Davies. The case for vm-based cloudlets in mobile computing. IEEE Pervasive Computing, 8:14–23, 2009.
[22] W. Vereecken, L. Deboosere, P. Simoens, B. Vermeulen, D. Colle, C. Develder, M. Pickavet, B. Dhoedt, and P. Demeester.Energy Efficiency in Thin Client Solutions. Springer, 2010.