I
n January 2004, the Institute for Healthcare Improvement (IHI) launched an initiative designed to develop and test an exclusively Internet- and phone-based system of adult learning dedicated to improving access in primary care. Called the “Virtual Breakthrough Series,” or VBTS, the initiative was mod-eled on the methodology used in IHI’s Breakthrough Series (BTS) for collaborative improvement.1The VBTS was designed as a demonstration project, not a research project, to show that it was feasible to conduct a Breakthrough Series collaborative virtually and produce outcomes comparable to those of a traditional BTS, at substantially reduced cost. The specific outcomes to be measured were reductions in waiting time both for and at an appointment in physician office practices.The project’s ultimate aim was to improve outcomes and quality of care by using IHI’s BTS collaborative model, which is designed to rapidly diffuse knowledge and spread best practices on the basis of an “all teach, all learn” phi-losophy—but at greatly reduced cost and to a much broad-er audience than can feasibly be reached through the traditional face BTS model. A traditional, face-to-face IHI collaborative is a short-term (6–15-month) learn-ing-and-action project that brings together a large number of teams (usually 20 to 40) from hospitals or clinics to achieve rapid, significant improvement in a specific area. Each team typically consists of three members who attend three learning sessions (LSs), with an additional two or three members who work on improvements in their local organization. The total number of people participating in collaborative LSs has ranged from 40 to more than 700.
Using a Virtual Breakthrough Series
Collaborative to Improve
Access in Primary Care
Methods, Tools, and Strategies
Barbara Boushon, B.S.N.
Lloyd Provost, M.S.
Janice Gagnon
Penny Carver
Background:The Institute for Healthcare Improvement (IHI) pioneered the Breakthrough Series (BTS), a short-term improvement project that convenes, in three face-to-face meetings, hospital or clinic teams to make rapid, significant improvement. A distance-learning (virtual) version of the BTS—a VBTS—was conducted.
Methods:A model VBTS was tested with 20 organ-izations, using a well-established topic: improving access and efficiency in primary care. This VBTS took place by Internet and telephone, using Web-based col-laboration software and audioconferencing.
Results: For the 17 organizations completing the VBTS, the average number of days to third-next-available appointment fell from 23 to 10 days (July 2004–June 2005). The Improvement Assessment Scale showed 59% of teams at level 4 or above (“significant” improvement, with most changes implemented, and evi-dence of sustained improvement in outcomes and plans for spread). Potential direct cost savings were about $12,000 as compared with a traditional collaborative. Six months after the VBTS’s conclusion, 70% of the teams that achieved significant improvement either maintained gains or improved their results.
Discussion:Outcomes in a VBTS are potentially com-parable to those in a traditional collaborative, at sub-stantially lower cost. Prerequisites for success include senior leadership’s involvement, team members’ ability to participate, and information technology support.
Since 1995, IHI has sponsored more than 50 BTS col-laboratives, on dozens of topics, involving more than 2,000 teams from more than 1,000 health care organizations. A growing body of literature has considered the effective-ness of the BTS model, with some studies finding some sig-nificant improvements, while other studies find little or no improvement.2–8 Although IHI has demonstrated that the BTS collaborative model can be a valuable change agent,9,10 the model’s design of face-to-face meetings carries inher-ent limitations. A BTS collaborative is both expensive and time-consuming, with the result that many individuals and organizations cannot participate. The virtual BTS (VBTS) was a test of a new model to determine if an entirely elec-tronic version of the BTS collaborative, using Internet and phone, would be feasible and could produce outcomes comparable to those of a traditional, face-to-face BTS. Further, we predicted that a VBTS would significantly reduce costs to participating hospitals and clinics through conservation of staff time, elimination of travel costs, and reduction in tuition costs. We also predicted that the speed, immediacy, and convenience of synchronous and asynchronous distance communication would allow for knowledge transfer and spread of change concepts com-parable to a traditional BTS.
The main outcome measure for the VBTS, as for tra-ditional BTS collaboratives working on reduction in waiting times, was the average number of days to third-next-available appointment. The ultimate aim of the VBTS was to decrease delays both for and at appoint-ments, by using IHI’s BTS methodology, but at greatly reduced cost and involving many more organizations than can feasibly be reached through a traditional face-to-face model. This article reports the results of the demonstration project and its implications.
Developing the Collaborative
Topic
The topic chosen for the VBTS prototype was “improving access and office efficiency in primary care” (defined as a system in which patients can be seen by their primary care provider when they choose, even on the same day). Because four traditional national BTS Collaboratives had already addressed this topic, IHI had established materials already in place, as well as benchmark results for comparison.11,12 Teams in the VBTS tested specific change ideas within the
Access and Efficiency Change Package, a collection of 11 change concepts that have been shown to improve out-comes in previous Collaboratives (Table 1, pages 575–576).
Participating Organizations
Twenty health care organizations were selected to participate in the VBTS. Organizations were selected on the basis of documented characteristics of successful improvement teams,13 including senior leadership involvement, plans to spread the improvement, access to appropriate technology, and assurance that improving access is a primary goal of the organization. IHI’s usual fees for this initial prototype were covered by a grant from the Alfred P. Sloan Foundation.
BTS Model
In the traditional BTS model, participants learn about the topic in face-to-face LSs from faculty experts, who present a vision for ideal care and specific changes necessary to achieve the ideal. A change package is designed to improve performance in the local system, and an improvement advisor guides team members through the steps needed to test, adapt, and implement the changes. Teams test these process changes using the Model for Improvement14during action periods between the LSs. Teams report on and share their experiences, both successes and failures, during monthly phone calls and at the second and third LSs. Each team documents, measures, and reports on its progress monthly through a shared Internet site. Faculty and staff also make month-ly assessments of each team’s progress. The final results of collaborative work are presented at a National Congress and at other meetings.
VBTS Model
To adapt the classic BTS model to a virtual model, we conducted a literature and expert review of e-learning. We incorporated lessons about issues such as the best way to prepare faculty, deliver content, and conduct ses-sions in the virtual environment15,16into the VBTS design.
Technology Issues
Selecting and implementing new technologies was the first step in transforming the face-to-face BTS into a virtual model (Figure 1, page 577). We evaluated
Understand Supply and Demand
Understanding the patterns of both supply and demand on a weekly, monthly, or seasonal basis allows for focused efforts to shape demand to match supply, and/or increase (or decrease) supply during periods of high (or low) demand. Measure supply, measure demand, and then compare the two.
Reduce the Backlog
Backlog consists of appointments on the future sched-ule that have been put off due to lack of space on the schedule to do this work sooner; working down the backlog recalibrates the system to improve access. To reduce and eliminate backlog, first measure it, and then create and use a deliberate backlog reduction plan (e.g., temporarily add appointment slots; tem-porarily add staff and/or schedule additional overtime hours; determine if patient needs can be met without an office visit).
Reduce Appointment Types
Practices with improved access make no distinction between urgent and routine appointments because the goal is to do today’s work today. When the provider is present the patient is seen, and when the provider is absent the patient is offered the choice of an appoint-ment the next time the provider is present or today with another care team member. All other special appointment types, such as those for disease entity or physicals by age groups, can be eliminated.
Develop Contingency Plans
Even if the supply and demand in a clinic are generally in balance, there will be times when there is a surge in demand (demand outstrips supply) that is either expected (e.g., flu season) or unexpected (e.g., many walk-ins on one day). Expected and unexpected variations in supply can also occur (e.g., vacations or emergency sick leaves). To avoid disrupting the normal flow of clinic practice, clinics agree upon a standard protocol to follow for each event, including clear responsibilities for each staff mem-ber. Examples include a policy for late patients; scripts for common occurrences; plans for vacations and sudden provider absences.
Reduce Demand
One key way to improve access is to reduce unnecessary demand for various services so that those patients need-ing a particular service can receive it in a timely way.
Examples of reducing demand include creating alterna-tives to one-on-one visits; managing and decreasing no-show appointments; increasing the interval for return appointments; using “max-packing” to address as many patient needs as possible during the visit in order to reduce future work.
Optimize the Care Team to Increase Supply
The clinic has to understand the types of services it pro-vides, and then decide who should be involved in the work and how the work should be divided among the care team. This approach begins with demand and adjusts supply to meet the demand (within the limits of clinic resources). This is different from an approach that sets an arbitrary care team mix and then tries to fit the demand into the supply. Examples include cross-training staff; reducing variation in provider styles; ensuring that clinicians and staff work to their highest level of experi-ence and skills; establishing standard protocols to move work away from providers.
Balance Supply and Demand for Non-Appointment Work
The supply and demand for non-appointment work (messages, refills, lab review, etc.) needs to be balanced within the timeframe of a day. First, measure the non-appointment work by category for each type of staff member (provider, nurse, medical assistant, receptionist, other), and then compare it to the amount of work time that the worker can deliver. If any one worker has more work (demand) than they can do (supply) each day, that work will either not get done or it will get pushed off to the future. Next, shape the demand, match the appropriate supply to the demand, and work on improv-ing the process.
Synchronize Patient, Provider, and Information
To eliminate delays and smooth the flow for both providers and patients during an office visit, the patient and provider should be in the exam room along with all needed equipment and information (including test results, preventive care screens, etc.) at the stated appointment time. Some specific ideas for synchronizing the appointment processes include start every appoint-ment on time; ensure that all needed information, equipment, and supplies are available for visit; use rooming criteria check sheets to ensure the patient is prepared for the provider (e.g., “shoes off” for diabetes patients).
continued
several types of collaboration software, with the intention of supporting not only the first VBTS but also other IHI projects with Web conferencing needs. The Web communication company we selected pro-vides integrated telephony (audio is available through the Web connection), as well as video- and audio-conferencing capabilities.
IHI’s extranet, a secure section of IHI’s Web site, was used as a central platform on which teams could enter data and track their measures, as well as post qualitative, narrative descriptions of their work (for example, changes tested, barriers experienced), and share presen-tations, team storyboards, and other documents. A col-laborative listserv (e-mail distribution list) was established for both administrative communication and to facilitate content discussion. In addition, the change package, with detailed explanation, was made available on IHI.org.
Planning
The VBTS planning group consisted of three faculty members, chosen for their experience and expertise in the topic; four IHI staff members (authors); and one IHI staff member, who provided technology expertise. As is done for all collaboratives, the planning group developed a project charter that specified the goals, measures, and
expectations of participating teams and IHI; conducted informational phone calls with prospective teams; devel-oped the collaborative time line and monthly review and assessment schedule; and designed the collaborative pre-work. Selection criteria for the organizations to be chosen were refined to ensure the greatest likelihood of success, and teams participated in an electronic applica-tion process on the basis of these criteria—which includ-ed a willingness to participate in a test of the virtual model.
IHI developed measurement strategies to evaluate the progress and results of the participating sites, as well as the measures that would evaluate the VBTS’s success. Experts in distance learning worked with the faculty to adapt the traditional curriculum to a virtual one, and fac-ulty and staff received training and coaching in online teaching and learning.
Conducting the Collaborative
Pre-Launch Activities
In the pre-launch period (the six weeks before the first virtual LS), IHI conducted several activities with the teams that were designed to build community, including training on the IHI extranet and Web communication technologies, presentation of Web-based storyboards, and clinic walkthrough summaries.
Predict and Anticipate Patient Needs
To ensure that patient needs are met and that patients flow smoothly through the clinic process, staff look ahead on the schedule to identify patient needs for a given day or week. This advance planning allows the clin-ic staff time to arrange for specifclin-ic equipment or tests that may be needed either prior to or at the time of the visit, to obtain or prepare all required information for the visit, and to implement a planned care approach.
Optimize the Environment
Improving the flow of work and eliminating waste ensures that the clinical office runs as efficiently and effectively as possible. Examples include moving steps in the system clos-er togethclos-er (e.g., staff that need to communicate regularly should be in the same physical location); standardizing room equipment and set-up; ensuring there are enough exam rooms for each provider to optimize patient flow.
Manage the Constraint
Constraints, or bottlenecks, occur when the demand for a particular resource (e.g., rooms, providers, tests) or part of the system is greater than the available supply. If changes are made to improve parts of a system without addressing the constraint, the changes may not result in reduction of delays and waiting times for the entire system. To identify the constraint, observe where the work is piling up, or where the queues are forming. Look for certain signals within the system, such as places where material or information is in short supply, or where patients or staff are waiting, to help identify constraints. Clinics usually expect that the physician is the constraint, but there may be other factors. To manage the constraint, the practice must first identify the constraint and then drive unnecessary work away from it.
In the storyboard activity, teams created graphics presentation using a template that described the organiza-tions, the team members and their roles, information on the numbers of patients that would be affected by their improvement work, and data on cur-rent delays at appointments and days until third-next-available appointment. Teams posted their storyboards on the extranet for other teams to review and then presented them during the all-team storyboard call.
Teams also completed a clinic walk-through, in which members “became” patients with a specified clinical issue, making an appointment, driving to the clinic, finding a parking space, filling out forms, and waiting for a provider— in short, experiencing each step of the process patients go through at the local
site. Team members documented their ideas for improve-ment, as well as their feelings about the experience. These results were posted on the extranet for access by all teams.
All these activities were aimed at helping teams get to know one another, identifying other teams with similar data and challenges, increasing comfort with the VBTS technology, introducing the models and measurement sys-tem, and setting expectations. A particular focus of the pre-launch period was building the collaborative commu-nity culture that develops at traditional, face-to-face LSs.
Learning Sessions
The first LS was presented via the Internet and tele-phone for five hours daily for three days, for a total of 15 content hours. The agenda included much interaction during lectures, with frequent breaks and breakout time for teams to work together with faculty assistance. Faculty and teams used the Web-based chat modality extensively during the session, giving faculty who were not formally presenting an opportunity to clarify or aug-ment pertinent points and giving team members an opportunity to ask questions. During the first LS, teams learned about (1) the online collaborative technology and the implications of distance collaboration and (2)
the change package and Model for Improvement. Each team developed an aim statement and set specific goals for reduction in delays (both for and at appointments) and determined the initial changes they would test.
The schedule for the second LS was modified based on feedback from the first session. This session was held on two consecutive six-hour days and included more interaction among teams and between teams and facul-ty; longer breaks; and more time built in between activi-ties. The third LS was similar to the second but was characterized by more team input (as opposed to faculty presentation) than the second LS. As in a traditional BTS, the VBTS used an “all teach, all learn” environment, in which the faculty selected the top two performing teams to present their tests and data.
Because the LSs were offered online, requiring no travel outside of the community, many organizations set up conference rooms where additional members of the organization beyond the immediate improvement team could attend these important events. The conference room was set up with a speaker phone, computer, pro-jector, and screen, allowing many more people to hear, see, and participate in the session. These participants included additional members of the direct care team,
Figure 1.Selecting and implementing new technologies was the first step in transforming the face-to-face BTS into a virtual model. AP, action period; VLS, virtual learning session.
members of new teams to whom spread of the improve-ments was intended, and senior leadership. While some of these additional participants attended the entire ses-sion, others selected the sessions that were of particular interest to them, and simply went to the conference room at the time when the session that they were most interested in was being presented.
Action Periods
The action periods, which occur between LSs, were generally the same as those that take place in a tradi-tional BTS. In the VBTS, they included additradi-tional syn-chronous work (via large all-collaborative conference calls and small-group cluster phone calls, held monthly, led by faculty, and organized by time zone). The smaller groups allowed teams to work on solving specific prob-lems with input from others. Asynchronous work also took place (for example, listserv communication, dis-cussion groups, team reports on changes and measures). Content information about how to improve access was available to the teams at IHI.org. Discussion groups, project management tools, and reporting tools were located on IHI’s extranet, where each team maintained their own data and their own team home page.
Each month, teams submitted a report including data for each of their key measures, along with an update on changes tested and implemented, barriers encountered, and lessons learned. Faculty read and analyzed the reports, and responded with coaching via the listserv and through small-group cluster calls. Teams were encouraged to read each other’s reports, looking for tips, ideas, and common experiences.
National Congress
The final event of the VBTS was a virtual National Congress, held in June 2005, at which teams shared their learning with the public. Public members received mate-rials via e-mail and were given an electronic link to use to participate in the Congress. Registrants were encour-aged to test their ability to connect days to weeks in advance by participating in an electronic session set up for that purpose. On the day of the event, the public con-nected via phone and Internet to the Web communica-tion company’s platform and participated in plenary and breakout sessions, as well as the chat room.
Measures
Measures designed to evaluate the success of the VBTS fell into the following two main categories:
■ Access measures, which showed whether the changes the teams made on site led to reductions in delays for and at appointments (for example, number of days to third-next-available appointment, cycle time, daily sup-ply and demand, and panel size).
■ VBTS versus BTS comparison measures, which were used to evaluate the relative success of the VBTS compared with either the target for any BTS or with a traditional face-to-face BTS collaborative. A 1-to-5 Improvement Assessment Scale (IAS) was used; the scale helps collaborative directors and improvement advisors determine how well teams are doing in meeting improvement goals and implementing changes. (A detailed description of the assessment scale is provided in Table 2, page 579.) IHI, which developed the IAS in 1998, has used it to assess all teams participating in its BTS collaborative projects.
Results
Seventeen of the initial 20 organizations completed the col-laborative. Three organizations elected to drop out of the collaborative, owing to a change in senior leadership, a change in day-to-day leadership, and competing priorities.
Days to Third-Next-Available Appointment
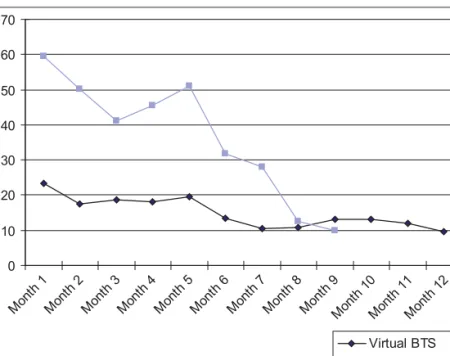
Average days to third-next-available appointment is a measure used by teams to track performance at the indi-vidual clinician level. In the VBTS collaborative, this measure fell from 23 days to 10 days during 12 months (60% reduction), as shown in Figure 2 (page 580). The Shewhart statistical process control (SPC) chart shown in this figure, with limits calculated to the end of the col-laborative, indicates that this improvement trend was significant. A comparison of the same measure in a tra-ditional BTS collaborative that IHI also conducted in 2004–2005 (Figure 3, page 581) shows a decline from 60 days at the start to just under 10 days during a 9-month period (83% reduction). Although the starting points for days to third-next-available appointment for teams in the VBTS and BTS differ considerably, more research is necessary to ascertain the reasons for this difference; it may have reflected the selection of organizations more
experienced in improvement for the VBTS. However, teams in both the VBTS and the BTS made significant improvements, with reduction in days to third-next-available appointment to an average of about 10 days.
IAS Assessments
As shown in Figure 4 (page 582), average monthly VBTS assessments were comparable to those in the traditional BTS.
A follow-up study completed six months after the VBTS’s conclusion showed that of the 10 teams that had achieved significant improvement (assessment of 4) by the collaborative’s end, 7 had maintained their gains or improved their results six months later (Table 3, page 582). Figure 2 shows average waiting time data for the six months after the conclusion of the VBTS (July through December 2005).
Discussion
This demonstration project shows that the VBTS collabo-rative achieved results that are comparable to those of a traditional collaborative on the same topic and at signifi-cantly reduced costs for both the participating and host organizations. However, further testing and refinement of the VBTS model, as well as ongoing comparison with tra-ditional face-to-face collaboratives should help establish over time the conditions under which the VBTS can con-tinue to achieve similar results to the traditional method. For example, in this first test of the VBTS, the number of teams was limited to 20, and faculty and staff with proven track records were selected to lead this work. In addition, the topic and measures selected were mature and robust. We recommend that future tests of the VBTS add more wide-ranging conditions such as a greater num-ber of teams, less-experienced faculty, and use of a
Table 2. Improvement Assessment Scale for Virtual Breakthrough Series Collaborative
Assessment/Description Definition
1 Forming team
Team is formed; target population is identified; aim is determined; and baseline measurement begins.
1.5
Planning for the project begins Team is meeting, discussion is occurring. Plans for the project are made. 2
Activity, but no changes
Team actively engaged in development, research, discussion but no changes are tested.
2.5
Changes tested, but no improvement
Components of the model being tested but no improvement in measures. Data on key measures are reported.
3
Modest improvement
Initial test cycles are completed and implementation begun for several compo-nents. Evidence of moderate improvement in process measures (daily demand, daily capacity, team member/patient continuity).
3.5 Improvement
Some improvement in outcome measures (third-next-available appointment and office visit cycle time); process measures of daily demand, daily capacity, and team member/patient continuity continuing to improve; Plan-Do-Study-Act test cycles on all components of the change package; changes implemented for many components of the change package.
4
Significant improvement
Most components of the change package are implemented for the population of focus. Evidence of sustained improvement in outcome measures (third-next-avail-able appointment and office visit cycle time); halfway toward accomplishing all of the goals. Plans for spread, consistent with the team’s aims, are prepared.
4.5
Sustainable improvement
Sustained improvement in most outcome measures (third-next-available appoint-ment, future capacity, and office visit cycle time); 75% of goals achieved; plans for spread of the changes are in place.
5
Outstanding sustainable results
All components of the change package implemented, all goals of the aim are accomplished, outcome measures at national benchmark levels, and spread to a larger population begins.
less-developed topic. By testing the VBTS under broader conditions, an even more robust model should emerge.
Because the results from this first VBTS are compara-ble to those of the traditional BTS model on the same topic, the business impact is based on potential cost sav-ings not benefits. For a participating organization, the expected savings in direct costs that can be realized from participation in a VBTS and not having to travel to ses-sions is $11,979 (Table 4, page 582). These potential dif-ferences in cost are associated with the three LSs (since the action periods and other work do not differ between the models). Reductions in costs are achieved by not using staff time to travel to LSs and by not incurring trav-el costs. Newly incurred costs, however, are those associ-ated with hosting the LSs at the participant’s home site and with long-distance phone charges for the LSs.
On the basis of the results from this initial demonstra-tion, future VBTS collaboratives will require some modifi-cations to maximize the likelihood of success and sustained improvement. Although the Web communica-tion technology was well received by most of the partici-pants, support is needed at local sites, both from information technology (IT) and from senior leadership. IT support must be available, especially before and at the
first LS, to ensure access and connectivity. For example, some participants were unable to get online or did not know that they could not dial long distance from their conference room. For Web-based sessions, IHI now imple-ments connection testing, in which participants can test their audio and Web connection within a certain time interval before the actual session. Streamlining of the electronic platforms for reporting is also needed (for both VBTS and traditional BTS) to eliminate potential confu-sion and thus to increase reporting and participation. For example, participants were required to enter data on the extranet as well as complete a monthly progress report spreadsheet and upload this document to the extranet, which some participants felt was a bit extraneous.
Changes at the participating organizations, which are needed to help ensure success, are the same as those identified in traditional collaboratives, such as a greater involvement by senior leadership, stable staffing and bal-anced supply (clinician availability) and demand (for serv-ices), and a committed core group and an organized team. Even though the participants do not travel to the collabo-rative, time must be built in to the providers’ schedules to ensure their availability when the sessions take place; clinic and personnel schedules and team members’
Figure 2.In the Virtual Breakthrough Series (VBTS) collaborative, the average number of days to third-next-available appointment fell from 23 days to 10 days during 12 months (60% reduction).
workloads must be modified to accommodate these sessions and to prevent team members from being distracted to attend to local “urgent matters.” Participation in distance learning may be more “invisible” and thus seem less important than travel-ing to meettravel-ings. The time and effort commitment for the participants are the same, except for actual travel time, but this may not be readily apparent to those outside the team.
The key success factors for teams in the VBTS, which are similar to those identified for teams in a tradi-tional BTS, include the following:
■ Senior leader oversight, commit-ment, and involvement
■ High degree of physician involve-ment and championship of the improvements
■ Vigilance and attention to detail from the day-to-day manager of this work
■ Diligent testing and implemen-tation of a high percentage of the change concepts
■ The ability to modify supply to balance demand dur-ing the collaborative’s time frame
■ Deliberate collection and analysis of data
On the basis of these results, IHI is considering VBTS collaboratives for future projects. Larger groups will be enrolled to assess scalability, and additional topic areas will be tested to ensure generalizability. Although IHI has more to learn from further testing, we hope that other health care organizations will test the virtual approach to conduct their own collaboratives to provide more insights into the virtual model’s performance.
Two VBTS Teams
Sidebar 1 (pages 583–584) highlights the work of two of the more successful teams in the VBTS. The biggest factor separating the best teams from others was the ability to balance supply and demand—that is, to make the changes necessary to bring the demand for their services in line
with the supply (mostly clinicians) available. Some teams were not able to make this happen completely within the collaborative’s time period. Without this, it is impossible to greatly reduce or maintain the core outcome measure of days to third-next-available appointment.
The work reported in this article was supported in part by a grant from the Alfred P. Sloan Foundation. The authors express their thanks to Faith McLellan, Ph.D.; Jane Roessner, Ph.D.; Val Weber; Frank Davidoff, M.D.; and Andrew Hackbarth for their assistance in the preparation and revision of this manuscript. The Institute for Healthcare Improvement is grateful to its faculty, including Mark Murray M.D., M.P.A.; Michael Davies, M.D.; and L. Gordon Moore, M.D.; Erik Bailey, technical director; and the pioneering organizations that participated in the Virtual Breakthrough Series for their support and contributions to this work.
J
Figure 3.The averages of this metric across participating clinicians, taken monthly, are shown. For clinicians taking multiple measurements per month, those values were aggregated (averaged) within that month before the gener-al aggregation was made. Some clinicians did not have data for some months in the measurement period, but those clinicians’ data were still included in the aggregate for periods in which they had data. Data are drawn from IHI’s Improving Access and Efficiency in Primary Care BTS, October 2004–June 2005. BTS, Breakthrough Series.
Average Days to
Third-Next-Available-Appointment, Traditional BTS and the Virtual BTS
Barbara Boushon, B.S.N., is Director, Institute for Healthcare Improvement (IHI), Cambridge, Massachusetts.
Lloyd Provost, M.S.,is Statistician, Associates in Process Improvement, Cambridge. Janice Gagnonis Manager, New Product Development, and Penny Carver is Senior Vice President, IHI. Please address correspondence to Penny Carver, pcarver@ihi.org.
Figure 4.Average monthly assessments were comparable between the Virtual Breakthrough Series (VBTS) and the tradi-tional BTS. IAS, Improvement Assessment Scale.
IAS Assessments for a Traditional BTS and Virtual BTS
* “4” refers to the assessment in Table 3.
Table 3. Improvement Assessment Scale (IAS) Results for Virtual Breakthrough Series Teams After Six Months*
< 4 IAS assessment at end of Collaborative 4 IAS assessment at end of Collaborative
< 4 IAS assessment six months later
3 (43%)
Still no breakthrough, but continued to improve
2 (20%)
Did not hold gains 4 IAS assessment
six months later
0 (0%)
Breakthrough after end
7 (70%)
Held gains
Did not report six months later 4 (57%) 1 (10%)
Total teams 7 10
Table 4. Direct Cost Savings in a Virtual Breakthrough Series (VBTS) and a Traditional BTS
Cost Impact Changes in Participant Costs Participant Assumptions
– Travel costs to learning session (LS) –$9,000 3 LSs × 3 people × $1000 = $9000 – Time saved from not traveling to LS –$3,600 3 LSs × 3 people × 1 day x $400 = $3,600 + Supplies and printing costs for participants
at site
+$405 ($17 per person × 5 +$50 labor) × 3 LS = $405
+ Long-distance phone charges for LS ($.08–$.05/min, < $200)
+$216 3 LSs × 10 hours = $216
Marshfield Clinic, Indianhead Center, Rice Lake, Wisconsin
The pilot began with an initial group of five family prac-tice physicians. Marshfield Clinic tested and eventually implemented the following changes, among others:
■ Synchronize patient, provider, and information:
Start every appointment on time by asking patients to arrive 15 minutes before a scheduled appointment.
■ Understand supply and demand:The fact that Monday had much more demand than supply resulted in a change to a provider’s usual day off.
■ Obtain physician and staff buy-in:Set expectations, trained staff on the concepts of advanced access, and shared data to display positive changes for patients.
■ Assign physician champion:Instrumental in coach-ing and communicatcoach-ing with providers the need for change and how it would benefit them.
■ Reduce the backlog:Physicians created backlog reduction plans.
■ Used future capacity chartto determine when sev-eral providers would be out of the office on a given day and created contingency plan.
■ Created and implemented service agreements
between primary care and specialty care offices, including urology, ENT, nephrology, and orthopedics.
After achieving same-day access, Marshfield Clinic spread the changes to all 12 family practice physicians in the clinic, plus the pediatrician. The initiative was adopted sys-temwide, with spread to other departments in the clinic (internal medicine, ophthalmology, urology, and surgery).
Results
Days to third-next-available appointment decreased in all departments (data not shown). In family practice and pediatrics, waiting times fell from a high of 24 days to 1 day (Figure, below).
PracticePartners, Greater Portland Medical Group, Westbrook, Maine
PracticePartners was a five-provider practice, including four physicians and one physician assistant. The physi-cian assistant left the practice and was not replaced, which caused many access issues with appointment scheduling, telephones, and so on. PracticePartners test-ed and eventually implementtest-ed the following changes, among others:
■ Understand and balance supply and demand:Provider schedules are reviewed during morning huddles and are used to anticipate needs and prevent constraints. Trends are identified and schedules are altered to satis-fy demand. For example, high-demand days have fewer
physicals to accommodate acute visits. Physicals are scheduled on days with lower call volume.
■ Reduce the backlog:
Providers created back-log reduction plans.
■ Reduce appointment types:Appointment types were reduced to three types: OV15 (sick visits, follow-up visits); OV30 (male physical exams, new patients); and OV45 (female physical exams with Pap tests).
Sidebar 1. Two of the Virtual Breakthrough Series Collaborative Teams
continued
1. Institute for Healthcare Improvement: The Breakthrough Series: IHI’s Collaborative Model for Achieving Breakthrough Improvement, 2003.
http://www.ihi.org/IHI/Results/WhitePapers/TheBreakthroughSeries IHIsCollaborativeModelforAchieving+BreakthroughImprovement.htm (last accessed Aug. 4, 2006).
2. Øvretveit J., et al.: Quality collaboratives: Lessons from research.
Qual Saf Health Care11:345–351, Dec. 2002.
3. Mittman B.S.: Creating the evidence base for quality improvement collaboratives. Ann Intern Med140:897–901, Jun. 2004.
4. Landon E., et al.: Effects of a quality improvement collaborative on the outcome of care of patients with HIV infection: The EQHIV Study.
Ann Intern Med140:887–896, Jun. 1, 2004.
5. Schonlau M., et al.: Evaluation of a quality improvement collabora-tive in asthma care: Does it improve processes and outcomes of care?
Ann Fam Med3:200–208, May–Jun. 2005.
6. Horbar J.D., et al.: Collaborative quality improvement to promote evidence based surfactant for preterm infants: A cluster randomised trial. BMJ329:1004, Oct. 30, 2004.
7. Cretin S., Shortell S.M., Keeler E.B.: An evaluation of collaborative interventions to improve chronic illness care: Framework and study design. Eval Rev 28:28–51, Feb. 2004.
8. Weeks W.B., et al.: Using an improvement model to reduce adverse drug events in VA facilities. Jt Comm J Qual Improv27:243–254, May 2001.
9. Horbar J.D., et al.: Collaborative quality improvement for neonatal intensive care. NIC/Q Project Investigators of the Vermont Oxford Network. Pediatrics 107:14–22, Jan. 2001.
10. Flamm B.L., Berwick D.M., Kabcenell A.: Reducing cesarean sec-tion rates safely: Lessons from a “breakthrough series” collaborative.
Birth25:117–124, Jun. 1998.
11. Nolan T.W., et al.: Reducing Delays and Waiting Times Throughout the Healthcare System.Boston: Institute for Healthcare Improvement, 1996.
12. Murray M., Berwick D.M.: Advanced access: Reducing waiting and delays in primary care. JAMA 289:1035–1040, Feb. 26, 2003.
13. Mills P.D., Weeks W.B.: Characteristics of successful quality improvement teams: Lessons from five collaborative projects in the VHA. Jt Comm J Qual Saf30:152–162, 2004.
14. Institute for Healthcare Improvement: How to Improve.
http://www.ihi.org/IHI/Topics/Improvement/ImprovementMethods/ HowToImprove/ (last accessed Aug. 4, 2006).
15. Palloff R., Pratt K.: Building Learning Communities in Cyberspace.San Francisco: Jossey-Bass Publishers, 1999.
16. Aragon S.R. (ed.): Facilitating Learning in Online Environments.
New Directions for Adults and Continuing Education, no. 100, Winter 2003.
References
■ Develop contingency plans:Freeze providers’ schedules for two weeks after doctors are on serv-ice at the hospital or on vacation. Open up first week during the last week that the provider is on
service, filling in prebook slots as patients call. Open up sec-ond week the first week that the provider is back. Office also freezes some prebook slots in remaining providers’ schedules to accommodate patients of the provider who is away.
Results
The practice’s goal was to reduce days to third-next-available appointment to less than 1 day (when the project started, average time was 30–35 days). By the end of the VBTS, the number of days to the third-next-available appointment for all providers was less than two days (Figure, left; each line repre-sents one physician).
The practice found that the key to success was buy-in from all physicians and staff.