University of Massachusetts Amherst University of Massachusetts Amherst
ScholarWorks@UMass Amherst
ScholarWorks@UMass Amherst
Masters Theses Dissertations and Theses
July 2018
Integrating Cover Crop Mixtures and No-Till for Sustainable Sweet
Integrating Cover Crop Mixtures and No-Till for Sustainable Sweet
Corn Production in the Northeast
Corn Production in the Northeast
Julie S. Fine
University of Massachusetts Amherst
Follow this and additional works at: https://scholarworks.umass.edu/masters_theses_2
Part of the Agricultural Economics Commons, Agricultural Science Commons, Agronomy and Crop Sciences Commons, and the Weed Science Commons
Recommended Citation Recommended Citation
Fine, Julie S., "Integrating Cover Crop Mixtures and No-Till for Sustainable Sweet Corn Production in the Northeast" (2018). Masters Theses. 637.
https://scholarworks.umass.edu/masters_theses_2/637
This Open Access Thesis is brought to you for free and open access by the Dissertations and Theses at ScholarWorks@UMass Amherst. It has been accepted for inclusion in Masters Theses by an authorized administrator of ScholarWorks@UMass Amherst. For more information, please contact
INTEGRATING COVER CROP MIXTURES AND NO-TILL FOR SUSTAINABLE SWEET CORN PRODUCTION IN THE NORTHEAST
A Thesis Presented by
JULIE STULTZ FINE
Submitted to the Graduate School of the
University of Massachusetts Amherst in partial fulfillment of the requirements for the degree of
MASTER OF SCIENCE May 2018
© Copyright by Julie S. Fine 2018 All Rights Reserved
INTEGRATING COVER CROP MIXTURES AND NO-TILL FOR SUSTAINABLE SWEET CORN PRODUCTION IN THE NORTHEAST
A Thesis Presented by
JULIE STULTZ FINE
Approved as to style and content by:
______________________________________ Masoud Hashemi, Chair
______________________________________ Wesley Autio, Member
______________________________________ Prasanta Bhowmik, Member
___________________________________ Li-Jun Ma, Director
DEDICATION
For my parents, Rick and Josie, who always encourage me to grow. For Jacob, with gratitude for much love and support.
For my daughters, Meira and Nessa, who I hope learned something valuable from watching their mother pursue a challenge and a dream.
“The important thing is not to stop questioning. Curiosity has its own reason for existence. One cannot help but be in awe when he contemplates
the mysteries of eternity, of life, of the marvelous structure of reality. It is enough if one tries merely to comprehend a little of this mystery each day.
ACKNOWLEDGEMENTS
I would like to thank my advisor, Masoud Hashemi, for having patience with me, having faith in me, and giving me room to grow. I’m so grateful he was willing to take on a nontraditional graduate student like myself. My colleagues Emily Cole and
Samantha Glaze-Corcoran were tremendously supportive resources and helped me solve countless problems in the field, in the lab and on paper. Talia Aronson, my amazing research assistant deserves much credit; without her hard work and attention in the field and the lab it would have taken another five years to complete this research. Thank you to Sarah Weis for keeping our lab running and teaching me the mysterious ways of the Lachat.
I appreciate the hard work of Neal Woodard and Zack Zenk at the UMass Research Farm in S. Deerfield, without whom this research could not happen.
I’m so grateful to my family and friends, including my parents who once donned lab coats to help process soil samples, for their enduring love, encouragement, and support. Megan, Sharon, Leah, Deb, Larry, Emily, Aaron, Dave, Julie, and Dan, thank you!
I want to acknowledge the importance of the Northeast SARE Graduate Student Grant and the Lotta Crabtree Graduate Fellowship for financial support.
ABSTRACT
INTEGRATING NO-TILL AND COVER CROP MIXTURES FOR SUSTAINABLE SWEET CORN PRODUCTION IN THE NORTHEAST
MAY 2018
JULIE STULTZ FINE, B.A., VASSAR COLLEGE M.S., UNIVERSITY OF MASSACHUSETTS AMHERST
Directed by: Professor Masoud Hashemi
Fall-planted forage radish (Raphanus sativus L. longipinnatus) cover crops have shown successful weed suppression and recycling of fall-captured nutrients. This research evaluated the nutrient cycling and weed suppressive benefits of forage radish cover crop mixtures to develop an integrated system for no-till sweet corn (Zea mays L. var rugosa) production that improves crop yield and soil health. Treatments included forage radish (FR), oats (Avena sativa L.) and forage radish (OFR), a mixture of peas (Pisum sativum subsp arvense L.), oats and forage radish (POFR), and no cover crop control (NCC). Subplots were assigned to nitrogen fertilizer treatments to evaluate N sufficiency and timing: 0 kg N ha-1 as the control, 28 kg N ha-1 at side-dress, and 56 kg N ha-1 with application split between planting and side-dress. Results indicated that POFR and OFR provided improved N cycling and sweet corn yield compared with FR and NCC. Early season N from decomposing cover crop residue was sufficient to eliminate the need for N fertilizer at sweet corn planting, thereby reducing input costs and risks of environmental pollution.
TABLE OF CONTENTS Chapter Page ACKNOWLEDGEMENTS ... v ABSTRACT ... vi LIST OF TABLES ... ix LIST OF FIGURES ... x
1. USING COVER CROPS AND NO-TILL FOR INCREASED AGRICULTURAL SUSTAINABILITY ... 1
No-Till Management ... 3
Cover Crops ... 4
Radish Cover Crops ... 5
Mixtures Versus Monocultures ... 6
Cover Crops in No-Till Production ... 7
Increasing Sustainability in Sweet Corn ... 8
Weed Management in Sweet Corn ... 10
Rationale ... 10
Objectives ... 11
References ... 11
2. CREDITING COVER CROP MIXTURES FOR NO-TILL SWEET CORN YIELD AND QUALITY ... 17
Hypotheses ... 22
Objectives ... 22
Materials & Methods ... 23
Experimental Site ... 23
Treatments ... 24
Statistical Analysis ... 28
Results and Discussion ... 29
Aboveground Cover Crop Biomass ... 29
Total Cover Crop Biomass ... 32
Cover Crop Carbon and Nitrogen Content ... 36
Year Effect on Sweet Corn Yield ... 39
Spring Soil Temperature ... 40
Influence of Cover Crop on Soil Nitrate for Sweet Corn ... 42
Soil Biological Activity ... 48
Sweet Corn Yield ... 49
Cover Crop Effects on Sweet Corn Yield ... 50
Influence of Supplemental N Fertilizer on Sweet Corn Yield ... 52
Post-Harvest N Sufficiency Assessment ... 56
References ... 63
3. WEED SUPPRESSION IN WINTER-KILLED RADISH COVER CROP MIXTURES ... 71
Forage Radish as a Cover Crop ... 72
Spring Weed Suppression ... 73
Cover Crop Mixtures ... 73
Conservation Tillage for Vegetable Production ... 74
Sweet Corn in No-Till Production ... 75
Weed Management in Sweet Corn ... 76
Rationale ... 77
Objectives ... 77
Hypotheses ... 78
Materials & Methods ... 78
Experimental Site ... 78
Statistical Analysis ... 80
Results and Discussion ... 81
Fall Weed and Cover Crop Biomass Production ... 81
Spring Biomass Production ... 84
Conclusion ... 88
References ... 89
4. ECONOMIC ANALYSIS OF COVER CROP BENEFITS FOR NO-TILL SWEET CORN PRODUCTION ... 93
Conclusion ... 96
Cover Crop Mixtures for the Future ... 97
Research Implications ... 99
References ... 99
LIST OF TABLES
Table Page
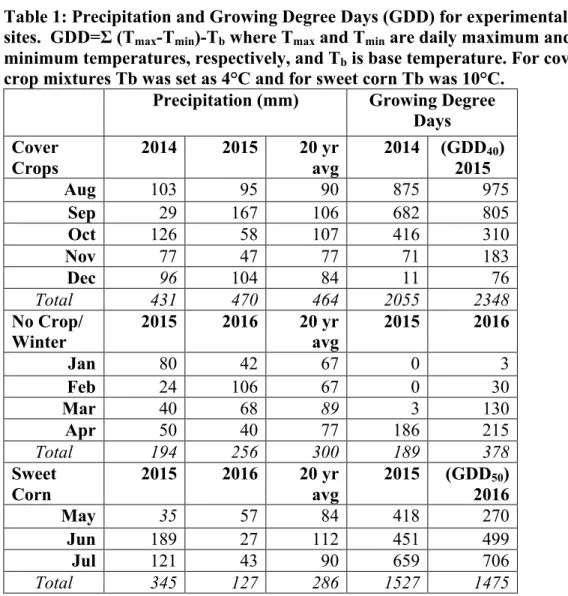
1. Precipitation and Growing Degree Days (GDD) for experimental sites. GDD=Σ (Tmax-Tmin)-Tb where Tmax and Tmin are daily maximum and
minimum temperatures, respectively, and Tb is base temperature. For
cover crop mixtures Tb was set as 4°C and for sweet corn Tb was
10°C. ... 23 2. Cover crop seeding rates for 2014 and 2015. ... 24 3. Field activity at UMass Research Farm, S. Deerfield, MA. ... 26 4. Cover crop biomass characteristics at experimental site in both years.
Years analyzed separately. Treatments with different letters indicate significant differences (Tukey’s HSD p<0.05). No letter indicates no
significant differences. ... 33 5. Solvita soil respiration test results for 2015 and 2016. ... 49 6. Field activity at UMass Crop and Animal Research Farm in S. Deerfield,
MA. ... 79 7. Precipitation and Growing Degree Days (GDD) for experimental sites.
GDD=Σ (Tmax-Tmin)-Tb where Tmax and Tmin are daily maximum and
minimum temperatures, respectively, and Tb is base temperature. For
cover crop mixtures Tb was set as 4°C and for sweet corn Tb was
10°C. ... 80 8. Aboveground biomass of cover crops, weeds, and respective N content, in
November 2014 and 2015. Cover crops planted August 23, 2014 and August 24, 2015. Year data analyzed separately. Treatments with
different letters indicate significant differences (Tukey’s HSD p<0.05). .... 82 9. Cover crop treatment seeding rates and seed costs. ... 93 10. The cover crop impact on overall sweet corn profit. Costs are indicated by
parentheses. Costs were subtracted from profits resulting from cover
LIST OF FIGURES
Figure Page
1. Aboveground cover crop biomass measured in November prior to
winter-kill. ... 30 2. Total cover crop dry matter by species, including FR roots, for 2014 and
2015. ... 35 3. Nitrogen in total cover crop dry matter, November 2014 and 2015. ... 37 4. Soil temperature as affected by cover crop treatment prior to sweet corn
planting from April 22 to May 4, 2015 and April 22 to May 8, 2016. ... 41 5. Soil nitrate during the 2015 growing season. Plots received no additional
N fertilizer. Green arrows indicate when sweet corn was seeded. Red arrows indicate peak N crop demand. ... 42 6. Soil nitrate during the 2016 growing season. Plots received no additional N
fertilizer. Green arrows indicate date of sweet corn planting. Red
arrows indicate peak N crop demand. ... 44 7. Photo of sweet corn plots at V5 growth stage, just prior to ... 47 8. Pre-sidedress Nitrate Test (PSNT) concentrations of nitrate at V5 stage of
sweet corn growth in mid-June 2015 and 2016. ... 48 9: Sweet corn yield as affected by cover crop treatment, measured by
marketable ears (left) and ear fresh weight (right). Values are averaged over all N treatments over two years. Different letters in
columns indicate significant differences (Tukey’s HSD p<0.05). ... 51 10. Sweet corn yield as affected by supplemental N fertilizer rate. Values are
averaged over all cover crop treatments and two years. ... 53 11. Proposed interpretations of the at-harvest stalk N test for sweet corn
excerpted from Heckman, et al., 2002. ... 57 12. Corn stalk nitrate test values for cover crop treatments at each level of N
fertilizer treatment in 2015 (left) and 2016 (right). ... 57 13. Nitrogen Use Efficiency (NUE) of sweet corn following cover crop
treatments. NUE= (fresh weight yield in N-treated cover crop plots –
14. Relationship between cover crop dry matter and weed dry matter by cover crop treatment just prior to winter-kill in November 2014 (left) and
November 2015 (right). ... 83 15. Spring weed dry matter and weed density in plots following cover crop
treatment, prior to herbicide application, April 2016. Treatments with
different letters indicate significant differences (Tukey’s HSD p<0.05). .... 85 16. Relationship between November cover crop biomass and April weed
biomass (prior to termination and sweet corn planting). ... 86 17. Summer weed dry matter and weed density in plots following cover crop
treatment, June 2016. Treatments with different letters indicate significant differences (Tukey’s HSD p<0.05). No significant
differences were observed in weed dry matter. ... 86 18. Average cost to achieve N sufficiency of 145 kg ha-1 utilizing cover
CHAPTER 1
USING COVER CROPS AND NO-TILL FOR INCREASED AGRICULTURAL SUSTAINABILITY
Soil is a finite resource. The creation of an inch of topsoil requires thousands of years of transformation of parent rock and plant material by forces of wind, rain, and biological activity. The scale of soil creation is beyond human time, and therefore humans cannot afford to lose soil faster than it can develop. The current movement to consider soil health, not only in terms of soil conservation but also in regard to function and sustainability, is crucial for food production on a planet with a growing population and limited arable land. The word ‘sustainable’ refers to something that can be
maintained or upheld. A sustainable agricultural production system is economically viable, reduces off-farm inputs, eliminates farm-source pollution, uses minimal chemical pest controls, and promotes healthy soil.
Conserving topsoil has been a concern of American farmers since the Dustbowl of the 1930s, but the concept of “soil health” has been more recently evolving. The Natural Resource Conservation Service, the soil conservation arm of the USDA, defines soil health as “the continued capacity of soil to function as a vital living ecosystem that sustains plants, animals, and humans” (USDA-NRCS). Practically speaking, this means a soil that has the capacity to regulate water flow, absorbing and releasing water in
response to moisture conditions. This means a soil that is hospitable to life, from bacteria and fungi to invertebrates and small mammals. This means a soil that is a good growing medium for crops, in terms of providing structural support, nutrient release, and water holding capacity.
There is no definitive test for soil health, because there are no absolute values or parameters to measure and the results vary depending on soil type. Instead, soil health assessments focus on physical, chemical and biological qualities of soil. Physical
qualities include aggregate stability, available water capacity, and surface and subsurface hardness. Chemical qualities include cation exchange capacity, macro- and
micronutrients, and soil pH. Biological qualities include soil carbon, soil protein, soil respiration and soil organic matter (SOM). Many researchers describe SOM as being at the heart of soil health because it influences all three spheres, the biological, chemical and physical. Research has shown that SOM improves crop yield response, soil pH buffering, aggregate stability, erosion resistance, water infiltration, and soil compaction (Balesdent et al., 2000; Brock et al., 2011; Fageria, 2012). Without sufficient SOM it is impossible to have a healthy soil and optimal crop yield.
In most agricultural soils, a healthy range of SOM is 3-6% and there are
significant challenges to increasing percentage of SOM without massive expense or loss of productivity (Magdoff and Weil, 2004). The main approaches to building SOM are minimizing loss and increasing inputs of organic matter. SOM loss is prevented by 1) decreasing erosion that washes away SOM particles, 2) decreasing tillage that oxidizes SOM, and 3) reducing crop residue loss, adding organic matter. Unfortunately, SOM and soil health are often at odds with the intensive tillage requirements of many crops (Hoyt, 1986). Tillage is needed to incorporate reside and create a fine seedbed, but destroys soil aggregates and oxidizes SOM.
No-Till Management
Farmers have been transitioning to no-till as an effective way to reduce soil erosion, increase water infiltration, reduce tractor work, and improve soil health. The development of herbicides and specialized planting equipment in the 1950s and 1960s allowed growers to manage their crops without tillage. This revolution of no-till agriculture in the United States has increased use of no-till practices to almost 75% of midwestern corn and soybean growers. The primary no-till crops are corn (Zea mays), soybean (Glycine max), wheat (Triticum aestivum), oats (Avena sativa) and cotton (Gossypium hirsutum), the majority of which are grown over vast acreage and rely on chemical weed control.
Tillage damages important functions of soil, such as soil aggregates and SOM. Aggregates are held together by biological products and chemical bonds, which are essentially fragmented by tillage implements. By reducing or eliminating tillage, soil aggregates remain intact, which results in reduced soil erosion, increased water infiltration, and improved soil structure and function (Hobbs, 2007; Hoyt, 1986; Lal, 2004; Six et al., 1999).
Major changes occur in soil ecosystems with the elimination of tillage. The soil food web shifts toward fungal dominance and organic matter residue becomes more stratified (Stubbs et al., 2004). In addition, the transition to no-till increases soil
mycorrhizal associations and earthworm populations. Weed pressure is reduced because new weed seeds aren’t brought to the soil surface. When no-till systems are integrated with cover crops, multiple benefits to the soil and cash crops are significantly enhanced (Kuo et al., 1997; Sainju et al., 2002; Sainju et al., 2005).
Cover Crops
Cover crops are select plant species grown for multiple agronomic benefits: soil protection, compaction reduction, nitrate scavenging, nitrogen fixation, biomass
production, weed suppression, or beneficial insect habitat. The term “cover crop” is used generally and can include summer or winter crops grown for various purposes: green manures, catch crops, nitrogen-fixation, and high-residue mulch. Cover crops have proven to be effective at scavenging residual fall nitrate to prevent winter N leaching (Kristensen and Thorup-Kristensen, 2004; Meisinger and Delgado, 2002; Möller and Reents, 2009). Deep rooting catch crops can reduce nitrate losses due to leaching up to 95% when compared with fallow plots (Cooper et al., 2017).
While cover crops are universally recognized as an N sink, their biomass residue can be an N source for subsequent cash crops. In general, the main sources of nitrogen are supplemental fertilizer, soil organic matter, and decomposing plant residue (from cash crop or cover crop). Soil organic matter mineralizes with biological activity at moderate temperatures and sufficient soil moisture. Plant residue, from previous cash crops or from cover crops, decomposes at rates dependent on temperature, moisture, and pH. Cover crops can serve to mediate N, from soil excess to plant sufficiency under the right circumstances and conditions.
The key to maximizing benefits from cover crops is to identify agricultural
production goals based on soil requirements, climate, season, and chemical management. Based on these goals, appropriate species can be selected to serve those purposes. Fall-planted forage radish (Raphanus sativus L. longipinnatus) establishes quickly, suppresses
weeds, and scavenges soil nitrate and other nutrients from deep in the soil profile (Lawley et al., 2012; Weil and Kremen, 2007; Weil et al., 2009).
Use of forage radish as a cover crop has become popular in a wide range of climates, from the Mid-Atlantic to the Midwest. In Massachusetts, vegetable growers have been experimenting with forage radish cover crops as an alternative to high-residue winter rye (Secale cereale L.) or hairy vetch (Vicia villosa L.). These high residue cover crops can create cold, wet soil conditions that delay planting in spring. Rye residue must be managed and terminated within a narrow timeframe, between flowering and
pollination, which can be impossible if soils are highly saturated. Large amounts of decomposing cover crop residue can immobilize nutrients and cause poor
synchronization of N mineralization with succeeding crop’s demand (Dabney et al., 2001). When cash crops rely on N from cover crop residue, N immobilization reduces cash crop yields (Wells et al., 2013).
Radish Cover Crops
The no-till movement has adopted forage radish cover crops because of minimal residue-management requirements, compaction reduction, soil water conservation, weed suppression and nitrogen cycling. The taproot of radish rapidly grows down to 2.4 m depth, removing nitrogen from deep in the soil profile (Dean and Weil, 2009; Kristensen and Thorup-Kristensen, 2004; Thorup-Kristensen, 2000). Forage radish scavenges more residual soil nitrate and phosphorus, and produces more fall biomass (3,500 kg ha-1) compared to commonly used winter rye (2,680 kg ha-1) (Dean and Weil, 2009).
Forage radish plants winter-kill only when temperatures are sub-freezing for several days (Dean and Weil, 2009; Lounsbury and Weil, 2014). The radish biomass
continues to protect the soil from rain and wind over winter, even after freezing
temperature terminates its growth. In spring, forage radish residue, which contains low lignin, decomposes quickly. Where the fleshy roots grew, large ‘pores’ remain that improve water infiltration rates to prevent runoff (Chen and Weil, 2010).
One disadvantage of forage radish is its low carbon to nitrogen ratio (C:N ratio), ranging from 14:1 to 18:1(Schomberg et al., 2006). This results in fast decomposition and release of nutrients in early spring prior to the growth of the succeeding crop (Trinsoutrot et al., 2000). More specifically, if the nitrogen released by decomposition is not
synchronized with the nitrogen demand of the spring planted cash crop, the result
contributes to nutrient pollution and financial loss. Mixing forage radish with grass cover crops, which are rich in carbon, is a sound strategy to adjust the C:N ratio of cover crop residue (Dabney et al., 2001).
Mixtures Versus Monocultures
Multi-species cover crop mixtures have the potential to expand the agroecosystem benefits compared to single species cover crops. Under the right conditions, mixtures can increase SOM, improve C:N ratio of residue, diversify soil biology, and reduce weed density. Complementary root structure (both tap-rooted and branching) and
complementary plant architecture (both broadleaved and grasses) can provide elasticity that enable mixtures to adjust to stressors such as weed pressure or weather conditions (Kunz et al., 2016).
Polyculture cover crop biomass can out-yield monocultures, with a few
exceptions such as winter rye (Finney et al., 2016; Messiga et al., 2016). Grass species in a mixture outperform those in monoculture (Murrell et al., 2017). Legume/grass
bicultures increased dry matter production compared to monocultures, with only slight reductions in N availability compared to legume monocultures (Ranells and Wagger, 1996). In low-residue cover crops, it is hypothesized that a mixture of species with complementary traits, such as growth habit or phenology, can enhance ecosystem services, including aggregate protection, nutrient uptake, and weed suppression (Finney et al., 2016). Creamer et al. (1997) experimented with winter-hardy cover crop mixtures that would improve C:N ratios, and provide erosion control and weed suppression in no-till vegetable production. They found that mixtures including winter rye, hairy vetch, crimson clover and/or barley met those criteria successfully in Ohio.
Cover Crops in No-Till Production
The integration of no-till and cover crops can be essential for yield increases and soil health benefits. No-till systems do not intrinsically sequester C or increase SOM, which are important for long-term soil health and productivity. In order to add carbon and OM, no-till systems need to be integrated with winter cover crops (Blanco-Canqui et al., 2015; Kuo et al., 1997; Sainju et al., 2002; Snapp et al., 2005). In a no-till
corn/soybean system, winter cover crops improved soil physical properties and helped better cycling of N and P (Villamil et al., 2006). Though no-till maintains SOM levels, additional carbon inputs, such as cover crops or manure, are needed to actually increase SOM (Kuo et al., 1997).
There are challenges that come with the transition to no-till. There are two to three years of yield lag following the transition to no-till as soil aggregates and microbial communities adjust (Stubbs et al., 2004). Management of weeds becomes critical in no-till systems because cultivation can no longer be used as a management tool.
Not every crop is suitable for no-till. Corn, soybeans, wheat, and cotton are the major crops that can be successfully grown on a large scale. Some vegetable crops, like squash, cabbage, and tomatoes, have been successfully grown no-till (Hoyt et al., 1994). However, crops that require a fine seedbed (carrots, greens, lettuce) or a furrow for planting (potatoes, sweet potatoes) have not been successfully grown using field-scale no-till techniques.
Sweet corn is a vegetable crop well-adapted to no-till production (Groff, 2006; Mohler, 1991). It is possible that by integrating low-residue forage radish cover crop mixtures with no-till production, farmers could reduce fertilizer and herbicide inputs while maintaining or improving sweet corn yields.
Increasing Sustainability in Sweet Corn
In 2015, sweet corn was planted on 4,730 hectares across New England–about 10% of total vegetable production (USDA-NASS, 2016). In this region sweet corn is commonly grown without supplemental irrigation as long as soil texture is not too sandy (Dicklow and McKeag, 2016). Early sweet corn (Zea mays L. rugosa) in New England garners a price premium and draws customers to roadside stands, but production comes with challenges of weeds, frequent tillage and high rates of fertilizer applications (Galloway and Weston, 1996).
Sweet corn requires is sensitive to nitrogen stress and requires soil temperatures above 16 °C for successful emergence. Due to these characteristics, it has been difficult to use traditional high-residue cover crops, such as winter rye, in sweet corn production systems. After winter-killed forage radish, the soil surface is relatively residue-free, making it optimal for direct seeding in a no-till system. Large radish root channels
provide excellent water infiltration and warmer soil temperature for early planting (Lounsbury and Weil, 2014).
Like field corn, sweet corn is considered a high nitrogen-demanding crop. The New England Vegetable Management Guide recommends applying 112 to 145 kg ha-1 of
nitrogen fertilizer to achieve optimum yields (Dicklow and McKeag, 2016). At planting, 45 kg N ha-1 should be applied in a band (unless soils are very sandy), and the remainder applied at side-dress when corn reaches approximately 25 cm tall.
The seasonal timing of sweet corn fits very well with N recycling from late-summer or fall-planted cover crops. Fall cover crops can capture residual soil N and recycle that to the following crop to potentially reduce the amount of required N fertilizer (Isse et al., 1999). Forage radish cover crops can immobilize 75 to 250 kg N ha-1
(Lounsbury and Weil, 2014), which could potentially meet the nitrogen needs of sweet corn if synchronized with the crop’s demand. The nitrogen dynamics of cover crops are complicated and vary depending on soil type, cover crop, and climate. In a Canadian study, oats (Avena sativa L.), oilseed radish and a mixture of radish and rye increased sweet corn profitability compared with no cover crop (O'Reilly et al., 2012). However, those cover crops did not increase plant available N compared with no cover crop.
Research suggests that cover crops may improve sweet corn yield, not only by reducing weed pressure, but also by increasing competitiveness against growing weeds (Carrera et al., 2004). (Burgos and Talbert, 1996) found that cover crops of hairy vetch, wheat and rye reduced the emergence and yield of no-till sweet corn. However, the use of cover crops allowed the use half rates of atrazine and metolachlor without reducing yields compared to full rate herbicide.
Weed Management in Sweet Corn
Sweet corn is highly sensitive to weed competition due to it’s limited root system (Williams, 2008). Research has shown that cover crops can significantly reduce weed emergence in sweet corn production (Galloway and Weston, 1996; Griffin et al., 2000; Peachey et al., 2004). Of ten cover crop treatments over four years, forage radish was the only one that, compared to a weedy fallow, reduced fall weed biomass by 89-97%
regardless of dominant fall weed species, from grasses (Digitaria spp.) to broadleaf species (Portulaca oleracea L. and Amaranthus retroflexus) (Hodgdon et al., 2016). Kunz et al. (2016) reported that monoculture forage radish, and a mixture including radish, decreased weed biomass by 60 and 66% respectively. The weed suppressive effect is limited to winter and early spring periods and does not carry though the main growing season (Lawley et al., 2011). However, research on weed emergence dynamics following mixtures of winter-killed cover crops is not well documented. If winter-killed multi-species cover crop mixtures produce enduring residue, it may enhance weed suppression.
Rationale
Most of the published research regarding forage radish has been conducted in the mid-Atlantic region, where it does not always winter kill and where spring cash crops are often planted in early March. There is insufficient research documenting the benefits and limitations of forage radish in colder Northeastern climates. Given the short northern growing season, cover crops must be planted earlier to efficiently scavenge nutrients and quickly establish a leaf canopy to suppress weeds. Additionally, spring decomposition of cover crop residues occurs at lower temperatures beginning in April, compared to
February in the mid-Atlantic region. Reports indicate that a mixture of cover crops rather than a single species can provide better services including weed suppression and natural fertility of soils (Bybee-Finley et al., 2016; Finney et al., 2016; Wendling et al., 2016). Research is needed to measure the effects of forage radish-based cover crop mixtures on soil nutrient cycling, weed growth, and yield response in a Northeastern production system. No-till sweet corn production affords complementary timing to integrate these winter-killed cover crop mixtures.
Objectives
The objective of this research is to develop an integrated system for no-till sweet corn production that utilizes the nutrient cycling and weed suppressive benefits of forage radish cover crop mixtures to benefit sweet corn yields and soil health. Cover crop mixtures should improve carbon additions to contribute to long-term SOM stabilization. Low- to medium-residue cover crop mixtures will not present the management challenges in terms of soil temperature reduction or spring residue management. These cover crop mixtures should scavenge more fall N, thereby recycling inorganic N to the sweet corn cash crop the following spring and summer. Ideally, this would result in fertilizer savings to reduce costs for the farmer and reduce the environmental risk of N leaching.
References
Balesdent J., Chenu C., Balabane M. (2000) Relationship of soil organic matter dynamics to physical protection and tillage. Soil & Tillage Research 53:215-230. DOI: 10.1016/s0167-1987(99)00107-5.
Blanco-Canqui H., Shaver T.M., Lindquist J.L., Shapiro C.A., Elmore R.W., Francis C.A., Hergert G.W. (2015) Cover crops and ecosystem services: Insights from studies in temperate soils. Agronomy Journal 107:2449-2474. DOI:
Brock C., Fliessbach A., Oberholzer H.R., Schulz F., Wiesinger K., Reinicke F., Koch W., Pallutt B., Dittman B., Zimmer J., Hulsbergen K.J., Leithold G. (2011) Relation between soil organic matter and yield levels of nonlegume crops in organic and conventional farming systems. Journal of Plant Nutrition and Soil Science 174:568-575. DOI: 10.1002/jpln.201000272.
Burgos N.R., Talbert R.E. (1996) Weed control and sweet corn (zea mays var rugosa) response in a no-till system with cover crops. Weed Science 44:355-361. Bybee-Finley K.A., Mirsky S.B., Ryan M.R. (2016) Functional diversity in summer
annual grass and legume intercrops in the northeastern united states. Crop Science 56:2775-2790. DOI: 10.2135/cropsci2016.01.0046.
Carrera L.M., Abdul-Baki A.A., Teasdale J.R. (2004) Cover crop management and weed suppression in no-tillage sweet corn production. HortScience 39:1262-1266. Chen G., Weil R.R. (2010) Penetration of cover crop roots through compacted soils. Plant
and Soil 331:31-34. DOI: 10.1007/s11104-009-0223-7.
Cooper R.J., Hama-Aziz Z., Hiscock K.M., Lovett A.A., Dugdale S.J., Sunnenberg G., Noble L., Beamish J., Hovesen P. (2017) Assessing the farm-scale impacts of cover crops and non-inversion tillage regimes on nutrient losses from an arable catchment. Agriculture Ecosystems & Environment 237:181-193. DOI:
10.1016/j.agee.2016.12.034.
Creamer N.G., Bennett M.A., Stinner B.R. (1997) Evaluation of cover crop mixtures for use in vegetable production systems. HortScience 32:866-870.
Dabney S.M., Delgado J.A., Reeves D.W. (2001) Using winter cover crops to improve soil and water quality. Communications in Soil Science and Plant Analysis 32:1221-1250. DOI: 10.1081/css-100104110.
Dean J.E., Weil R.R. (2009) Brassica cover crops for nitrogen retention in the mid-atlantic coastal plain. J Environ Qual 38:520-8. DOI: 10.2134/jeq2008.0066. Dicklow M.B., McKeag L. (Eds.). (2016) New england vegetable management guide,
UMass Extension, Amherst, MA.
Fageria N.K. (2012) Role of soil organic matter in maintaining sustainability of cropping systems. Communications in Soil Science and Plant Analysis 43:2063-2113. DOI: 10.1080/00103624.2012.697234.
Finney D.M., White C.M., Kaye J.P. (2016) Biomass production and carbon/nitrogen ratio influence ecosystem services from cover crop mixtures. Agronomy Journal 108:39-52. DOI: 10.2134/agronj15.0182.
Galloway B.A., Weston L.A. (1996) Influence of cover crop and herbicide treatment on weed control and yield in no-till sweet corn (zea mays l) and pumpkin (cucurbita maxima duch). Weed Technology 10:341-346.
Griffin T., Liebman M., Jemison J. (2000) Cover crops for sweet corn production in a short-season environment. Agronomy Journal 92:144-151.
Groff S. (2006) A no-till success story. American Vegetable Grower 54:24.
Hobbs P.R. (2007) Conservation agriculture: What is it and why is it important for future sustainable food production? Journal of Agricultural Science 145:127-137. DOI: 10.1017/s0021859607006892.
Hodgdon E.A., Warren N.D., Smith R.G., Sideman R.G. (2016) In-season and carry-over effects of cover crops on productivity and weed suppression. Agronomy Journal 108:1624-1635. DOI: 10.2134/agronj2015.0419.
Hoyt G., Monks D., Monaco T. (1994) Conservation tillage for vegetable production. Horttechnology 4:129-135.
Hoyt G.D. (1986) Conservation tillage for vegetable and tobacco production. Soil & Tillage Research 8:341-341. DOI: 10.1016/0167-1987(86)90381-8.
Isse A., MacKenzie A.F., Stewart K., Cloutier D.C., Smith D.L. (1999) Cover crops and nutrient retention for subsequent sweet corn production. Agronomy Journal 91:934-939.
Kristensen H.L., Thorup-Kristensen K. (2004) Root growth and nitrate uptake of three different catch crops in deep soil layers. Soil Science Society of America Journal 68:529-537.
Kunz C., Sturm D.J., Varnholt D., Walker F., Gerhards R. (2016) Allelopathic effects and weed suppressive ability of cover crops. Plant Soil and Environment 62:60-66. Kuo S., Sainju U.M., Jellum E.J. (1997) Winter cover crop effects on soil organic carbon
and carbohydrate in soil. Soil Science Society of America Journal 61:145-152. Lal R. (2004) Soil carbon sequestration impacts on global climate change and food
security. Science 304:1623-1627. DOI: 10.1126/science.1097396.
Lawley Y.E., Teasdale J.R., Weil R.R. (2012) The mechanism for weed suppression by a forage radish cover crop. Agronomy Journal 104:205-214. DOI:
10.2134/agronj2011.0128.
Lawley Y.E., Weil R.R., Teasdale J.R. (2011) Forage radish cover crop suppresses winter annual weeds in fall and before corn planting. Agronomy Journal 103:137-144. DOI: 10.2134/agronj2010.0187.
Lounsbury N.P., Weil R.R. (2014) No-till seeded spinach after winterkilled cover crops in an organic production system. Renewable Agriculture and Food Systems 30:473-485.
Magdoff F., Weil R.R. (Eds.). (2004) Soil organic matter in sustainable agriculture, CRC Press, Boca Raton, FL.
Meisinger J.J., Delgado J.A. (2002) Principles for managing nitrogen leaching. Journal of Soil Water Conservation 57:485-498.
Messiga A.J., Sharifi M., Munroe S. (2016) Combinations of cover crop mixtures and bio-waste composts enhance biomass production and nutrients accumulation: A greenhouse study. Renewable Agriculture and Food Systems 31:507-515. DOI: 10.1017/s1742170515000423.
Mohler C.L. (1991) Effects of tillage and mulch on weed biomass and sweet corn yield. Weed Technology 5:545-552.
Möller K., Reents H.-J. (2009) Effects of various cover crops after peas on nitrate leaching and nitrogen supply to succeeding winter wheat or potato crops. Journal of Plant Nutrition and Soil Science 172:277-287. DOI: 10.1002/jpln.200700336. Murrell E.G., Schipanski M.E., Finney D.M., Hunter M.C., Burgess M., LaChance J.C., Baraibar B., White C.M., Mortensen D.A., Kaye J.P. (2017) Achieving diverse cover crop mixtures: Effects of planting date and seeding rate. Agronomy Journal 109:259-271. DOI: 10.2134/agronj2016.03.0174.
O'Reilly K.A., Lauzon J.D., Vyn R.J., Van Eerd L.L. (2012) Nitrogen cycling, profit margins and sweet corn yield under fall cover crop systems. Canadian Journal of Soil Science 92:353-365. DOI: 10.4141/cjss2011-065.
Peachey R.E., William R.D., Mallory-Smith C. (2004) Effect of no-till or conventional planting and cover crops residues on weed emergence in vegetable row crop. Weed Technology 18:1023-1030. DOI: 10.1614/wt-03-205r.
Ranells N.N., Wagger M.G. (1996) Nitrogen release from grass and legume cover crop monocultures and bicultures. Agronomy Journal 88:777-882. DOI:
10.2134/agronj1996.00021962008800050015x.
Sainju U.M., Singh B.P., Whitehead W.F. (2002) Long-term effects of tillage, cover crops, and nitrogen fertilization on organic carbon and nitrogen concentrations in sandy loam soils in georgia, USA. Soil and Tillage Research 63:167-179.
Sainju U.M., Whitehead W.F., Singh B.P. (2005) Biculture legume-cereal cover crops for enhanced biomass yield and carbon and nitrogen. Agronomy Journal 97:1403-1412. DOI: 10.2134/agronj2004.0274.
Schomberg H.H., Endale D.M., Calegari A., Peixoto R., Miyazawa M., Cabrera M.L. (2006) Influence of cover crops on potential nitrogen availability to succeeding crops in a southern piedmont soil. Biology and Fertility of Soils 42:299-307. DOI: 10.1007/s00374-005-0027-8.
Six J., Elliott E.T., Paustian K. (1999) Aggregate and soil organic matter dynamics under conventional and no-tillage systems. Soil Science Society of America Journal 63:1350-1358.
Snapp S.S., Swinton S.M., Labarta R., Mutch D., Black J.R., Leep R., Nyiraneza J., O'Neil K. (2005) Evaluating cover crops for benefits, costs and performance within cropping system niches. Agronomy Journal 97:322-332.
Stubbs T.L., Kennedy A.C., Schillinger W.F. (2004) Soil ecosystem changes during the transition to no-till cropping. Journal of Crop Improvement 11:105-135. DOI: 10.1300/J411v11n01_06.
Thorup-Kristensen K. (2000) Are differences in root growth of nitrogen catch crops important for their ability to reduce soil nitrate-n content, and how can this be measured? Plant and Soil 230:185-195.
Trinsoutrot I., Recous S., Bentz B., Line`res M., Che`neby D., Nicolardot B. (2000) Biochemical quality of crop residues and carbon and nitrogen mineralization kinetics under nonlimiting nitrogen conditions. Soil Sci. Soc. Am. J. 64:918-926. . DOI: doi:10.2136/sssaj2000.643918x.
USDA-NASS. (2016) New england fruits and vegetables, in: G. R. Keough (Ed.), New England Agricultural Statistics 2015, USDA National Agricultural Statistics Service, Concord, NH.
United States Department of Agriculture, Natural Resource Conservation Service. Soil health. October 26, 2017.
https://www.nrcs.usda.gov/wps/portal/nrcs/main/soils/health/.
Villamil M.B., Bollero G.A., Darmody R.G., Simmons F.W., Bullock D.G. (2006) No-till corn/soybean systems including winter cover crops: Effects on soil properties. Soil Science Society of America Journal 70:1936-1944. DOI:
10.2136/sssaj2005.0350.
Weil R., Kremen A. (2007) Thinking across and beyond disciplines to make cover crops pay. Journal of the Science of Food and Agriculture 87:551-557. DOI:
10.1002/jsfa.2742.
Maryland Cooperative Extension. Forage radish: New multi-purpose cover crop for the mid-atlantic. Fact sheet 824. March 13.
https://enst.umd.edu/sites/enst.umd.edu/files/_docs/FactSheet824 Weil et al
Wells M.S., Reberg-Horton S.C., Smith A.N., Grossman J.M. (2013) The reduction of plant-available nitrogen by cover crop mulches and subsequent effects on soybean performance and weed interference. Agronomy Journal 105:539-545. DOI:
10.2134/agronj2012.0396.
Wendling M., Buchi L., Amosse C., Sinaj S., Walter A., Charles R. (2016) Influence of root and leaf traits on the uptake of nutrients in cover crops. Plant and Soil 409:419-434. DOI: 10.1007/s11104-016-2974-2.
Williams M.M. (2008) Sweet corn growth and yield response to planting dates of the north central united states. HortScience 43.
CHAPTER 2
CREDITING COVER CROP MIXTURES FOR NO-TILL SWEET CORN YIELD AND QUALITY
Nitrogen (N) is usually a critically limiting nutrient in crop production and can be difficult to efficiently manage in soil. Applied N fertilizer is prone to leaching, which contributes of environmental pollution and economic loss (Meisinger and Delgado, 2002; Weinert et al., 2002). Improved management practices focusing on enhancement of soil biological activity result in natural soil fertility, reduced N fertilizer loss, and thus increase N use efficiency. Integrating cover crops into a system along with reduced tillage and improved synchronization of N inputs with crops’ demands are among
effective methods to improve N management (Blanco-Canqui et al., 2015; Meisinger and Delgado, 2002; Snapp et al., 2005).
Farmers increasingly transition to no-till production as an effective way to reduce soil erosion, increase water infiltration, improve nutrient management, decrease tractor labor, and boost soil health (Drinkwater et al., 2000; Six et al., 1999; Triplett and Dick, 2008). Tillage can harm some of the most important soil functions, in particular soil aggregates and soil organic matter (SOM) (Reeves, 1997). Research indicates that no-till practices decrease soil erosion, increase water infiltration, improve soil structure and function, and stabilize soil aggregates (Hobbs, 2007; Hoyt, 1986; Lal, 2004; Six et al., 1999). In addition, major changes occur in soil ecosystems with the elimination of tillage. The soil food web shifts toward fungal dominance (Stubbs et al., 2004) and SOM builds slowly over time as a result of increased microbial biomass and reduced OM oxidation (Kallenbach et al., 2016; Six et al., 2004). A major limitation of no-till systems
is that they do not inherently sequester C or increase SOM, which are important for long-term soil health and productivity. In order to add carbon and OM, no-till systems need to be integrated with winter cover crops (Blanco-Canqui et al., 2015; Kuo et al., 1997a; Sainju et al., 2002; Sainju et al., 2005).
Winter cover crops are planted in early fall and are either winter-killed by cold temperatures or are winter hardy, resuming growth in spring. These cover crops can effectively serve multiple functions to improve N cycling while protecting soil from erosion, reducing compaction, supporting soil biological activity, and suppressing weeds (Blanco-Canqui et al., 2015; Gabriel et al., 2016; Kuo et al., 1997b). Cool season cover crops are crucial in regions with short growing seasons, such as the Northeast, to protect soil health and sustainability.
In soils with high concentrations of N, non-legume cover crops can provide effective nitrate scavenging following a cash crop (Dabney et al., 2001; Hashemi et al., 2013; Kristensen and Thorup-Kristensen, 2004a; O'Reilly et al., 2012). If soil is low in residual N, legume cover crops can actively fix atmospheric N and immobilize it in the plant tissue (Drinkwater et al., 1998; Gabriel et al., 2016; Sainju et al., 2005).
In vegetable production systems, fall-planted cover crops can scavenge on average 40 to 200 Kg N ha-1 with the higher range following high residual N crops, such as potatoes (Dabney et al., 2001; Dabney, 2010; Hashemi et al., 2013; Jahanzad et al., 2017; Wendling et al., 2016). Cover crop capacity for nitrate scavenging is related to root depth but not density (Kristensen and Thorup-Kristensen, 2004a; Thorup-Kristensen, 2000; Thorup-Kristensen, 2001) as well as the initial N status of the soil and the date of planting. In short-season regions like the Northeast, it can be challenging to get winter
cover crops planted in time for sufficient growth. If planted in late August through September, cover crops are likely to take up 17 to 78 kg N ha-1 (Dabney et al., 2001; Hashemi et al., 2013; Murrell et al., 2017). When the cover crop is winter-killed or otherwise terminated, plant biomass decomposes and organic N is recycled to the subsequent crop through mineralization (Cabrera et al., 2005; Jahanzad et al., 2016).
Winter rye (Secale cereal L.) is the most common cover crop in the Northeast used for fall nitrate scavenging and soil protection. It establishes well even quite late in the fall, is winter-hardy, and resumes growth in spring to produce high rates of biomass. However, large amounts of cover crop residue on the soil surface in spring can cause adverse cropping conditions by insulating the soil surface, trapping soil moisture, and interfering with seed placement(Teasdale et al., 2008). Especially in areas with a short growing season excess soil moisture and cool soil temperatures delay planting (Teasdale and Mohler, 1993; Wells et al., 2013), which may compromise crop yield and reduce revenue.
In several studies, forage radish (FR) (Raphanus sativus L. longipinnatus) showed greater capacity for N uptake and immobilization compared with commonly used cover crop species (Hodgdon et al., 2016; Kristensen and Thorup-Kristensen, 2004a). The no-till movement has adopted forage radish cover crops because of minimal
residue-management requirements, effective compaction reduction, soil water conservation, weed suppression and nitrogen cycling (Lawley et al., 2011). The fleshy root and penetrating taproot of radish grows to 2.4 m deep and removes nitrogen and other nutrients from deep in the soil profile (Dean and Weil, 2009; Kristensen, 2004; Thorup-Kristensen, 2000). Forage radish scavenges more residual soil nitrate and phosphorus, and produces more
fall biomass than commonly used winter rye (Chen and Weil, 2010; Chen and Weil, 2011; Dean and Weil, 2009). It winter-kills at temperatures just below freezing and a light residue remains on the soil surface in spring, resulting in no need for spring residue management (Lounsbury and Weil, 2014).
Vegetable growers often select winter-killed species, such as oats or peas, to avoid potential issues with delayed planting and massive spring residue management. Low-residue cover crop mixtures, including forage radish, may avoid creating such adverse conditions (Lawley et al., 2011; Lounsbury and Weil, 2014; Teasdale and Mohler, 1993).
Multi-species cover crop mixtures have the potential to expand the agroecosystem benefits of cover crops. Mixtures can, under the right conditions, increase SOM, improve C:N ratio of residue, diversify soil biology, improve weed suppression. Polyculture cover crop biomass can out-yield monocultures, with a few exceptions like winter rye (Finney et al., 2016; Messiga et al., 2016). In terms of biomass production, grass species in a mixture outperform those in monoculture (Murrell et al., 2017). The combination of legume and non-legume cover crop species may reduce potential N leaching and adjust the timing of N-mineralization relative to crop uptake (Tonitto et al., 2006).
Complementary root structure and plant architecture can help mixtures adjust to weather conditions and nutrient availability (Berendsen et al., 2012; Finney et al., 2016; Gardner and Sarrantonio, 2012).
In low-residue cover crops it is hypothesized that a mixture of species with complementary traits (eg. growth habit or phenology) can enhance ecosystem services, such as aggregate protection, nutrient uptake, and weed suppression (Finney et al., 2016).
Creamer et al. (1997) experimented with numerous species for cover crop mixtures in order to improve C:N ratios and weed suppression in no-till vegetable production.
Sweet corn is well-suited to no-till production (Galloway and Weston, 1996). The seasonal timing of sweet corn growth and development fits well with N recycling from winter-killed low residue cover crops (Isse et al., 1999). It has been documented that cover crops can improve sweet corn growth, not only by reducing weed pressure, but also through improving soil function and nutrient cycling (Burgos and Talbert, 1996; Carrera et al., 2004; Cline and Silvernail, 2002; Griffin et al., 2000; Lawson et al., 2012; O'Reilly et al., 2011). However, the effect of cover crops on sweet corn yield has been
inconsistent in the literature (Carrera et al., 2004; Isse et al., 1999). In part this is due to the variations in cover crop type, planting date, and the soil history at the experimental site.
Both the amount of N and the timing of availability are important for successful sustainable corn production. The New England Vegetable Management Guide
recommends an application of 45 kg N ha-1 (40 lbs N ac-1) at planting, plus 67 to 100 kg N ha-1 (60 to 90 lbs N ac-1) as sidedress, for sweet corn depending on results of a pre-sidedress nitrate test (PSNT) (Dicklow and McKeag, 2016). When cover crop
mineralization is a significant N source, it’s difficult to quantify how much and when the cover crop N is available to the succeeding cash crop because it is influenced by
temperature, moisture, soil contact, and carbon-to-nitrogen ratio (C:N) of the crop residue.
Hypotheses We hypothesized that:
1) Cover crop mixtures will produce more biomass dry matter than FR monoculture or weedy control;
2) Winter-killed cover crop mixtures will not reduce spring soil temperature and thereby will not prevent timely spring planting;
3) Cover crop mixtures will improve synchrony between N release and corn uptake; 4) Sweet corn yield will be will be higher following cover crop mixtures.
Objectives
The objective of this research was to develop an integrated system for no-till sweet corn production that can efficiently utilize the nutrient cycling and weed
suppressive benefits of forage radish cover crop mixtures. CC mixtures should improve carbon additions to contribute to long-term SOM stabilization. Low- to medium-residue CC mixtures will not present the management challenges in terms of soil temperature reduction or spring residue management. These CC mixtures should scavenge more fall N, thereby recycling inorganic N to the sweet corn cash crop the following spring and summer. Ideally, this would result in increased yields, fertilizer savings, and reduced production costs for the farmer, in addition to the reduced risk from nitrate leaching to the environment.
Materials & Methods Experimental Site
Two field experiments were conducted at the University of Massachusetts Amherst Crop, Animal, Research and Education Farm in South Deerfield, MA (lat. 42°47’N, long. 72°58’W). Soils at the research farm are characterized as coarse-silty, mixed, superactive, nonacid, mesic Typic Udifluvents (Hadley series). Mean annual precipitation at this site ranges from 940-1300mm (37-51 inches). The mean annual temperature is 3-10.5 ˚C (37-51˚ F). The selected research site had previously been un-tilled for 3 years and planted with buckwheat the summer prior.
Table 1: Precipitation and Growing Degree Days (GDD) for experimental sites. GDD=Σ (Tmax-Tmin)-Tb where Tmax and Tmin are daily maximum and
minimum temperatures, respectively, and Tb is base temperature. For cover
crop mixtures Tb was set as 4°C and for sweet corn Tb was 10°C.
Precipitation (mm) Growing Degree
Days Cover Crops 2014 2015 20 yr avg 2014 (GDD2015 40) Aug 103 95 90 875 975 Sep 29 167 106 682 805 Oct 126 58 107 416 310 Nov 77 47 77 71 183 Dec 96 104 84 11 76 Total 431 470 464 2055 2348 No Crop/ Winter 2015 2016 20 yr avg 2015 2016 Jan 80 42 67 0 3 Feb 24 106 67 0 30 Mar 40 68 89 3 130 Apr 50 40 77 186 215 Total 194 256 300 189 378 Sweet Corn 2015 2016 20 yr avg 2015 (GDD50) 2016 May 35 57 84 418 270 Jun 189 27 112 451 499 Jul 121 43 90 659 706 Total 345 127 286 1527 1475
Treatments
Treatments consisted of three cover crops including forage radish (FR) (Raphanus sativus L. longipinnatus), a mixture of oats (Avena sativa L.) and forage radish (OFR), a mixture of peas (Pisum sativum subsp arvense L.), oats, and forage radish (POFR), and a control treatment of local weeds (NCC) (Table 2).
Table 2: Cover crop seeding rates for 2014 and 2015. Cover crop treatment Seeding rate (kg ha-1)
Forage radish (FR) 7.8 kg ha-1
Oats & forage radish (OFR) 56.0 kg ha-1 & 3.4 kg ha-1,
respectively Peas, oats, and forage radish
(POFR)
50.4 kg ha-1, 33.6 kg ha-1, & 2.2 kg ha-1, respectively Selection of cover crops was based on following justifications:
1- Forage radish has become popular in recent years, planted either as monoculture or mixture, for nitrate scavenging and weed suppression.
2- Oats are the most common grass cover crop used by vegetable growers in New England. Oats produce high biomass, are winter killed, and can adjust the C:N ratio in a mixed cover crop.
3- Peas were included for the ecological benefits of legumes, including increasing soil microbial population thus increased soil organic matter, fixation of
atmospheric N, and low soil C:N ratio.
4- All species in these cover crop mixes are winter-killed in New England’s weather condition, therefore simplifies spring residue management.
The experimental design was a randomized complete block, with split-plots, replicated four times. Main plots consisted of four cover crop treatments described above. Sub-plots were assigned to in-season N fertilizer application rates to sweet corn.
Cover crops were planted August 23, 2014 and August 24, 2015 (Table 3) using a plot cone seeder (Vogel, 1978). Seeding rates are indicated in Table 2. Plots were 8.5 m by 9 m in order to accommodate 9 rows of sweet corn with sufficient buffer area. Control plots (NCC), were not seeded and existing natural weed population was allowed to establish and grow until they winter-killed.
Cover crop biomass was measured just prior to winter-kill, approximately late November (Table 3). Plants were cut at the soil line and then separated by cover crop species or weeds. The fleshy tuber of forage radish was also sampled as it contributes significantly to total biomass and is dissimilar to root biomass of peas and oats. Harvested cover crops were dried separately at 40°C in a forced-air oven until they reached a constant mass. Control plots were also sampled for weed biomass. Cover crop
Cover crop treatments in October 2016. From left to right: FR (forage radish); OFR (oats and forage radish); POFR (peas, oats and forage radish); and NCC (no cover crop) control.
residues were analyzed at the UMass Soil and Plant Nutrient Testing Laboratory for measurement of carbon (C) and nitrogen (N) content.
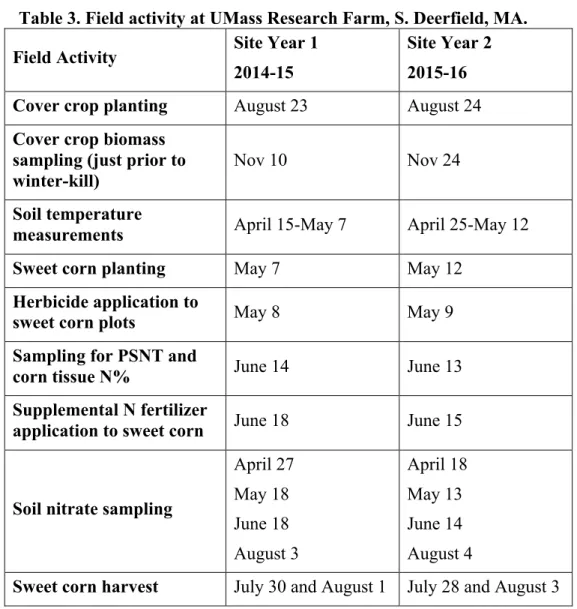
Table 3. Field activity at UMass Research Farm, S. Deerfield, MA.
Field Activity Site Year 1
2014-15
Site Year 2 2015-16
Cover crop planting August 23 August 24
Cover crop biomass sampling (just prior to winter-kill)
Nov 10 Nov 24
Soil temperature
measurements April 15-May 7 April 25-May 12
Sweet corn planting May 7 May 12
Herbicide application to
sweet corn plots May 8 May 9
Sampling for PSNT and
corn tissue N% June 14 June 13
Supplemental N fertilizer
application to sweet corn June 18 June 15
Soil nitrate sampling
April 27 May 18 June 18 August 3 April 18 May 13 June 14 August 4
Sweet corn harvest July 30 and August 1 July 28 and August 3
In April, as soils began to warm, soil temperature was monitored using Fisher Scientific Traceable Hi-Accuracy Digital thermometer at the same time each day for several weeks until the average soil temperature approached 16 °C. Prior to corn
ha-1 and Lumax (S-metolachlor, 321 g a.i. L-1; Atrazine 32 g a.i. L-1; and Mesotrione g a.i. L-1) at 5.8 L ha-1. At soil temperature of 16 °C, sweet corn (Zea mays L. rugosa var. ‘Trinity’) was no-till planted at an estimated population of 64,000 seeds per hectare.
Three nitrogen fertility treatments were used to examine the synchrony between nutrient release from decomposing cover crop and the uptake by sweet corn. Nitrogen treatments consisted of application of 0 kg N ha-1 as the control, 28 kg N ha-1 at sidedress, and 56 kg N ha-1 split equally between planting and sidedress (approximately 25 cm tall). Urea fertilizer (46% N) was hand applied. We selected lower rates of fertilizer
application than recommended for sweet corn (an average of 130 kg N ha-1) in order to
assess the N contribution of cover crop residue to sweet corn.
Soil samples were taken at 3 depths (0-20 cm, 20-40 cm, and 40-60 cm) every four weeks from April through August. Three soil cores were taken at each depth from each plot, and then bulked. Samples were air-dried for 2 to 3 days. Nitrate and
phosphorus were extracted using Modified Morgan solution and analyzed by colorimetric determination using flow injection analysis (QuickChem 8000, Lachat Instruments).
When corn plants were approximately 30 cm tall, two different soil samples were taken for measuring Pre-Sidedress Nitrate Test (PSNT) and soil respiration. For PSNT measurement, three soil cores per plot were taken at 0-30 cm depth and air dried before extraction with calcium chloride solution for colorimetric determination of nitrate (Heckman et al., 1995). Soil respiration, as an indicator of microbial activity, was measured following the Solvita testing protocol: basal respiration and CO2 burst (Woods
When sweet corn plants reached V5 stage, tissue was sampled to determine N concentration. Eight sweet corn plants were cut at the base and dried in a forced-air oven at 40 °C until a constant weight was reached. Tissue was ground and analyzed for C and N at the UMass Soil and Plant Nutrient Testing Laboratory.
At maturity, sweet corn was hand harvested. Sweet corn yield, number of
marketable ears and ear fresh weight, were assessed in samples harvested from six linear meters (4.5 m2) per subplot. Three ears were randomly selected to measure ear length and percent tip-fill as criteria for sweet corn quality.
At harvest, the corn stalk nitrate test (CSNT) was performed to evaluate end of season nitrogen sufficiency test. Three stalks from harvested plants in each subplot were randomly chosen. A 20 cm segment of stalk was cut starting 15 cm above ground level. Stalks were dried in a forced-air oven at 40 °C for a week. Corn stalks were ground and extracted with 2% acetic acid solution for colorimetric determination of nitrate (Fox et al., 1989).
Statistical Analysis
Data were analyzed using the general linear model (GLM) procedure of SAS 9.4 (SAS Institute, Cary, NC) with cover crop and N fertilizer as fixed effects and replicate as random effect. Tukey’s HSD was used for means comparisons of cover crop effects. Linear regression analysis was used for yield data means comparisons of N fertilizer.
Results and Discussion Aboveground Cover Crop Biomass
Cover crops were established successfully both years. However, dry matter produced in the two years of study was statistically different. Analysis of aboveground cover crop biomass indicated a significant difference in treatment by year interaction; therefore, data from each year was analyzed and presented separately.
In 2014, aboveground biomass was 11% greater than in 2015, averaged over all cover crop treatments. Weather conditions in both years may have significantly affected biomass production. In September and October 2014, precipitation and rainfall were ideal for plant growth, with sufficient rain and moderate GDD (Table 1). In September 2015, greater than average rainfall may have had a negative impact on biomass
production. During this time cover crops were establishing and saturated soil conditions can inhibit root growth. While seasonal GDD in the fall of 2014 was similar to the norm for the location, calculated GDD for 2015 was approximately 20% higher than the norm for the experimental site.
At winter-kill in 2014, OFR out-yielded FR monoculture by roughly 2.5 Mg ha-1 (Figure 1). Although biomass produced by POFR and OFR were not statistically
different, OFR produced 23% more dry matter than POFR. When grown as monoculture, FR produced a moderate amount of aboveground dry matter which was 47% lower than OFR but still produced 67% more than NCC. However, in 2015 there were no significant differences between POFR, OFR and FR dry matter production, which ranged from 3.3 Mg ha-1 (FR) to 4.0 Mg ha-1 (POFR).
Figure 1. Aboveground cover crop biomass measured in November prior to winter-kill.
POFR=pea, oat and forage radish, OFR=oat and forage radish, FR=forage radish, NCC=no cover crop control
Aboveground dry matter produced by FR in current study is on the lower end of the published range, partly because of fewer accumulated GDD prior to winter-kill and partly due to low starting residual soil N. Lounsbury and Weil (2014) reported a range of 3.2 to 5.5 Mg ha-1 over 4 site years, while Wendling et al. (2016) reported an average of 6.3 Mg ha-1. The experimental site in current study had been left fallow prior to planting with low soil N and received a minimal application of 28 kg N ha-1 at the planting time. Under more similar low residual N conditions to this experiment, Murrell et al. (2017) reported 2 Mg ha-1 aboveground FR dry matter averaged over three years.
In regard to OFR, Lounsbury and Weil (2014) reported a range from 4.6 to 6.0 Mg ha-1 dry matter, which is comparable to the results obtained in this experiment. However, information about aboveground biomass of a pea, oat, and radish mixture (POFR) is limited. In general legumes are less productive compared with non-legumes,
ab# a# b# c# A# A# AB# B# 0# 1# 2# 3# 4# 5# 6# POFR# OFR# FR# NCC# D ry $m a' er $(Mg $h a -1)$ Cover$Crop$Treatment$ Aboveground$Cover$Crop$Biomass$ 2014415# 2015416#
However, beyond productive biomass, mixed legume-grass cover crops are known for improvement of soil carbon deposition and soil biology, which improves crop yield. Therefore the ecological benefits of cover crops may not necessarily derive from higher biomass production.
As expected, NCC accumulated lower biomass than actual cover crop treatments, despite that those are characterized as “low residue” cover crops. Overall, weed biomass in this study ranged from 1.0 to 2.5 Mg ha-1, which was average to slightly lower than weedy control plots in other published reports. For example, Lounsbury and Weil (2014) reported 1.7 to 3.7 Mg ha-1 weed dry matter. Similarly, Grimmer and Masiunas (2004)
reported 1.7 Mg ha-1 weed dry matter.
Cover crop mixtures did not yield more aboveground dry matter than sole FR, which is in agreement with (Finney et al., 2016), Murrell et al. (2017), and Wortman et al. (2012). These experiments each concluded that selected mixtures did not yield more biomass than high-yielding monocultures of the same cover crops. This research indicates that cover crop mixture likely do not consistently produce more biomass than monocultures. However, the advantage of mixed cover crops may relate to other
ecosystem services, such as improved soil biological activity and/or synchronous nutrient availability to the subsequent crop (Finney et al., 2017a; Finney et al., 2017b; White et al., 2017).
Moreover, comparison between mixed versus monoculture cover crop biomass must take into account the phenology of the cover crop. For example, winter rye biomass, which has been allowed to grow to maturity from September through June, should not be compared with a cover crop that grew for only 90 days before winter-kill.
Many published results about cover crop mixtures include cereal rye, which is winter-hardy and highly competitive with other cover crop species. Cereal rye dominance has been observed by Murrell et al. (2017) and Poffenbarger et al. (2015), such that cereal rye constitutes a disproportionate percentage of biomass in spring compared with original fall establishment.
We could not find a documented report that compares the biomass of winter-killed cover crops in mixtures versus monocultures. An earlier experiment at the same research site reported field pea cover crop produced 3.1 Mg ha-1 dry matter (Jahanzad et al., 2017). Stivers-Young (1998) reported that monocultures of oats and oilseed radish (same genus and species as FR) each produced 3.9 Mg ha-1 dry matter in the short Northeast fall cover crop season.
Certain ecosystem services from cover crops specifically N immobilization and weed suppression are positively correlated with total biomass production. However, most reports have focused on the aboveground cover crop biomass. Exclusive
consideration of aboveground biomass neglects to reflect the influence of the cover crop roots on soil biology and nutrients recycling in the soil. Some ecological services may not be solely derived from aboveground residue but from total biomass, including root biomass. This is particularly important in the case of forage radish, which often produces a fleshy tuber that stores water and nutrients and creates soil pores.
Total Cover Crop Biomass
Root biomass provides considerable ecological benefits, particularly in a no-till system, in terms of providing substrate for microbial decomposition and earthworm consumption, which contribute substantially to natural soil fertility and nutrient cycling
(Austin et al., 2017; Malpassi et al., 2000). Puget and Drinkwater (2001) found that nearly half of root-derived cover crop C remained in soils after one growing season, as opposed to only 13% of shoot-derived C.
In the current study, total cover crop biomass consisted of aboveground biomass plus the fleshy forage radish roots. Taproots and lateral roots were not harvested and are not included in calculation of total cover crop biomass. When total cover crop biomass was considered, differences amongst cover crop treatments were minimized and not statistically significant. All cover crops produced significantly more biomass than NCC, the weedy control (Table 4).
Table 4. Cover crop biomass characteristics at experimental site in both years. Years analyzed separately. Treatments with different letters indicate significant differences (Tukey’s HSD p<0.05). No letter indicates no
significant differences. Total dry matter (Mg ha-1) N (g kg-1) N in total dry matter (kg ha-1) C:N ratio 2014-15 POFR 5.39 a 23 106 a 18:1 OFR 6.45 a 20 113 a 21:1 FR 5.33 a 20 90 ab 21:1 NCC 0.98 b 23 23 b 18:1 2015-16 POFR 4.81 A 19 B 90 AB 22:1 AB OFR 4.81 A 16 B 79 AB 25:1 A FR 5.14 A 20 AB 104 A 20:1 BC NCC 2.46 B 24 A 57 B 17:1 C
POFR=pea, oat and forage radish, OFR=oat and forage radish, FR=forage radish, NCC=no cover crop control
In 2014 OFR produced the highest total dry matter (6.45 Mg ha-1), which was 16% and 17% more than POFR and FR, respectively. However, in 2015, FR out-yielded POFR and OFR by approximately 6%. FR yield in the current study was in agreement
with earlier published research (5.7 Mg ha-1) at the same experimental site (Jahanzad et al., 2017). Published ranges for FR total dry matter are 2.4 to 9.4 Mg ha-1 (Lawley et al., 2012; Lawley et al., 2011; Lounsbury and Weil, 2014). This wide range is likely due to differences in planting date, GDD before winter-kill, and initial soil nutrient status.
A two-year study in Vermont on cover crop mixtures for short-season growth revealed that a POFR mixture planted September 15 yielded 1.0 Mg ha-1 dry matter on unfertilized plots and 1.4 Mg ha-1 on plots which had received manure in fall (Carter et al., 2015). This low dry matter yield could be partly due to 35 days less growth
compared to our study. In contrast, an OFR mixture in Maryland produced 7.2 Mg ha-1
dry matter (averaged over four site years) under high soil fertility conditions (Lounsbury, 2013). Low soil residual N will limit biomass production and consequently potential cover crop nitrate scavenging.
In the current study, limited N availability in the soil during cover crop growing period may have reduced dry matter production both years, especially in 2015 when higher precipitation during cover crops establishment may have leached soil N (Table 1). As a result, total FR biomass was in mid-range and was more similar to a no-till study conducted on a sandy soil in Maryland, where FR cover crop produced 2.4 to 5.1 Mg ha-1 dry matter (White and Weil, 2011).