DOI 10.1007/s10797-010-9138-8
An applied analysis of ACE and CBIT reforms
in the EU
Ruud A. de Mooij·Michael P. Devereux
Published online: 3 June 2010
© The Author(s) 2010. This article is published with open access at Springerlink.com
Abstract We assess the quantitative impact of two reforms to corporation tax, which would eliminate the differential treatment of debt and equity: the allowance for cor-porate equity (ACE) and the comprehensive business income tax (CBIT). We explore the impact of these reforms on various decision margins, using an applied general equilibrium model for the EU calibrated with recent empirical estimates of elastic-ities. The results suggest that, if governments adjust statutory corporate tax rates to balance their budget, profit shifting and discrete location render CBIT more attractive for most individual European countries. European coordination makes a joint ACE more, and a joint CBIT less efficient. A combination of ACE and CBIT is always welfare improving.
Keywords Corporate tax reform·European Union·Tax coordination·CGE
model·ACE·CBIT
JEL Classification D58·H25
1 Introduction
The financial crisis has intensified discussions about the discriminatory treatment of debt and equity in corporate tax systems. Indeed, today’s corporate tax systems in
This research was carried out when Ruud de Mooij was visiting the Oxford University Centre for Business Taxation. We are grateful to Albert van der Horst and Leon Bettendorf for research assistance and helpful comments. Comments by Marcel Gerard, Michel Aujean, Steve Bond, Mick Heen, Martin Zagler, Jenny Ligthart, and two anonymous referees are gratefully acknowledged. This research was funded partly by the European Commission and partly by the ESRC under Grant Res 060-25-0033.
R.A. de Mooij (
)Erasmus University Rotterdam and CPB, The Hague, The Netherlands e-mail:[email protected]
M.P. Devereux
developed countries allow a deduction for interest but not for equity. This leads to excessive leverage, discrimination against risky or volatile businesses, and arbitrage opportunities that erode corporate tax bases. It feeds the interest in reforming cor-porate tax systems, either in the direction of the comprehensive business income tax (CBIT) or the allowance for corporate equity (ACE). Both systems aim to neutralise the distortionary effect of corporate taxes on the financial structure of companies.
Among the two, economists typically favour ACE. This system grants equity hold-ers a certain allowance equal to a notional risk-free return. This is attractive as it re-duces the effective marginal tax rate to zero, implying that ACE is a tax on economic rent. As such, it does not distort decisions about the scale of investment, though even a tax on economic rent can affect discrete investment choices that depend on an ef-fective average tax rate. A potential disadvantage of ACE is that its narrower tax base reduces corporate tax revenue, and thus requires higher tax rates to yield the same revenue.
By contrast, CBIT disallows the exemption of interest. It turns the corporate in-come tax into a broad-based tax on capital at the level of the firm. This raises the overall cost of capital so that investment declines. The broadening of the base under CBIT will raise corporate tax revenue and, if revenue is to be maintained, allows for a lower corporate tax rate. A lower rate will typically not be sufficient to prevent a rise in the effective marginal tax rate, which is why CBIT has not gained the same popularity as ACE.
However, this paper argues that these traditional economic arguments need to be balanced by other factors created by changes in statutory tax rates. Specifically, multi-national profit shifting—driven ultimately by differences in statutory rates—has be-come increasingly important due to internationalisation of businesses and the growing importance of intangible assets. In addition, evidence indicates that discrete location choices—driven by effective average tax rates—are relatively responsive to taxation. For these reasons, it is attractive for individual countries to broaden their tax base and cut the rate, as under CBIT, as opposed to narrowing the tax base and raising the rate, as under ACE.
This result depends on the nature of the reform. Cross country flows of profit and capital depends on relative differences in tax rates. If one country can cut its statu-tory rate relative to others, then it may gain an advantage with respect to both profit shifting and discrete location choices. However, for a co-ordinated reform in the EU, the gains from lowering the statutory rate will be reduced if all countries reduce their rates, also. That is, European coordination mitigates international spillovers via statu-tory corporate tax rates and increases the relative importance of effective marginal tax rates. European coordination may thus render ACE more and CBIT less efficient as a system to tax corporate income. This implies that ACE may still be an attractive system for a coordinated reform in the EU as a whole.
We use an applied general equilibrium model for Europe to quantitatively illustrate these effects of ACE and CBIT. The model encompasses several decision margins of firms, such as marginal investment, financial structure, foreign direct investment, location choice by multi-nationals, and international profit shifting. Behavioural elas-ticities are calibrated on the basis of a careful review of the literature. Together with real world data on economic structures, the model allows us to identify for which
European countries ACE and CBIT are welfare improving. Moreover, we quantify the difference between unilateral reforms undertaken by a single country, and a joint European reform. For reasonable parameter values, we show that if introduced by a single country and given a specific revenue requirement from the tax, it is plausible for most Western European countries that CBIT is preferred over ACE. As a joint European reform, however, ACE dominates CBIT.
One qualification of our quantitative approach should be noted: we do not take account of the role of risk. In principle, this can be important in identifying the im-pact of a revenue-neutral introduction of ACE. Devereux (2009) argues that, in the presence of risk, the expected revenue from ACE, or a cash flow tax, would depend on the risk premium. If the risk premium is high relative to the risk-free rate of return, then the expected revenue-neutral rate required under an ACE would not be as high. The estimates in this paper of the required change in the statutory rate to maintain the same revenue with an ACE do not allow for this factor.
The paper is organised as follows. The next section describes the two reforms in more detail, and reviews existing studies which aim to quantify their effects. Section3 describes the applied general equilibrium model used in our analysis. The following sections show the results of the analysis. Section4considers the case in which each reform—ACE or CBIT—is introduced in a single country. Thereby, we consider the case when any revenue gains or losses from the reform are covered by changes to lump-sum transfers, consumption taxes or by the corporation tax rate. We also con-sider an alternative way of balancing the budget by combining ACE and CBIT re-forms. That is, we allow part of the costs of debt and equity finance to be deductible from tax. Each type of finance is equally treated; the proportion of financing costs relieved is chosen to make the reform revenue neutral. Section5considers the case in which the EU countries agree to cooperate, and all countries introduce the ACE or the CBIT. We assume in this case again that corporation tax rates are adjusted to bal-ance the budget. Section6offers a sensitivity analysis of the results. Finally, Sect.7 concludes.
2 Studies on ACE and CBIT
By allowing a deduction for interest but not equity, corporate tax systems discrim-inate against equity finance. To mitigate distortions induced by this discrimination, governments have started to introduce anti-avoidance regulation and thin capitaliza-tion rules. It has added to the complexity of corporate tax regimes, without yielding sufficient neutrality. A comprehensive solution would be to eliminate discrimination by implementing an allowance for corporate equity (ACE) or a comprehensive busi-ness income tax (CBIT).
2.1 Allowance for corporate equity
The ACE system was originally proposed in 1991 by the Capital Taxes Committee of the Institute for Fiscal Studies (IFS1991; Devereux and Freeman1991). It was based on an earlier idea of Boadway and Bruce (1984), who suggested an allowance
for corporate capital (ACC). Their idea was to abolish the deductibility of actual interest payments and to replace it by an allowance of the normal return, applied to the book value of the entire firm’s capital according to the tax accounts. The ACE is slightly different in that it maintains the current deductibility of actual interest payments. It adds to this a notional return on equity to be deductible against corporate profits. Since the tax advantage associated with the deduction for equity is certain, the appropriate notional return of the ACE is the risk-free nominal interest rate, e.g. the rate on government bonds (Bond and Devereux1995).
The ACE is known to have several attractive features. First, it obtains neutrality between debt and equity finance. Thus, the ACE makes thin capitalization rules re-dundant. Second, ACE is neutral with respect to marginal investment decisions. In fact, by allowing a deduction for both interest and the normal rate of return on equity, the ACE system leaves capital income untaxed and is a tax on economic rent. A third property of the ACE is that it offsets investment distortions induced by differences between economic depreciation and depreciation for tax purposes. Accelerated de-preciation for tax purposes will reduce the book value of assets in the tax accounts, thereby also reducing the ACE in later years. This exactly offsets the benefits from earlier depreciation in present value terms. Indeed, the present value of the sum of the depreciation allowance and the ACE allowance is independent of the rate at which firms write down their assets in the tax accounts.
While the ACE system is more neutral than current corporate tax systems to invest-ment and its financial structure, the narrower tax base reduces corporate tax revenue. It requires higher (corporate) tax rates to balance the government budget. The ACE would then shift the tax burden from the marginal return to capital towards economic rents. This implies that decisions as to the scale of investment would not be affected by the tax.
However, discrete choices are affected by the effective average tax rate, which is not zero under the ACE. An important example of a discrete choice is the decision of where to locate part of a multinational company (Devereux and Griffith1998). Further, higher tax rates under an ACE may be unattractive in light of international profit shifting. Multinational firms have a variety of options to shift profits across their affiliates through tax planning activities. These incentives are determined by differences in statutory tax rates.1
Recent papers have broadened the analysis of ACE in a different direction by tak-ing into account agency problems, for example, created by the conflict of interest between managers and firm owners. For instance, Keuschnigg and Ribi (2009) de-velop a corporate finance model of investment with finance constraints due to moral hazard. They find that ACE and cash-flow tax systems are no longer neutral when firms are finance constrained. Koethenbuerger and Stimmelmayr (2009) analyze the impact of ACE and find that the divergence of objectives between shareholders and managers is intensified if the corporate tax system provides an ACE. In our analysis, we do not explore the impact of ACE on agency problems.
1Profit taxes may also affect investment in the presence of capital-market imperfections by reducing net
internal funds. Empirical evidence supports the impact of net internal funds on investments (see Hubbard 1997, for an overview). This effect is not included in the CORTAX model used here.
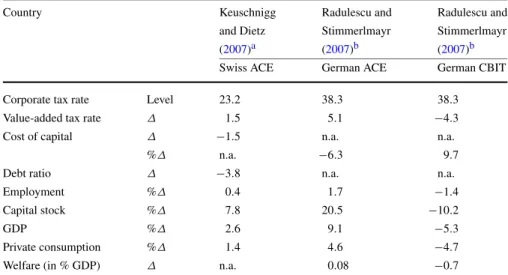
Table 1 Simulation outcomes from previous country studies on ACE and CBIT
Country Keuschnigg Radulescu and Radulescu and
and Dietz Stimmerlmayr Stimmerlmayr
(2007)a (2007)b (2007)b
Swiss ACE German ACE German CBIT
Corporate tax rate Level 23.2 38.3 38.3
Value-added tax rate Δ 1.5 5.1 −4.3
Cost of capital Δ −1.5 n.a. n.a.
%Δ n.a. −6.3 9.7
Debt ratio Δ −3.8 n.a. n.a.
Employment %Δ 0.4 1.7 −1.4
Capital stock %Δ 7.8 20.5 −10.2
GDP %Δ 2.6 9.1 −5.3
Private consumption %Δ 1.4 4.6 −4.7
Welfare (in % GDP) Δ n.a. 0.08 −0.7
aWe take the results from Table3of their study, in particular, the difference between the fourth and third
column
bWe take the results from the first column of Tables3and4of their study
There is some experience with ACE-type reforms in Austria, Croatia, Italy, Brazil, and Belgium (see Klemm2007, for an overview). Yet, empirical studies cannot give us clear-cut evidence on the economic implications of ACE reforms, either because of lack of data, or because the ACE was part of a multiple reform package, which makes it difficult to identify the impact of ACE alone. Simulation models have been used to numerically assess the economic consequences of the ACE in individual countries. Keuschnigg and Dietz (2007) use a dynamic computable general equilibrium model to assess the ACE as part of a broader reform package in the taxation of capital income in Switzerland. They derive household decisions from an overlapping gener-ation’s framework with endogenous labour supply and an endogenous portfolio com-position of savings. On the firm side, the model distinguishes between domestically owned corporate and non-corporate firms, as well as domestic subsidiaries of home and foreign-based multi-national firms. Firms endogenously determine their debt share, dividend payout, and investment behaviour. In the simulations, Keuschnigg and Dietz finance the ACE-part by an increase in the value-added tax by 1.5 percent-age points. The first column in Table1shows their results. We see that the reform reduces the cost of capital for Swiss firms by 1.5 percentage points. This raises in-vestment by 7.8%, and also raises employment and GDP. The more neutral treatment of debt and equity causes a decline in the debt/asset ratio by 3.8 percentage points. Welfare in their analysis is probably best reflected in the rise in private consumption by 1.4%.
Radulescu and Stimmerlmayr (2007) also use a computable general equilibrium model for Germany called IfoMod to perform a similar experiment as Keuschnigg and Dietz. The model includes two countries and is based on an infinitely lived agent who works in either of two sectors: a corporate or non-corporate sector. The model
describes the investment behaviour and financial behaviour of these firms. In the sim-ulations, the cost of the ACE allowance is financed by a higher VAT rate. The second column of Table1reports their findings. The authors find that the ACE is costly: it requires a 5.1 percentage point increase in the VAT rate to balance the budget for the government. The cost of capital falls by 6.3%, which causes an increase in investment by more than 20%. GDP expands by more than 9% in the long run. These results are much larger than those in Keuschnigg and Dietz (2007). In part, this can be explained by the German tax system and the economic structure of Germany, which differ from that of Switzerland. In addition, results differ due to a different model structure and different parameter values. The results we present in later sections are closer to those of Keuschnigg and Dietz.
2.2 Comprehensive business income tax
The CBIT eliminates the favourable fiscal discrimination of debt financed investment by disallowing a deduction for interest payments. The CBIT was proposed by the US Treasury (1992). In that proposal, a distinction is made between so-called CBIT en-tities and non-CBIT enen-tities. Most firms will be CBIT enen-tities (only small firms will not) who are disallowed interest deductibility. This also applies to financial compa-nies, including banks. To avoid double taxation of interest, the interest received by firms or banks from other CBIT entities is either exempt or credited. The interest that firms or banks receive from non-CBIT entities remains subject to tax, including in-terest from households and government bonds. Inin-terest received from abroad will be subject to tax, although an exemption or credit could be applied if this interest comes from a CBIT entity, e.g. if other countries also introduce a CBIT.
CBIT transforms the corporate income tax into a broad-based tax on capital. All capital income will thus be taxed at source.2A disadvantage is that it raises the cost of capital. Fewer investment projects will be profitable at the margin so that investment will decline. Yet, for a revenue-neutral reform, the broadening of the base allows for a lower corporate tax rate. This may attract mobile economic rents or paper profits of multi-nationals. The trade-off is therefore opposite from the ACE: CBIT shifts the tax burden away from rents towards marginal investment returns. On balance, the effect is ambiguous: the cost of capital on low-yielding investments financed by debt will rise, leading to lower investments. Highly profitable investments financed by equity will be taxed more lightly so that these investments will expand.
There are no real-world experiments of actual CBIT regimes. However, coun-tries have imposed reforms that limit the deductibility of interest in some way, usu-ally through thin-capitalisation rules. These rules imply that the interest is not de-ductible from profit if the debt-equity ratio exceeds a certain threshold. Buettner et al. (2008) report that in 2005 approximately 60% of the European countries had thin-capitalisation rules in place and that these rules were effective in reducing debt-equity ratios.
2In the US treasury proposal, CBIT is accompanied by an abolition of personal taxes on capital. We only
Radulescu and Stimmerlmayr (2007) have analysed the economic effects of a CBIT in Germany with their IfoMod model. The third column of Table1shows that CBIT allows for a cut in the value-added tax rate by 4.3 percentage points. The model predicts an increase in the cost of capital by almost 10%, which reduces investment by a similar amount. GDP falls by more than 5%, inducing welfare to drop by 0.7% of GDP.
2.3 Comparing ACE and CBIT
Economists traditionally favour an ACE system as a means to eliminate both invest-ment and financial distortions. CBIT has less appeal since it exacerbates marginal investment distortions. The outcomes from numerical CGE models confirm this, as Table1reveals. This view ignores, however, international distortions induced by high statutory corporate tax rates. Such distortions have gained more importance during re-cent decades in light of the internationalisation of businesses. Indeed, empirical stud-ies on profit shifting and multinational location decisions suggest large international responses. In particular, international distortions render low effective marginal tax rates less important and low statutory tax rates more important for individual coun-tries (see also Bond2000). This implies that CBIT-type reforms may enhance welfare more while ACE-type reforms may have lost potential for welfare gains. The rest of this paper explores whether this is indeed plausible for realistic parameter values.
This paper also considers a combination of ACE and CBIT reforms. ACE gives full relief for the cost of debt and equity finance, while CBIT gives relief for neither. It is clearly possible to imagine a tax which gives partial, but equal, relief for debt and equity. We consider a case in which the reform introduces a partial allowance for eq-uity, and reduces the relief for debt, so that the same proportion of the costs of equity and debt are relieved. The proportion is chosen to make the reform revenue neutral. Such a reform eliminates the distortions in the financing choice between debt and eq-uity. The effect on the cost of capital lies between that of ACE and CBIT. A combined reform may also be structured along the lines of the allowance for corporate capital (ACC). The ACC eliminates the deductibility of interest (as under CBIT) and then introduces a general allowance for corporate capital. This allowance may be a share of the normal return to replicate a combined ACE-CBIT reform.
3 The CORTAX model
This paper uses the CORTAX model to quantify the trade-offs in ACE and CBIT reform in Europe. CORTAX is an applied general equilibrium model describing the 27 countries of the European Union, the US, and Japan. It is designed to simulate the economic implications of unilateral and multilateral corporate tax policies. The structure of each country is the same and countries are linked via trade in goods and capital and via multinational firms. We set shares to replicate aggregates from na-tional accounts in 2005 and data on firm accounts in ORBIS, a comprehensive set of standardized balance sheet information, profit and loss accounts and ownership infor-mation for over 9 million companies, provided by Bureau van Dijk. Parameters are
set so as to replicate empirical elasticities found in the economic literature. CORTAX is heavily inspired by the OECDTAX-model of Sørensen (2001,2004). An earlier version was used for European tax policy analysis in Bettendorf et al. (2006,2009) and van der Horst et al. (2007). A detailed description of the structure and parame-terisation of the model can be found in Bettendorf and van der Horst (2008). This section presents the main features of CORTAX. Information on key parameters and elasticities is presented in Table2.
3.1 Households
Following the overlapping generations model of Diamond, households live for two periods. One may interpret each period to cover 40 years. We express all variables in annual terms to facilitate the interpretation in terms of national accounts data. Be-haviour within each 40-year period is assumed to be constant. Households make their decisions regarding work, consumption, and saving by maximizing a life-time utility function subject to an intertemporal budget constraint. When young (i.e. the first pe-riod), households choose to allocate their time between leisure and work. When old (i.e. the second period) households do not work but only consume. Young households receive after-tax wage income and lump-sum transfers. This income at a young age is allocated over consumption and savings. Savings are invested in a mix of bonds and stocks, which are assumed to be imperfect substitutes and which yield different rates of return. In the second period, households are retired. Consumption at old age is financed by the assets saved from the first period plus an after-tax rate of return and by lump-sum transfers. Moreover, the older generation is assumed to own the fixed factor used by firms. Therefore, the old receive the economic rents.
Household optimization yields expressions for labour supply, consumption, sav-ings and the optimal asset portfolio. Asset returns are determined on world markets and we do not explore residence-based taxes on capital in this paper. Therefore, sav-ing is not affected by the policies explored here. The most important distortion in this paper is related to the consumption/leisure choice. Labour supply behaviour in COR-TAX is governed by the usual income and substitution effects. Most empirical studies suggest that substitution effects dominate income effects so that the uncompensated elasticity of labour supply is positive. In CORTAX, we set for all countries the utility parameters so that we obtain an uncompensated elasticity of labour supply of 0.19 on average (values differ slightly due to country variation in average hours worked). 3.2 Firms
In CORTAX, one representative domestic firm and one representative multi-national headquarter is located in each country. The multinational owns a subsidiary in each foreign country. With 29 countries in CORTAX, we thus have 30 different firms op-erating in each country, namely the representative domestic firm, the representative headquarter and 28 subsidiaries that are owned by the headquarters in the other coun-tries.
Each firm maximises its value—equal to the net present value of all future cash flows—subject to the accumulation constraints and a production function. The pro-duction function features three primary factors: labour, capital, and a fixed factor.
Ta b le 2 Calibration o f C OR T AX, data 2007 Corporate N PV of EMTR Debt-Inbound Outbound Semi-elasticities tax rate d epreciation % asset stock of stock o f In v estment D ebt share CIT b ase to (CIT) allo w ances share F DI FDI to C IT rate to CIT rate C IT rate via % % Price % % GDP % GDP tr . p ricing Austria 2 5 3 7 8 . 96 3 2 2 2 4 − 0 . 40 . 2 − 0 . 1 Bulg aria 10 40 2 . 84 6 1 7 0 − 0 . 30 . 30 . 0 Cyprus 10 42 3 . 14 4 2 3 5 3 − 0 . 20 . 3 − 0 . 1 Czech Republic 24 39 8 . 34 5 2 8 1 − 0 . 50 . 30 . 0 German y 3 6 3 6 1 2 . 46 3 2 3 2 5 − 0 . 50 . 2 − 0 . 2 Denmark 2 5 4 6 4 . 94 8 4 6 2 9 − 0 . 20 . 2 − 0 . 2 Spain 3 3 3 3 1 3 . 45 8 3 0 1 0 − 0 . 60 . 2 − 0 . 1 Finland 2 6 4 0 7 . 45 1 3 1 3 4 − 0 . 30 . 2 − 0 . 1 France 33 40 10 . 35 8 3 1 3 2 − 0 . 30 . 2 − 0 . 2 United K ingdom 30 39 9 . 46 6 3 6 3 8 − 0 . 30 . 3 − 0 . 3 Greece 25 41 6 . 95 4 5 2 − 0 . 50 . 20 . 0 Hungary 1 6 3 5 5 . 85 2 2 6 1 4 − 0 . 40 . 3 − 0 . 1 Ireland 13 36 4 . 35 5 9 3 6 0 − 0 . 30 . 3 − 0 . 1 Italy 3 7 3 8 1 3 . 06 7 1 2 7 − 0 . 50 . 2 − 0 . 1 Lithuania 1 8 5 0 2 . 14 4 1 1 1 − 0 . 10 . 30 . 0 Latvia 15 46 2 . 64 8 1 3 1 − 0 . 20 . 30 . 0 Netherlands 26 36 8 . 5 5 7 6 8 173 − 0 . 20 . 2 − 0 . 6 Poland 19 37 6 . 84 8 1 7 1 − 0 . 50 . 30 . 0 Portugal 27 40 7 . 76 1 2 2 1 2 − 0 . 30 . 3 − 0 . 1 Romania 1 6 4 4 3 . 25 2 1 1 0 − 0 . 20 . 30 . 0 Slo v ak Republic 19 44 4 . 54 7 2 7 1 − 0 . 30 . 20 . 0 S love n ia 2 3 4 6 6 . 34 7 1 3 1 − 0 . 10 . 3 − 0 . 1 Sweden 28 40 7 . 75 8 5 2 4 7 − 0 . 30 . 2 − 0 . 3 Unweighted av erage 2 3 4 0 7 . 05 4 2 9 2 5 − 0 . 30 . 3 − 0 . 2 Source: V ariety o f sources and o wn computations discussed in D ev ereux and de Mooij ( 2009 )
Labour is immobile across borders and wages are determined on national labour mar-kets. Capital is assumed to be perfectly mobile internationally so that the return to capital (after source taxes) is given for each country on the world capital market. The fixed factor in domestic firms is location-specific (e.g. land) and is supplied inelasti-cally. The fixed factor in subsidiaries is firms-specific (e.g. a brand name, patent, or monopoly rent) and supply in a country depends on taxes. The income from the fixed factor reflects an economic rent.3
In calibrating the model of the firm, capital and labour parameters are determined by national accounts data on labour and capital income shares. The fixed factor in domestic firms and the multinational parent are—somewhat arbitrarily—set at 2.5% of value-added in each country. This value ensures that CORTAX yields appropriate corporate tax-to-GDP ratios. The fixed factor in foreign subsidiaries is governed by data on FDI stocks (see below).
Investment is determined by the cost of capital. The responsiveness of investment depends on the substitution elasticity between labour and capital. Most general equi-librium models adopt values between 0.5 and 1.0. We use a value of 0.7. It corre-sponds to an elasticity of investment to the user cost of capital of−0.9, which is consistent with empirical estimates (Hassett and Hubbard2002). Hence, a 10% rise in the cost of capital, e.g. from 6 to 6.6%, will reduce investment by 9%.
Firms finance their investment by issuing bonds and by retaining earnings (issuing new shares is excluded in CORTAX). The optimal financial structure depends on the difference between the after-tax cost of debt and equity. Along the lines of the trade-off theory, we include a financial distress cost associated with high debt positions. The marginal cost of debt finance increases in the debt share. In CORTAX, the convexity of the financial distress cost determines the impact of corporate taxation on a firms’ financial policy. We set the parameters in this function so as to obtain a semi-elasticity of the debt share with respect to the corporate tax rate between 0.2 and 0.4, which is based on recent empirical studies (see Weichenrieder and Klautke2008). It implies that a 10%-point higher corporate tax rate raises the debt share by between 2 and 4%-points. The convexity of the cost function implies that the semi-elasticity falls in the corporate tax rate. On average across EU countries, the semi-elasticity is 0.27 (see Table2).
3.3 Multi-nationals
In maximising the value of the firm, multi-nationals take the sum of values in its headquarter and subsidiaries. Rents earned by subsidiaries accrue to the headquarter in the parent country, which is assumed to wholly own the subsidiary. The headquar-ters are assumed to be wholly owned by domestic households. In the calibration of CORTAX, the size of the fixed factor in each subsidiary is determined by data on bi-lateral foreign direct investment (FDI) stocks. Given the fixed factor, multi-nationals decide how much capital and labour to employ in each foreign subsidiary. If a corpo-rate tax raises the cost of capital in a country, this reduces the amount of investment 3Most firm-specific rents are, in fact, quasi rents associated with past investment in, e.g. research and
development or marketing activities. CORTAX does not model these investments but considers only the rents.
the multinational is willing to invest in that subsidiary. Thus, inward FDI in a location is governed by the effective marginal tax rate.
CORTAX does not explicitly model the choice of a multinational parent to locate a subsidiary in another country. Yet, empirical studies suggest that discrete location choices are important. CORTAX captures this inframarginal choice of the multina-tional in the following way. The net value of the fixed factor in a foreign subsidiary, denoted byH, depends on the corporate tax rate in the host country. The multinational can reallocate this factor across countriesiandj. A multinational that maximizes the sum of profits in the two locations (Πi+Πj), will thus choose an optimal share of the fixed factor in countryidetermined by:
∂Π
∂Hi =
(1−τi)FH i−(1−τj)FHj=0 (1)
whereFH is the marginal income from the fixed factor. The production function of CORTAX combines labor and capital using a CES production function and combines this with the fixed factor using a Cobb–Douglas structure. This yields the following expression for the optimal division of the fixed factor in the two locations:
Hj Hi =Xj Xi 1−τj 1−τi 1 1−α (2) whereXdenotes the composite input of labor and capital, and the parameterα mea-sures the impact of the tax difference on the size of the fixed factors in the two loca-tions. Expression (2) suggests that the share of firm-specific rents located in countryj
relative to countryifalls in its corporate tax rate. As CORTAX distinguishes 27 coun-tries, we have slightly more complicated expressions than (2). Indeed, we model the share the fixed factor of a multinational in a subsidiary as a function of the statutory tax rate in that country relative to the weighted EU average. Accordingly, we capture an inframarginal location choice that is responsive to tax differences within the EU. Note that location choices between the EU and other regions are not endogenous.
Empirical evidence offers insight in the quantitative importance of discrete loca-tion decisions. A number of studies suggest that effective average tax rates (EATRs) yield a larger and more robust impact on FDI than effective marginal tax rates (EMTRs) (Devereux and Griffith1998; Devereux and Lockwood2006). The EATR is a weighted average of the EMTR and the statutory tax rate (Devereux and Griffith 2003). In CORTAX, the first-order conditions for investment capture the effect of the EMTR, i.e. the intensive margin of investment. Expression (2) determines the impact of the statutory tax rates on investment at the extensive margin. We set the parame-terαsuch that, overall, CORTAX replicates a semi-elasticity of FDI to the EATR of
−6, on average in the EU (this value varies according to the size of the multinational sector). It corresponds to the consensus estimate obtained in a recently updated meta analysis of de Mooij and Ederveen (2008).
CORTAX distinguishes two types of profit shifting by multinational firms: transfer price manipulation within the group of 29 countries and profit shifting to outside tax havens. First, foreign subsidiaries need intermediate inputs to produce output. These inputs are supplied by the parent company. As there is only one homogeneous good
in the model, the arms-length price for this intermediate input is equal to the market price of the numeraire good. However, the parent company can charge a transfer price for intra-company deliveries that deviates from this arms-length price. In particular, a headquarter company has an incentive to set an artificially low (high) transfer price for supplies to subsidiaries in countries that feature a lower (higher) statutory corpo-rate tax corpo-rate. In this way, the multinational is able to shift profits from high to low-tax countries, thereby reducing its overall tax liability. To ensure an interior solution, we specify a convex cost function to capture the costs associated with manipulated transfer pricing. Hence, profit shifting to countries with very low corporate tax rates becomes increasingly costly at the margin. The elasticity of transfer pricing with re-spect to the corporate tax rate is determined by the parameters in the cost function and is set to obtain a tax elasticity of transfer pricing of around−1.4 on average over all countries. To compare this to the empirical evidence on profit shifting, we translate it into a semi-elasticity of the corporate tax base, which requires multiplying it with the share of intrafirm trade (which, in CORTAX, is proportional to bilateral FDI stocks). We thus obtain a mean value of the semi-elasticity of−0.23, i.e. the corporate tax base shrinks by 2.3% due to profit shifting if the corporate tax rate is increased by 10%-points. This reasonably fits in the range of estimates found in the literature on transfer pricing, but is small in light of evidence on total profit shifting. As the amount of FDI differs between countries (see Table2), the semi-elasticity for transfer pricing differs as well. In particular, Table2shows that it is large in Belgium and the Nether-lands, where FDI is relatively large and small in the Central and Eastern European countries, where FDI is relatively small.
The second type of profit shifting in CORTAX reflects the presence of tax havens outside the OECD. The idea is that multi-nationals face an extra decision margin, namely how much effort to put in shifting profits to an outside tax haven. On the one hand, these efforts create a cost for the multinational, e.g. to set up a tax haven subsidiary, deal with tax haven authorities and settle possible disputes with the home fiscal authority. These costs are assumed to increase in a convex way with the tax differential vis a vis the tax haven. On the other hand, profit shifting yields a bene-fit to the firm that is proportional to the difference between the statutory corporate tax rate in the country where it operates and the corporate tax rate in the outside tax haven. This benefit is a proportional reduction in the tax base in the home country of the company. In the optimum, multi-nationals set the marginal benefit from profit shifting equal to its marginal cost. The inclusion of a tax haven implies that a higher corporate tax rate in a country induces a larger erosion of its corporate tax base via more substantial profit shifting.4We set the parameters in the cost function in a way so that we obtain a semi-elasticity of the corporate tax base of −1/2, i.e. a 10%-point tax differential vis a vis the average tax haven reduces the corporate tax base by 5%. Together with transfer pricing within the 29 countries of CORTAX, the aver-age semi-elasticity of the tax base via profit shifting thus equals−0.73. This comes close to aggregate estimates of profit shifting reported in empirical studies. Indeed, de Mooij (2005) reviews these studies and reports an average semi-elasticity of−1.0. 4CORTAX does not explicitly model tax planning via intrafirm capital structures. The second form of
Note, however, that the variation in empirical estimates is large. This also motivates a sensitivity analysis of the results.
3.4 Government
Government behaviour in CORTAX is exogenous, Hence, the government does not optimize its policies and we simply modify tax rates exogenously. In performing sim-ulations, we keep the government budget balanced, i.e. the government does not run a surplus or deficit after a reform. On the revenue-side of the government budget, we have indirect taxes on consumption and direct taxes on various sources of income: corporate income, labour income, dividends, capital gains and interest. On the ex-penditure side of the constraint, we find government consumption, interest payments on public debt and lump-sum transfers. We keep government consumption and public debt constant as a fraction of GDP. The calibration of corporate tax systems plays an important role for the outcomes of tax reforms. These systems are calibrated on tax data for 2005. In the baseline, corporate tax changes in 2006 and 2007 are simulated so that reforms are considered relative to the systems in 2007. Tax parameters for individual countries are reported in Table2.
3.5 Equilibrium and welfare
Equilibrium must hold on each market. On the goods market, a homogenous good is traded on a perfectly competitive world market. Thereby, countries cannot exert mar-ket power so that the terms of trade are fixed. On asset marmar-kets, bonds and equity of different origins are perfect substitutes and are freely traded on world markets so that returns are fixed for individual countries. Debt and equity are imperfect substitutes at the micro level, i.e. for firms and households. The current account equals the change in the net foreign asset position for each country (including rest of the world), due to Walras law. As labour is immobile internationally, wages are determined nationally on competitive labour markets.
We compute the compensating variation to measure the welfare effects of policy changes. It is equal to the transfer that should be provided to households to main-tain their utility at the pre-reform level. A positive compensating variation implies a welfare loss. In presenting the welfare effects of reforms, we put a minus for the compensating variation so that a positive value denotes an increase in welfare. We express the welfare effect in terms of GDP.
3.6 Values and limitations of CORTAX
CORTAX is valuable for economic policy analysis as it combines theoretical rigour with empirical validity and institutional detail. Theoretical rigour means that macro-economic outcomes can be related to the underlying micromacro-economic responses of agents. Thus, CORTAX allows for easy interpretation of results. Empirical validity is reflected by various share parameters that replicate true economic data. Moreover, using empirical evidence on various elasticities in the model allows us to quantify different sides of the trade-offs that are inherent in policy design. Finally, CORTAX
distinguishes actual tax parameters such as corporate tax rates, alternative fiscal de-preciation schemes, immediate expensing, different modes of finance, and opportu-nities for profit shifting.
Despite these values, CORTAX may suffer from limitations in that it ignores cer-tain mechanisms, features specifications that are not undisputed, and cannot take away the uncertainty about elasticity values. To illustrate, the model does not cap-ture income shifting between labour and capital income. It thus ignores an important role of the corporate tax in our system as a backstop for the personal income tax. In light of uncertainty about parameter values, the numerical outcomes of CORTAX should be taken with proper care. Yet, the numerical outcomes yield also valuable insights since the consistency of the framework provides common ground for a struc-tured discussion about both assumptions and economic implications of corporate tax reforms. Sensitivity analysis further facilitates this by offering insight in how changes in assumptions affect outcomes.
4 Unilateral ACE and CBIT reform
This section shows the simulation outcomes of ACE and CBIT reforms with COR-TAX. To begin with, we assume that only one country undertakes the reform at a time. Each country undertakes the reform in turn and our results show the average ef-fect across countries of the series of unilateral reforms. Note that the average efef-fects should not be interpreted as the EU-wide effects of a joint reform, which is analysed in Sect.6, as the effects for individual countries ignore spillovers to other countries.
In presenting the outcomes for European countries, we do not show the results for Belgium, Luxembourg, Estonia, and Malta. These countries are outliers due to either a peculiar economic structure (Luxembourg due to its extreme FDI positions) or special corporate tax regimes (Belgium, Estonia, and Malta). For the remaining 23 European countries, we simulate the following two reforms:5
• ACE is modelled as a deduction for the equity share of capital in the tax accounts. We apply the nominal interest rate to compute the tax deduction. ACE implies a narrowing of the corporate tax base which reduces corporate tax revenues. On average for the EU, the corporate tax-to-GDP ratio drops ex-ante from 2.7% to 1.4%.
• CBIT is modelled as an abolition of the interest deductibility. The interest deduc-tion in CORTAX is determined as the product of total assets, the debt share and the nominal interest rate. CBIT raises corporate tax revenue ex-ante by 1.9% of GDP on average in the EU.
With respect to the government budget, we consider three alternative assumptions in three consecutive subsections: adjustment of lump-sum transfers, adjustment of consumption taxes, and adjustment of statutory corporate tax rates.
4.1 Lump-sum adjustment
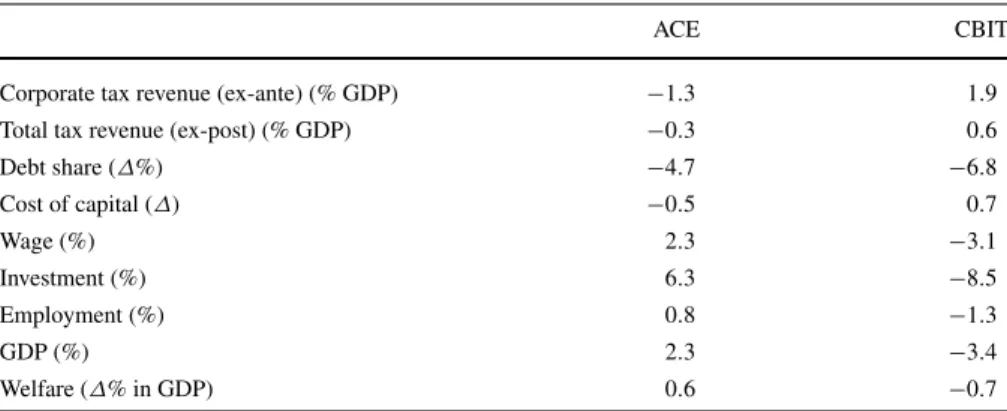
We first consider ACE and CBIT reforms when the government balances its budget by an adjustment of lump-sum transfers. This closure rule offers the best insight in the distortionary impact of the corporate tax system in our model at given corporate tax rates. Table3 summarises the economic effects of the ACE and CBIT reforms on average for the 23 European countries (unweighted averages). Figure 1 shows country-variation for the welfare effects of the two reforms.
The first column of Table3shows the effects of ACE. It is determined by two effects. First, the ACE eliminates the tax-favoured status of debt over equity finance and reduces the debt share for firms. Table3shows that, on average, the debt share falls by 4.7%-points.6Second, ACE raises investment by 6.3% due to the reduction in
the cost of capital by 0.5%-points. The expansion of investment raises the productiv-ity of labour. Firms will therefore increase their labour demand. This requires higher wages to stimulate workers to supply more labour as the uncompensated elasticity of labour supply is positive. The expansion of investment and employment increase GDP by 2.3%. Note that the ex-post revenue effect of the ACE is much smaller than the ex-ante cost in terms of corporate tax revenue. Indeed, total revenue declines by 0.3% when we account for the behavioural changes, which is less than one quarter of the ex-ante decline in corporate tax revenue.
Welfare rises by 0.6% of GDP due to the ACE, which is smaller than the GDP effect. This has two reasons. First, more employment raises production, which shows up in the effects on GDP. While this raises welfare, too, welfare also accounts for the cost of more employment in terms of less leisure. On balance, more employment
Table 3 Economic effects of unilateral ACE and CBIT reforms, with lump-sum adjustmenta
ACE CBIT
Corporate tax revenue (ex-ante) (% GDP) −1.3 1.9
Total tax revenue (ex-post) (% GDP) −0.3 0.6
Debt share (Δ%) −4.7 −6.8 Cost of capital (Δ) −0.5 0.7 Wage (%) 2.3 −3.1 Investment (%) 6.3 −8.5 Employment (%) 0.8 −1.3 GDP (%) 2.3 −3.4 Welfare (Δ% in GDP) 0.6 −0.7
aUnweighted average for 23 countries
Source: CORTAX simulations
6Under ACE, the financial distortion is not eliminated entirely. On the one hand, the actual interest paid
remains deductible, also if capital is already depreciated for tax purposes. On the other hand, the ACE is independent of tax depreciation as it depends on the equity value in the tax accounts. This asymmetric treatment leaves room for some distortion. Under CBIT, the financial distortion is abolished entirely. Also an allowance for corporate capital (ACC) would fully eliminate the financial distortion.
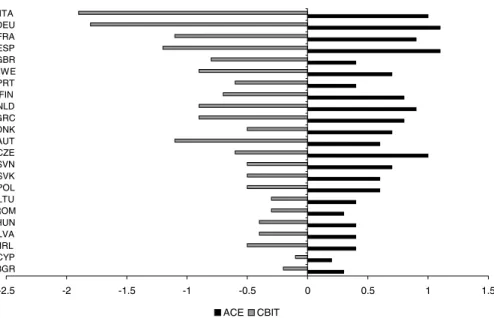
Fig. 1 Welfare effects of unilateral ACE and CBIT reforms with lump-sum adjustment (countries ranked
according to corporate tax rate). Country labels: ITA=Italy; DUE=Germany; FRA=France; ESP= Spain; GBR=United Kingdom; SWE=Sweden; PRT=Portugal; FIN=Finland; NLD=Netherlands; GRC=Greece; DNK=Denmark; AUT=Austria; CZE=Czech Republic; SVN=Slovenia; POL= Poland; LTU=Lithuania; ROM=Romania; HUN=Hungary; LVA=Latvia; IRL=Ireland; CYP= Cyprus; BGR=Bulgaria
raises welfare because taxes on labour induce a distortion between the social cost and benefits of employment. Yet, the cost of leisure renders the welfare effect of more employment smaller than the rise in production. Second, the expansion of investment is due to capital imports as domestic savings are unchanged. While capital imports increase domestic production, wages and labour supply, the capital returns are trans-ferred abroad. This renders the welfare gain from capital inflows smaller than the impact on GDP.
The effects of ACE differ across countries, depending on corporate tax rates and corporate tax bases. Figure1shows that the welfare gains of an ACE rise with the initial corporate tax rate, which serves as a proxy for the initial distortion of invest-ment. The welfare gains range from a low 0.3% for Bulgaria and Romania to more than 1% in Germany, Italy, and Spain.
The second column of Table3shows the economic effects of CBIT. Again, these effects are driven by responses in financial structure and investment. First, CBIT elim-inates the tax advantage of debt over equity, thereby reducing the debt share by 6.8 percentage points on average. Second, CBIT raises the cost of capital by 0.7 per-centage points. This reduces investment by 8.5%. Lower investment reduces labour productivity and, therefore, wages. This discourages labour supply and reduces em-ployment. The reduction in capital and labour cause a decline in GDP by 3.4%. While CBIT raises corporate tax revenue by 1.9% of GDP ex-ante, the ex-post increase in tax revenue is only 0.6% of GDP due to behavioural changes. On average, welfare falls by 0.7% of GDP which is smaller than the GDP effect for the same reasons as
explained for the ACE. Figure1shows that this welfare loss of CBIT becomes larger with the initial corporate tax rate: it ranges between−0.2% in Cyprus to−1.9% in Italy.
Overall, our simulations illustrate the traditional conclusion from the literature re-garding the distortionary effects of corporate taxation. ACE is a welfare improving policy as it removes financial and investment distortions. In fact, the ACE reform illustrates the magnitude of the welfare cost of the corporate tax via its distortions in investment and capital structure. The simulations reveal that the magnitude of this welfare cost differs substantially across countries, depending on how distortionary a tax system is initially. CBIT is found to raise the cost of capital and, therefore, exac-erbate investment distortions. In fact, the welfare cost of a CBIT system is larger than of the current system because the larger distortions in investment are more important than the smaller distortions in financial structure.
4.2 Income versus consumption-based taxation
While instructive to identify the distortionary effects of corporate taxation, balancing the government budget through lump-sum transfers is not realistic. A more policy relevant reform regarding ACE would be to recover the cost of ACE by an increase in taxes on consumption. Indeed, this would make it a reform toward a consumption-based tax system. As ACE removes the tax on the normal return to investment, it is consistent with consumption taxation. Table4shows the effects of this ACE reform. Again, it shows the effect on average for the 23 countries in Europe.
We see that the effect tax rate on consumption, measured as the total tax as a ratio of the consumption tax base, rises ex-post by 1.1%-points. Compared to financing with lump-sum transfers, Table4shows that the implications for the debt share, the cost of capital and (nominal) wages are similar under consumption tax finance. Em-ployment rises much less however, by 0.4% instead of 0.8%, due to the distortionary impact of consumption taxes on labour supply. As a result, employment, investment and GDP also rise less, and welfare increases by 0.4% of GDP, compared to 0.6%.
An alternative way to introduce consumption-based taxation would be a cash-flow tax. Under a cash-cash-flow tax, depreciation allowances in the corporate tax are replaced by an immediate write-off of investment at the time of purchase. In the long-run steady state, this is essentially the same as an ACE. Intuitively, tax depreciation allowances postpone the deduction of investment costs until the time of economic depreciation. This is less valuable for the firm than an immediate write-off due to
Table 4 Effects of ACE with
consumption tax adjustmenta
aUnweighted average for 23
countries
Source: CORTAX simulations
Effective tax rate on consumption (ex-post) (%Δ) 1.1
Debt share (%Δ) −4.7 Cost of capital (%Δ) −0.5 Wage (%) 2.3 Investment (%) 5.9 Employment (%) 0.4 GDP (%) 1.9 Welfare (%Δin GDP) 0.4
discounting. ACE equalizes postponed tax depreciation and cash-flow taxation by making the cost of discounting (i.e. the normal return) deductible. In light of this equivalence in the long run, we do not separately simulate the impact of the cash-flow tax.7For more discussion about cash-flow taxation, see e.g. Auerbach et al. (2010). 4.3 Adjustment of corporate tax rates
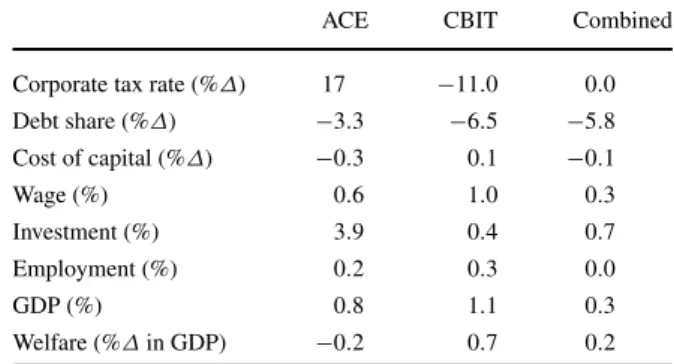
ACE and CBIT reforms can also be made revenue-neutral within the corporate tax. First, we consider full ACE and CBIT reforms where the government balances its budget by adjusting statutory corporate tax rates. This keeps the overall tax burden on corporate income unchanged and only modifies its structure. The rate is chosen so as to balance the government budget ex-ante, i.e. before behavioural effects are taken into account. If government revenues change ex-post due to behavioural effects (such as changes in investment or employment), we use consumption taxes to bal-ance the budget ex-post.8Second, we allow the government to balance the budget by giving only partial ACE relief and partial interest deductibility, i.e. a combination of ACE and CBIT. We choose shares of ACE and CBIT that make the reform both rev-enue neutral and neutral with respect to financial structure. These shares differ across countries. On average, we simulate a combination of 2/3 of an ACE and 1/3 of a CBIT, i.e. an allowance of 2/3 of the cost of finance.
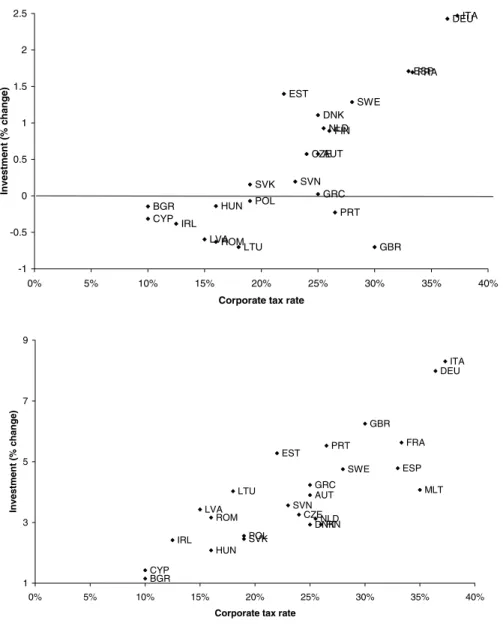
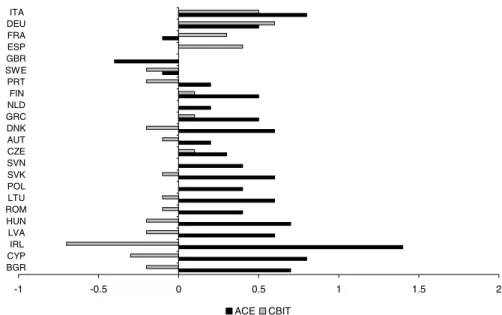
The economic effects of these three reforms are presented in Table5. Figure2 shows the investment effects of ACE and CBIT for individual countries. Figure3 shows the impact on welfare.
To obtain revenue-neutrality under an ACE, Table5shows that, on average in the 23 European countries, a 17 percentage point tax rate increase is required. The higher corporate tax rate does not directly affect marginal investment because ACE turns the corporate tax into a non-distortionary tax on economic rents. Indeed, the lower
Table 5 Effects of ACE and
CBIT with corporate tax rate adjustment, and a combined ACE-CBIT reforma
aUnweighted average for 23
countries
Source: CORTAX simulations
ACE CBIT Combined
Corporate tax rate (%Δ) 17 −11.0 0.0 Debt share (%Δ) −3.3 −6.5 −5.8 Cost of capital (%Δ) −0.3 0.1 −0.1 Wage (%) 0.6 1.0 0.3 Investment (%) 3.9 0.4 0.7 Employment (%) 0.2 0.3 0.0 GDP (%) 0.8 1.1 0.3 Welfare (%Δin GDP) −0.2 0.7 0.2
7The short-run implications of ACE and the cash-flow tax are different. In particular, the cash-flow tax
suffers from a transition problem as new capital will face an immediate write-off, while old capital still faces postponed allowances. This imposes a large short-run cost to the government budget. Under ACE, the government may offer the allowance to only new capital to prevent a windfall gain to old capital.
8This procedure is necessary to obtain feasible solutions in CORTAX. We put a cap on the corporate tax
Fig. 2 Investment effect of unilateral CBIT (top) and ACE (bottom) with corporate tax rate adjustment
panel of Fig.2 shows that investment expands in all countries due to ACE (where investment does not include the fixed factor). Nevertheless, investment rises less than under lump-sum or consumption tax finance. The reason is that the higher statutory tax rate reduces the size of the fixed factor that multi-nationals locate in their for-eign subsidiary. This reduces the marginal productivity of capital in a country and, thereby, investment. Still, investment expands on balance, which generates a higher productivity of labour, higher wages and higher employment. The average rise in em-ployment of 0.2% is half of that under consumption tax adjustment in Table4. GDP expands by 0.8% on average, compared to 1.9% under closure with the
consump-Fig. 3 Welfare effect of ACE and CBIT with corporate tax rate adjustment (countries ranked according
to importance of multi-nationals)
tion tax and 2.3% with lump-sum transfers. International distortions induced by high statutory corporate tax rates thus considerably mitigate the economic effects of ACE as measured by investment, employment and GDP.
The trade-off between national and international distortions even reverses when we look at welfare as on average welfare declines by 0.2% of GDP. On the one hand, ACE yields smaller national distortions in investment and financial structure which creates a welfare gain. On the other hand, higher corporate tax rates negatively af-fect the location of multi-nationals and induce outward profit shifting. The latter does not affect employment, investment and GDP, but do appear in our measure of wel-fare. In particular, outward profit shifting erodes the base of the corporate tax and requires higher consumption tax rates to balance the government budget, which re-duces private welfare. The relative importance of profit shifting (as well as location choice) depends on the size of the multinational sector in a country and the initial corporate tax rate (due to the convexity in the cost of transfer price manipulation). As multi-nationals are relatively small in Eastern European countries, the international distortions are relatively mild for them. Indeed, Fig.3shows that ACE still yields a net welfare gain in most Eastern European countries, up to 0.5% in Lithuania and 0.4% in Greece and Slovakia. In Western European countries with a larger multi-national sector and a relatively high corporate tax rate, the higher tax yields large welfare losses that tend to exceed the benefits of the ACE. Indeed, the Netherlands, the UK, and Germany experience a net welfare loss of, respectively, 2.1, 1.3, and 0.3% of GDP.
The second column of Table5 shows that CBIT allows governments to reduce corporate tax rates by 11 percentage points. The lower corporate tax rate mitigates the exacerbation of national distortions in investment that make CBIT so costly in
Table3. Indeed, the lower corporate tax rate has three major implications. First, it mitigates the rise in the cost of capital, although the cost of capital still increases, and hence exerts a negative effect on investment. Second, multi-nationals expand their firm-specific fixed assets if the corporate tax rate falls, which raises the marginal pro-ductivity of other capital. The top panel in Fig.2shows that, on balance, investment still falls in a number of countries, mainly those with a small multi-national sector and low corporate tax rates. However, in countries with a large multi-national sector and high corporate rates, the inflow of multi-national fixed capital offsets the adverse effect on investment. In France and Germany, total investment expands by 1.7 and 2.4%, respectively. The average effect on investment across all countries is 0.4%, while employment rises by 0.3%. Together with the inflow of firm-specific capital in foreign subsidiaries, this yields an average increase in GDP of 1.1%.
The impact of CBIT on welfare also depends on profit shifting. The lower cor-porate tax rate modifies transfer prices and reduces profit shifting to the outside tax haven. Hence, more profits are reported in the country that introduces CBIT, which broadens the corporate tax base. This enables a reduction in consumption tax rates, which benefits private consumption. On balance, we find that on average welfare rises by 0.7% of GDP. Hence, the international spillovers induced by lower corpo-rate tax corpo-rates more than offset the national distortions on investment induced by the CBIT itself. The rise in welfare does not apply to all countries, however. For instance, Fig.3shows that Latvia and Lithuania—which host a small multi-national sector and feature low corporate tax rates—experience a small welfare loss from CBIT. Some Western European countries with a large multi-national sector and high corporate tax rates, benefit substantially: the biggest welfare gain in Sweden amounts to 1.9% of GDP.
The third column in Table5shows the effect of the combined ACE–CBIT reform. We see that this reduces the debt share by 5.8%-points. The overall effect on the cost of capital is small. While ACE reduces the cost of capital on equity-financed investment, CBIT does the opposite for debt-financed investment. The model simula-tions suggest that the impact on economic variables is small, but positive. Investment rises by 0.7%, while GDP expands by 0.3%. All countries experience a welfare gain, somewhere between 0.1 and 0.4% of GDP, with an average gain of 0.2%. This gain reflects the welfare gain associated with a smaller financial distortion.
5 European-wide ACE and CBIT reform
If countries jointly implemented an ACE or CBIT reform, rather than unilaterally, the economic implications would be different, due to changes in the international spillovers. If a single country changes its statutory corporate tax rate, spillovers to other countries can be sizable. But if a coordinated reform is implemented by a group of countries, the relative change in the corporate tax rate of individual coun-tries would be much smaller. This section considers how coordinated ACE and CBIT reforms in the European Union differ in their impact from the welfare effects of uni-lateral reforms. We consider only the reform in which statutory corporate tax rates are modified as this induces the most important international spillovers. However, the
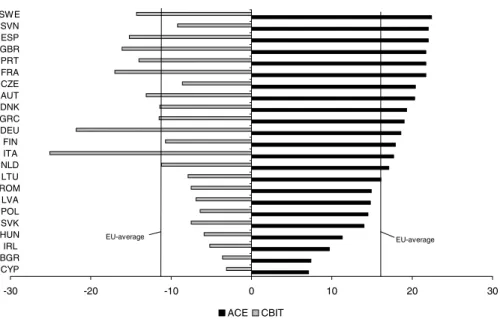
Fig. 4 Absolute change in statutory corporate tax rate to keep the government budget balanced (ex-ante)
after introducing ACE or CBIT
Table 6 Effects of joint
European ACE and CBIT reforms with corporate tax rate adjustmenta
aUnweighted average for 23
countries
Source: CORTAX simulations
ACE CBIT
Corporate tax rate (%Δ) 17.0 −11.0
Debt share (%Δ) −3.3 −6.5 Cost of capital (%Δ) −0.3 0.1 Wage (%) 1.2 0.0 Capital (%) 4.8 −1.0 Employment (%) 0.5 −0.3 GDP (%) 1.8 −0.6 Welfare in Europe (%Δin GDP) 0.4 0.0 Welfare in US (%Δin GDP) 0.12 −0.10 Welfare in Japan (%Δin GDP) 0.02 −0.02
necessary change in the corporate tax rate after implementing ACE and CBIT is not uniform across countries, but depends on the initial corporate tax structure and the structure of the economy. Figure4shows the variation in country-specific changes in the corporate tax rate, required to close the government budget after implementing the coordinated ACE or CBIT. The economic effects are presented in Table6and welfare effects for individual countries are shown in Fig.5.
Figure4shows that the required increase in the corporate tax under ACE differs considerably across countries. In low-tax countries like Bulgaria and Romania, the required rise in the tax rate is approximately 7 percentage points. High-tax countries like Sweden and Spain need an increase of more than 22 percentage points.
Simi-Fig. 5 Welfare effects of European-wide ACE and CBIT reform, with corporate tax rate adjustment
lar differences show up in the reduction of corporate tax rates under CBIT, which allows Cyprus to reduce its rate by 3 percentage points, but Italy by 25 percentage points. The common European reforms are, therefore, not neutral with respect to in-ternational spillover effects via profit shifting and multinational location decisions. Indeed, some countries will raise/reduce their rate by more than the European aver-age and thus lose/benefit from international spillover effects.
Compared to a unilateral ACE, the effect of a higher corporate tax rate on profit shifting and multi-national location under a multilateral ACE is smaller. Indeed, al-though international spillovers within Europe are not eliminated (as the change in the corporate tax rate differs), the spillovers are substantially smaller if all European counties move their tax rates in the same direction. Table6shows this. It reveals that a European-wide ACE would yield a welfare gain of 0.4% of GDP in the EU. This compares well to the welfare loss of 0.2% for an average EU country under the uni-lateral ACE. Still, the higher tax rates in European countries induce profit shifting to the outside tax haven and to the US and Japan via manipulated transfer pricing. Table6shows that, as a result, welfare in the US and Japan increase by 0.12% and 0.02% of GDP, respectively. The difference between Japan and the US is mainly due to the larger FDI stocks between Europe and the US compared to Europe and Japan. The redistribution of wealth away from European countries does not prevent a rise in European welfare in response to ACE. Indeed, the benefits of a more efficient Euro-pean tax system in terms of investment and financial structure dominate the negative spillovers vis a vis non-European countries through profit shifting.
Figure5shows that a European ACE increases welfare in most countries, but not all. In particular, Sweden, the UK and France experience a decline in welfare because they increase their corporate tax rate by a relatively large amount. Accordingly, they suffer from adverse spillovers vis a vis other European countries as well as Japan
and the US. For other European countries, we observe a net welfare gain under a European ACE. This holds also for those countries that suffer from a welfare loss under a unilateral ACE. Hence, for these countries the smaller spillovers through profit shifting render the European ACE attractive from a welfare perspective, despite the rise in the corporate tax rate.
A European CBIT allows for a reduction in corporate tax rates. Figure4shows that the size of this reduction differs across countries. While this causes some reallocation of multi-national profits across countries, the international spillovers are smaller than under a unilateral CBIT. Accordingly, countries that experience a welfare gain under a unilateral CBIT might no longer benefit from a coordinated introduction of CBIT. Table6shows that a coordinated CBIT does not increase welfare in Europe. This is markedly different from the welfare gain of 0.7% for an average EU country under the unilateral CBIT. The negligible welfare effect in Europe comes along with a welfare reduction in the US and Japan. This is because the lower rates in Europe cause an inflow of profits and an endogenous broadening of the European corporate tax base that comes at the expense of the outside countries. In Europe, the slight increase in the cost of capital due to CBIT causes a decline in investment, employment and GDP. Figure5 shows which countries benefit or lose from a European CBIT. We see that only the high-tax countries like Italy, Spain, France and Germany benefit, although the benefits are much smaller than under a unilateral CBIT. Most other countries experience a net welfare loss due to the European CBIT. Hence, European coordination makes a CBIT less attractive as a way to neutralise financial distortions and ACE more attractive.
6 Sensitivity analysis
Various calibrated parameters in CORTAX are surrounded by uncertainty, either be-cause empirical evidence is scarce or bebe-cause the empirical estimates in the literature vary. This section will explore the robustness of our findings to these parameter val-ues by performing a sensitivity analysis. In particular, we vary a number of key elas-ticities that measure the strength of responses in investment, financial structure and transfer price manipulation. We also modify the size of the fixed factor and explore simulations when we eliminate profit shifting to tax havens or multinational loca-tion choices in CORTAX. The focus of most varialoca-tion is on the size of internaloca-tional spillover effects, induced by changes in corporate tax rates. Therefore, this section will only consider unilateral ACE and CBIT reforms with corporate tax rate adjust-ment. It reveals the key mechanisms driving the outcomes in our analysis. For a more elaborate sensitivity analysis, see Devereux and de Mooij (2009).
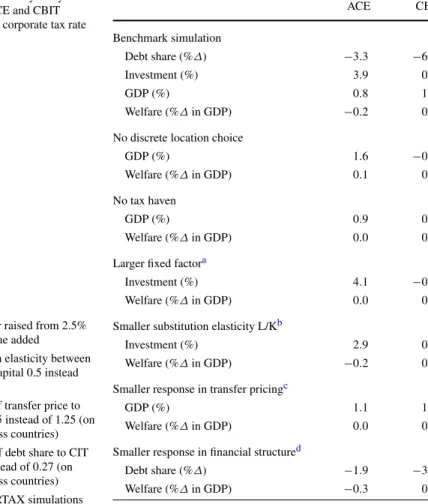
The results of our sensitivity analysis are reported in Table7. The upper four rows in the table report the outcomes from Table4for four key variables of interest: the debt share, investment, GDP and welfare. The other rows show the outcomes of the same simulations under alternative assumptions.
First, we consider simulation results when the fixed factor of foreign subsidiaries does not respond to statutory tax rates, i.e. when we ignore multinational location choices. We find that this has considerable implications for our results. In particu-lar, under ACE, GDP rises by 1.6% compared to 0.8% in the benchmark case. By
Table 7 Sensitivity analysis:
unilateral ACE and CBIT reforms with corporate tax rate adjustment
aFixed factor raised from 2.5%
to 5% of value added
bSubstitution elasticity between
labour and capital 0.5 instead of 0.7
cElasticity of transfer price to
CIT rate 0.25 instead of 1.25 (on average across countries)
dElasticity of debt share to CIT
rate 0.16 instead of 0.27 (on average across countries) Source: CORTAX simulations
ACE CBIT Benchmark simulation Debt share (%Δ) −3.3 −6.5 Investment (%) 3.9 0.4 GDP (%) 0.8 1.1 Welfare (%Δin GDP) −0.2 0.7 No discrete location choice
GDP (%) 1.6 −0.1
Welfare (%Δin GDP) 0.1 0.2
No tax haven
GDP (%) 0.9 0.6
Welfare (%Δin GDP) 0.0 0.5
Larger fixed factora
Investment (%) 4.1 −0.4
Welfare (%Δin GDP) 0.0 0.5
Smaller substitution elasticity L/Kb
Investment (%) 2.9 0.1
Welfare (%Δin GDP) −0.2 0.6 Smaller response in transfer pricingc
GDP (%) 1.1 1.1
Welfare (%Δin GDP) 0.0 0.5
Smaller response in financial structured
Debt share (%Δ) −1.9 −3.4
Welfare (%Δin GDP) −0.3 0.6
contrast, under CBIT, GDP falls by 0.1% compared to a rise of 1.1% in the base case. The direction of these effects, though not their size, is the same for welfare. If higher statutory tax rates have no implications for multi-national location, then ACE will improve welfare by 0.1% of GDP in an average EU country, compared to a drop of 0.2% of GDP in the benchmark case. For CBIT, the welfare gain of 0.7% in the benchmark case falls to 0.2% if the location effect plays no role. Our conclusions about unilateral ACE and CBIT reforms therefore rely to an important degree on the inclusion of discrete investment responses. Recent empirical evidence confirms the importance of discrete location choices, so ignoring the role of statutory tax rates for the location of multi-national investment may yield misleading conclusions on the desirability of an ACE and CBIT reform in a single country.
The next modification in Table7 is a simulation where the outside tax haven is excluded from CORTAX. Empirical evidence on profit shifting yields a wide range of estimates, from very small to very large aggregate revenue effects due to profit shifting. While our benchmark simulation is based on a central estimate from these empirical findings, profit shifting might well respond more or less to tax rate