EXPERIMENTAL STUDY
Empirical estimation of free testosterone from testosterone
and sex hormone-binding globulin immunoassays
Lam P Ly and David J Handelsman
Department of Andrology, Concord Hospital and ANZAC Research Institute, University of Sydney, Sydney NSW 2139, Australia (Correspondence should be addressed to D J Handelsman; Email: djh@anzac.edu.au)
Abstract
Background: The growing interest in measuring blood free testosterone (FT) is constrained by the unsuitability of the laborious reference methods for wider adoption in routine diagnostic laboratories. Various alternative derived testosterone measures have been proposed to estimate FT from either additional assay steps or calculations using total testosterone (TT) and sex hormone-binding globulin (SHBG) measured in the same sample. However, none have been critically validated in large numbers of blood samples.
Methods: We analyzed a large dataset comprising over 4000 consecutive blood samples in which FT as well as TT and SHBG were measured. Dividing the dataset into samples with blood TT above and below 5 nM, using a bootstrap regression modeling approach guided by Akaike Information Criterion for model selection to balance parsimony against reduction of residual error, empirical equations were developed for FT in terms of TT and SHBG.
Results: Comparison between the empirical FT equations with the laboratory FT measurements as well as three widely used calculated FT methods showed the empirical FT formulae had superior fidelity with laboratory measurements while previous FT formulae overestimated and deviated systematically from the laboratory FT values.
Conclusion: We conclude that these simple, assumption-free empirical FT equations can estimate accu-rately blood FT from TT and SHBG measured in the same samples with the present assay methods and have suitable properties for wider application to evaluate the clinical utility of blood FT measurements.
European Journal of Endocrinology152471–478
Introduction
Measuring blood testosterone concentration has central importance in the clinical evaluation of male reproduc-tive function (1). Although immunoassay of blood total testosterone (TT) has long been the standard measure-ment, theoretical arguments have been advanced for measuring also non-protein-bound or so-called free test-osterone (FT) (2, 3). As a non-polar steroid, testtest-osterone is present in blood at higher concentrations than its solubility in extracellular fluid because it is largely pro-tein-bound. The majority of blood TT is bound to sex hor-mone-binding globulin (SHBG), a hepatic homodimeric glycoprotein with limited, high-affinity testosterone-binding sites (4 – 6). The remainder of blood testosterone is mostly bound to albumin and other low-affinity bind-ing proteins with only 1 – 2% remainbind-ing unbound to any circulating protein (7). Based on these physiological facts, the free hormone hypothesis (8 – 10) postulates that this small free fraction is the most biologically
active fraction of circulating testosterone for its greater accessibility to tissues. As a result, measurement of this FT has been of increasing interest (Fig. 1). Neverthe-less, the free fraction may also be more accessible to sites of metabolism and the net effect of whether the free fraction connotes a more or less biologically active frac-tion, and whether this balance is the same in all tissues, cannot be resolved on a theoretical basis but requires empirical evaluation. In turn this requires robust and efficient methods for measurement of FT which may be included in clinical studies.
The original reference methods to measure FT, equili-brium dialysis (11, 12) and centrifugal ultrafiltration (13, 14), are manual methods which are, however, too cumbersome and laborious to become routinely used in large, high-throughput commercial pathology laboratories which rely increasingly on automated multiplex assay platforms. In pursuit of simpler methods to measure FT, the limitations of the reference methods have led to development of alternative derived
testosterone measures created either by additional assay steps or by calculations based on TT and SHBG. The additional assay approach include the Free Testosterone Analog Assay (15) and the so-called bioavailable terone (which measures loosely albumin-bound testos-terone as well as FT), whereas the calculations have been based on theoretical equilibrium binding equations based on the Law of Mass Action, which can be solved for FT from a second-degree equation in TT and SHBG (2, 16) or a simple ratio of TT/SHBG (17). The practical implementation of these equilibrium binding equations, however, requires several assump-tions including how many binding proteins to include in the equation, whether to measure or use nominal concentrations of non-SHBG-binding proteins, whether the SHBG-binding affinity is fixed and the same for all samples and which fixed affinity constants for SHBG and other binding proteins to use in the equations. None of these derived calculated measures have been well validated against a reference method in large samples and some are manifestly invalid estimates of FT (17 – 19). The present study was based on a large dataset of nearly 4000 blood samples from a routine diagnostic endocrinology laboratory employing the cen-trifugal ultrafiltration FT assay. We have developed an Akaike Information Criterion (AIC)-guided bootstrap regression modeling approach to derive simple empirical equations to estimate FT from measurements of TT and SHBG in the same sample. This approach is free of assumptions about theoretical binding equilibria and we identify systematic deviations inherent in other widely used calculated FT approaches.
Materials and methods
Samples
Data including age and sex from all blood samples submitted between 1999 and 2003 to the Central Sydney Area Health Service Endocrinology Diagnostic Laboratory requesting testosterone measurements were routinely assayed for FT by centrifugal ultrafiltration as
well as for TT and SHBG. All laboratory data for this study were provided in de-identified form after discharge of all diagnostic reporting responsibilities so that no ethics approval was required.
Assays
Hormone assays were performed in a single teaching hospital-based routine diagnostic endocrinology laboratory as described previously (20 – 22) using estab-lished commercial immunoassays routinely monitored by participation in external quality-control programs. Plasma TT and SHBG were measured by commercial immunoassays (Immulyte, Los Angeles, CA, USA). During the period of this study, coefficients of variation for TT assay (n¼34 – 44 assays) were 8.2% at high (mean, 28.5 nM), 12.4% at mid-range (13.6 nM) and 30.2% at low (2.9 nM) concentrations and for SHBG assay (n¼104 assays) were 5.6% at high (71.4 nM) and 5.6% at low (5.1 nM) concentrations.
FT was measured by an in-house adaptation of the centrifugal ultrafiltration assay (13). Samples and con-trols (600ml) were well mixed with 50ml tritiated tes-tosterone tracer in glass tubes and incubated for 1.5 h in a 378C waterbath. Specimens (500ml) were then added to Centrifree columns (Millipore) and centrifuged at 2000 r.p.m. for 20 min (308C) following which 50ml specimens of filtrate and totals were counted in a liquid scintillation counter. The proportion of unbound testosterone was then calculated and the actual FT cal-culated from the TT in the same sample. Coefficients of variation for the proportion of unbound testosterone were 9.4% at low (mean, 1.2% unbound) and 12.8% at high (2.2% unbound) quality-control samples.
Data analysis
FT was calculated by published methods described by Sodergard et al. (16) and Vermeulen et al. (2) based on equilibrium binding equations using TT and SHBG results from the same blood sample. Free androgen index (FAI) was calculated as described in (17).
Regression of laboratory or calculated FT on other variables was performed using SPSS version 12 soft-ware. Bootstrap resampling (23) was performed with S Plus software. Agreement between estimates and identification of systematic discrepancies between esti-mates of FT was analysed by deviance plots, modified from the Bland – Altman approach (24), with calcu-lation of mean bias and limits of agreement. The deviance plot places the difference between the test and standard method on theyaxis whereas thexaxis is the laboratory measurement, rather than the mean of test and standard as in the original Bland – Altman approach. This enhances interpretation of deviations according to the true result as the laboratory measure-ment is the recognized gold standard. This adaptation is valid as the correlation between methods is very high
Figure 1Plot of the number of scientific papers using the term free testosterone cited in a search of the Medline database by year.
(.0.95), thereby avoiding problems of interpretation due to spurious correlation where correlations are lower (25). For evaluation of FAI, a dimensionless ratio, a quantile/quantile plot using standardized normal deviates (Zscores) was used.
Goodness of fit for competing regression models was evaluated by AIC value (26), a maximum-likelihood approach to global model entropy reduction in balan-cing the number of parameters against the reduction in residual error. This was defined as
AIC¼x222df
where x2¼S[(calculated FT2laboratory FT)2/ laboratory FT] and df (degrees of freedom)¼number of cases21.
Results
Data from a total of 4054 consecutive blood samples (3530 males, 87%) processed during 1999 – 2003 were obtained for analysis. After excluding 79 speci-mens (69 with age ,18 years, five with age
.100 years, five missing one or more hormone results), 3975 specimens (3475 males, 87%) with com-plete data for all three hormones (FT, TT, SHBG) as well as age and sex were analyzed (Table 1).
General modeling strategy
After preliminary analysis indicating the need for two formulae to span the full range covered by these speci-mens, data were divided into samples with TT above or below 5 nM for all further analyses (Table 1). Prediction equations for FT from TT and SHBG considered as main effects as well as including an interaction and quadratic terms for main effects were estimated according to
the following general formula:
FT¼a0þa1 TTþa2 SHBGþa3 TT£SHBG
þa4 TT2þa5 SHBG2
The following hierarchy of models was considered: FT¼a0þa1 TTþa2 SHBGþa3 TT £SHBG ðModel 1Þ FT¼a0þa1 TTþa2 SHBGþa3 TT £SHBGþa4 TT2 ðModel 2Þ FT¼a0þa1 TTþa2 SHBGþa3 TT £SHBGþa5 SHBG2 ðModel 3Þ FT¼a0þa1 TTþa2 SHBGþa3 TT £SHBGþa4 TT2þa5 SHBG2 ðModel 4Þ
Full data regression models
Using the full dataset (n¼3975), in the low-TT range model 1 was the best (AIC, 5147) followed by model 2 (6804), model 3 (8308) and model 4 (13 532). In the high-TT range, the sequence was reversed with model 4 the best (AIC, 122 247), followed by model 3 (129 146), model 2 (136 045) and model 1 (142 945). As it was not possible to evaluate the qual-ity of fit of these equations within the same dataset, a modified split-sampling strategy was adopted for sub-sequent model development and evaluation against lab-oratory FT and other calculated FT formulae.
Bootstrap resampling regression models
A limitation of using the full dataset for a regression model is that there is no independent mechanism to test the adequacy of its fit in different datasets. For this reason, rather than using a standard split-sampling
Table 1 Characteristics of subjects and samples.
Mean S.E.M. S.D. Minimum
Percentiles
Maximum
25th 50th 75th
TT,5 nM (n¼846; 463 females and 383 males)
Age (years) 42.8 0.6 16.1 18.2 29.4 40.5 53.2 91.5 Testosterone (nM) 2.2 0.0 1.3 0.7 0.8 2.0 3.2 4.9 SHBG (nM) 49.2 1.5 42.2 2.0 23.9 36.5 61.4 399.0 FAI 8.3 0.3 9.2 0.2 2.2 4.8 11.0 54.5 Laboratory FT (pM) 29.4 1.0 29.8 1.0 7.0 21.0 45.0 459.0 Vermeulen FT (pM) 40.8 1.2 33.6 1.6 13.7 30.0 60.3 151.7 Sodergard FT (pM) 43.0 1.3 37.2 1.7 14.0 31.0 63.0 170.0
TT$5 nM (n¼3129; 37 females and 3092 males)
Age (years) 44.8 0.3 15.4 18.0 32.1 43.5 56.3 90.6 Testosterone (nM) 14.9 0.2 9.4 5.0 9.6 13.3 18.0 240.0 SHBG (nM) 33.2 0.4 21.4 2.3 20.1 28.2 39.7 329.0 FAI 57.7 1.2 67.8 3.9 32.0 46.8 67.2 1889.8 Laboratory FT (pM) 227.2 3.1 173.3 1.0 132.0 194.0 269.0 3003.0 Vermeulen FT (pM) 334.8 5.5 307.7 34.3 204.3 285.6 393.9 9933.1 Sodergard FT (pM) 377.5 6.6 368.7 35.0 230.0 320.0 450.0 12 000.0
approach (allowing only a single test), we proceeded to develop a bootstrap resampling methodology using 1000 replications of a random 60% selection (with replacement) from the full dataset.
From the bootstrap models, for low testosterone (TT ,5 nM) model 1 was the most favorable followed by model 3, model 2 and model 4 (AIC values of 4874, 4937, 5032 and 6441, respectively). For high testosterone (TT $5 nM), model 2 was preferred followed by model 4, model 1 and model 3 (AIC values of 142 214, 142 359, 177 512 and 178 684, respectively).
The empirical FT (EFT) formulae for further evalu-ation against other methods had the following coeffi-cients (with TT and SHBG in nM) as specified below:
EFT-lo¼26:593þ19:304 TTþ0:056 SHBG
20:0959 TT£SHBG
EFT-hi¼252:65þ24:4 TT20:704 SHBG
20:0782 TT£SHBG20:0584 TT2
Comparison of empirical equations with
laboratory FT measurements and other
calculated FT values
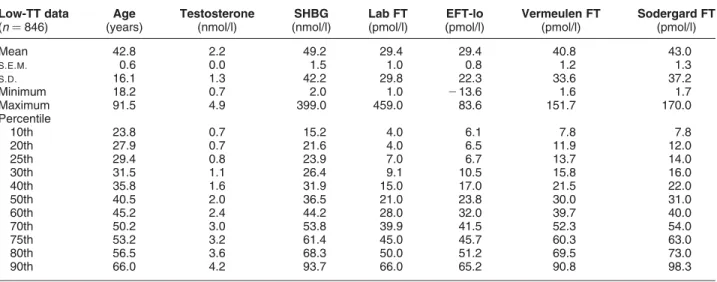
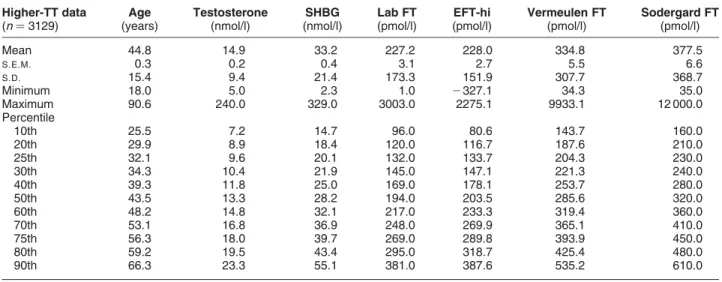
The empirical FT formulae were then evaluated for agreement and deviation from the laboratory FT measurements and the two other calculated FT estimates (Sodergard et al. (16) and Vermeulen et al. (2)). The distribution of values by centiles is displayed in Table 2 (for low TT) and Table 3 (for high TT). For the empirical FT formulae, the deviance plots (Fig. 2) show good agreement with the laboratory FT measurements
across the full range of specimens. The Sodergard- and Vermeulen-calculated FT formulae show over-esti-mation and wider limits of agreement compared with the laboratory FT values.
Comparison of empirical FT formula and
laboratory FT measurements with FAI
In order to compare FAI, a dimensionless ratio, to lab-oratory FT measurements (in concentration units), both were transformed into standardized normal devi-ates (Z scores) and the discrepancy between Z scores (ZFAI–ZLabFT) displayed in a deviance plot (Fig. 3).
These plots showed severe influence of SHBG on FAI, especially when SHBG was low, as well as poor agree-ment with laboratory FT through much of the range.
Discussion
There has been a growing interest in measuring blood FT concentrations (2, 3). The steady increase in interest over two decades accelerated during the 1990s, coinciding with the 20-fold increase in US testosterone sales (27). Regardless of the unproven empirical clinical utility of FT measurements, the laborious manual refer-ence methods of equilibrium dialysis and centrifugal ultrafiltration have proved unsuitable for large high-throughput pathology laboratories, so their wider evaluation is thereby constrained. In clinical practice, laboratories operating automated multi-channel immunoassay platforms provide most testosterone assays – a setting unsuited to the slow, cumbersome and radiation-dependent manual reference FT assays.
Table 2 Comparison of various estimates of FT in the low-testosterone data. Comparison of the new empirical FT formula (EFT-lo) with laboratory measurement (Lab FT) and Vermeulen- and Sodergard-calculated FT formulae at particular percentiles of the
distribution of laboratory FT values for the low-TT values (TT,5 nM). Note that FT estimates from the EFT-lo were always closer to the expected values of Lab FT than either of the other two calculated FT formulae. Two specimens (of 846; 0.2%) had negative calculated EFT-lo values. Low-TT data (n¼846) Age (years) Testosterone (nmol/l) SHBG (nmol/l) Lab FT (pmol/l) EFT-lo (pmol/l) Vermeulen FT (pmol/l) Sodergard FT (pmol/l) Mean 42.8 2.2 49.2 29.4 29.4 40.8 43.0 S.E.M. 0.6 0.0 1.5 1.0 0.8 1.2 1.3 S.D. 16.1 1.3 42.2 29.8 22.3 33.6 37.2 Minimum 18.2 0.7 2.0 1.0 213.6 1.6 1.7 Maximum 91.5 4.9 399.0 459.0 83.6 151.7 170.0 Percentile 10th 23.8 0.7 15.2 4.0 6.1 7.8 7.8 20th 27.9 0.7 21.6 4.0 6.5 11.9 12.0 25th 29.4 0.8 23.9 7.0 6.7 13.7 14.0 30th 31.5 1.1 26.4 9.1 10.5 15.8 16.0 40th 35.8 1.6 31.9 15.0 17.0 21.5 22.0 50th 40.5 2.0 36.5 21.0 23.8 30.0 31.0 60th 45.2 2.4 44.2 28.0 32.0 39.7 40.0 70th 50.2 3.0 53.8 39.9 41.5 52.3 54.0 75th 53.2 3.2 61.4 45.0 45.7 60.3 63.0 80th 56.5 3.6 68.3 50.0 51.2 69.5 73.0 90th 66.0 4.2 93.7 66.0 65.2 90.8 98.3
Figure 2Deviance plots of the performance of the empirical FT formula (left-hand panels), Vermeulen FT formula (middle panel) and Sodergard FT formula (right-hand panels) with the high range (TT.5 nM) in the upper panels and low range (TT,5 nM) in the lower panels. Points represent the deviation of each formula from laboratory FT (on theyaxis) plotted against the laboratory FT on thexaxis. Solid lines indicate the mean deviation and the dashed lines represent the upper and lower limits of agreement. Note that all three figures in the upper or lower panels have the same scales for axes but that the scales differ between the high-range (upper panels) and low-range (lower panels) plots.
Table 3 Comparison of various estimates of FT in the high-testosterone data. Comparison of the new empirical FT formula (EFT-hi) with the laboratory measurement (Lab FT) and Vermeulen- and Sodergard-calculated FT formulae at particular percentiles of the distribution of laboratory FT values for the high-TT values (TT.5 nM). Note that FT estimates from the EFT-hi are always closer to the expected values of Lab FT than either of the other two calculated FT formulae. 18 specimens (of 3129; 0.6%) had negative calculated EFT-hi values. Higher-TT data (n¼3129) Age (years) Testosterone (nmol/l) SHBG (nmol/l) Lab FT (pmol/l) EFT-hi (pmol/l) Vermeulen FT (pmol/l) Sodergard FT (pmol/l) Mean 44.8 14.9 33.2 227.2 228.0 334.8 377.5 S.E.M. 0.3 0.2 0.4 3.1 2.7 5.5 6.6 S.D. 15.4 9.4 21.4 173.3 151.9 307.7 368.7 Minimum 18.0 5.0 2.3 1.0 2327.1 34.3 35.0 Maximum 90.6 240.0 329.0 3003.0 2275.1 9933.1 12 000.0 Percentile 10th 25.5 7.2 14.7 96.0 80.6 143.7 160.0 20th 29.9 8.9 18.4 120.0 116.7 187.6 210.0 25th 32.1 9.6 20.1 132.0 133.7 204.3 230.0 30th 34.3 10.4 21.9 145.0 147.1 221.3 240.0 40th 39.3 11.8 25.0 169.0 178.1 253.7 280.0 50th 43.5 13.3 28.2 194.0 203.5 285.6 320.0 60th 48.2 14.8 32.1 217.0 233.3 319.4 360.0 70th 53.1 16.8 36.9 248.0 269.9 365.1 410.0 75th 56.3 18.0 39.7 269.0 289.8 393.9 450.0 80th 59.2 19.5 43.4 295.0 318.7 425.4 480.0 90th 66.3 23.3 55.1 381.0 387.6 535.2 610.0
Consequently, simplified approaches to estimate FT have been developed. These derived testosterone measures can be divided into those requiring additional assay steps and those based on calculations using TT and SHBG concentrations from the sample. None have been thoroughly validated and some, like the FT analog assay (18, 19, 28) and the FAI (17), are clearly invalid, at least when applied to male samples. Thorough validation of derived testosterone measures involves both internal and external validity. Internal validity requires a comparison with the standard reference methods whereas external validity requires critical evaluation of whether derived testosterone measures improve upon TT in clinical application for identification of rectifiable androgen deficiency in well-designed studies. The latter, however, depends on development of more facile approaches to measurement of blood FT concentrations.
The present study developed and undertook internal validation of a simple empirical, model-free method to calculate FT, requiring only TT and SHBG concen-trations in the same sample. Our simplified approach recognizes the non-linearity of the relationship between FT with TT and SHBG as predicted by well-known theoretical equilibrium binding equations (2, 16) while also freeing it from specific assumptions and sim-plifications inherent in the equilibrium binding equations model. Preliminary modeling showed that no single equation could cover the full range of TT and SHBG concentrations if samples included not just men but also women and children, as well as severely hypogonadal men. However, dividing the samples with an arbitrary threshold of 5 nM allows for develop-ment of a pair of excellent, versatile prediction
equations. This threshold corresponds to mostly male samples above the threshold as well as females, children or hypogonadal male samples below but was more practical than using sex or age as classification criteria. The inability of a single empirical equation to cover all TT and SHBG concentrations raises questions also about the validity of the theoretical equilibrium binding equation model used in other calculational approaches (2, 16), especially when applied to extreme blood TT and SHBG concentrations. Such invalidity is most likely to stem from the many assumptions required to practically implement equilibrium binding equations rather than any challenge to the Law of Mass Action. The dichotomy between high and low TT levels is remi-niscent of the FAI which is invalid for both theoretical reasons as well as empirical evidence when applied to male samples whereas it is valid and useful in women or children who have much lower blood TT (17). Another major contributing factor to the requirement for a distinct model for samples with lower TT concen-trations is the recently established invalidity of auto-mated platform testosterone assays for samples in that low range (29, 30), a failing that has been likened to random-number generation (31).
In evaluating our empirical approach, we also reviewed the validity of the three most frequently used calculational estimates of FT against the centrifugal ultrafiltration reference method. While the empirical equation has satisfactory agreement relative to the laboratory FT measurements, the three other widely used calculated FT estimates deviate systematically from the laboratory FT values. The two calculated FT methods based on theoretical binding equations that result in second-degree equations in TT and SHBG
Figure 3Deviance plots of the difference between Z scores for FAI and labora-tory FT measurement at high TT (upper panels) and low TT (lower panels) according to the laboratory FT (left-hand panels), SHBG (middle panels) and TT (right-hand panels). Dashed lines are the line of agreement. Note differ-ences between upper and lower panels in terms of the xaxis scale.
both overestimated FT levels throughout the range. The discrepancy between these findings and the previous calculational FT methods may be because the present approach avoids assumptions inherent in them of a nominal, fixed affinity constant for testosterone binding to SHBG, an assumed albumin concentration and affi-nity and neglecting other blood testosterone-binding proteins. A recent study noted flaws in the suitability of the two calculated FT equations attributable to the notional SHBG-binding affinity and other assumptions (32). It is also notable that the original validation studies for these calculated FT methods were based on very few samples, namely 11 (16) and 28 (2). Another comparative study involved 50 samples (3). On the other hand an important caveat on the present empiri-cal approach is its reliance on the specific TT and SHBG assays used in this study. It cannot be assumed that the specific equations would be portable to other assay combinations, or even the same assays if they were significantly modified.
The third calculated measure, the so-called free androgen (or testosterone) index (FAI), is the ratio of TT/SHBG usually expressed as a percentage. The FAI correlated poorly with laboratory FT measurements and demonstrated extreme influence of low SHBG con-centrations. This is not surprising as this ratio over-sim-plifies and ignores the non-linearity of FT in terms of TT and SHBG as predicted by theoretical binding equations, whereby FT may be approximated by this ratio if, and only if, the TT concentration is negligible in relation to the concentrations of SHBG-binding sites (17). While this is a reasonable approximation for samples from women and children where blood tes-tosterone concentrations are rarely above 10% of SHBG concentration, this is not true in samples from most men in whom the higher blood TT concentrations are comparable with the SHBG concentrations and cannot be neglected. Thus our more extensive evalu-ation confirms the previous data that FAI does not correspond to actual FT measurements (17).
The free hormone hypothesis (8 – 10, 33 – 35) remains unproven (36) and requires further external validation. In asserting that the non-protein-bound free fraction is the most biologically active moiety of a circulating steroid hormone with the protein-bound moiety a reserve, biologically inactive buffer, this con-cept lacks theoretical validity or empirical proof. In theoretical terms, if non-protein-bound (or lightly bound) circulating steroids are more readily trans-ported to tissues, this applies equally to target tissues (enhancing bioactivity) as well as to hepatic sites of steroid degradation (terminating bioactivity). The net balance between these two countervailing effects is inherently unpredictable depending on many dynamic factors including relative tissue mass and blood flow of target and metabolizing tissues. Hence, whether free hormone measurements represent a more active or less (more rapidly inactivated) biologically active
moiety of a circulating steroid cannot be assumed a priori. The demonstrations that SHBG-bound testoster-one is biologically active, via binding to cell-surface SHBG receptor (37), and that rodents have no circulat-ing SHBG (38), further question the free hormone hypothesis which predicts that testosterone tightly bound to SHBG would form a biologically inactive buffer reservoir. Yet, despite deficient theoretical ration-ale, derived testosterone measures might still be useful empirically if they provided improved prediction over standard blood TT measurements to identify rectifiable androgen deficiency. The conspicuous lack of such empirical validation may be at least partly due to the limited availability of valid calculated FT methods. The present findings are not directly informative regarding other derived testosterone measures that involve an additional assay step (e.g. free analog assay or bioavailable testosterone). While both assays may be technically reproducible (2, 3, 39), the free analog assay clearly does not measure free testosterone (18, 19, 40) while the bioavailable (corresponding to free plus loosely albumin-bound fractions) is not intended to correspond to free testosterone measure-ments. For both assays, empirical validation relies on convincing evidence of providing superior or additional biological information to TT measurements as judged by independent biological effects. This remains conten-tious and almost entirely unproven.
We conclude that a simple, empirical calculation can provide a robust, reliable and valid estimate of blood FT from TT and SHBG in the same sample. This calculated FT method has improved fidelity with empirical labora-tory measurements of FT by a reference method and obviates the need for additional laborious manual assays. This study also highlights the limited validation and systematic deviations from reference methods of the three most widely used calculated FT methods. Further studies using the new formulae developed in this study may be helpful in determining whether FT measurements provide any additional clinical value over the well-established clinical gold standard of blood TT measurements to confirm the clinical diagno-sis of treatable androgen deficiency.
Acknowledgements
The authors thank Kris Tan, Paul Williams, Debbie Wong, Mark Jimenez, Ian Caterson and Marcus Seibel for providing access to the data and are grateful to Peter Liu and Rob McLachlan for their helpful com-ments on the manuscript.
References
1 Handelsman DJ. Androgen action and pharmacologic uses. InEndocrinology, pp 2232 – 2242. Ed. LJ Degroot. Philadelphia: W B Saunders, 2001.
2 Vermeulen A, Verdonck L & Kaufman JM. A critical evaluation of simple methods for the estimation of free testosterone in serum.
Journal of Clinical Endocrinology & Metabolism 1999 84
3666 – 3672.
3 Morley JE, Patrick P & Perry 3rd HM. Evaluation of assays available to measure free testosterone. Metabolism: Clinical and Experimental200251554 – 559.
4 Siiteri PK, Murai JT, Hammond GL, Nisker JA, Raymoure WJ & Kuhn RW. The serum transport of steroid hormones. Recent Progress in Hormone Research198238457 – 510.
5 Joseph DR. Structure, function, and regulation of androgen-bind-ing protein/sex hormone-bindandrogen-bind-ing globulin.Vitamins and Hormones
199449197 – 280.
6 Hammond GL, Avvakumov GV & Muller YA. Structure/function analyses of human sex hormone-binding globulin: effects of zinc on steroid-binding specificity.Journal of Steroid Biochemistry and Molecular Biology200385195 – 200.
7 Dunn JF, Nisula BC & Rodbard D. Transport of steroid hormones: binding of 21 endogenous steroids to both testosterone-binding globulin and corticosteroid-binding globulin in human plasma.
Journal of Clinical Endocrinology and Metabolism19815358 – 68. 8 Ekins R. Measurement of free hormones in blood. Endocrine
Reviews1990115 – 46.
9 Pardridge WM. Selective delivery of sex steroid hormones to tissues by albumin and by sex hormone-binding globulin.
Oxford Reviews of Reproductive Biology198810237 – 292. 10 Mendel CM. The free hormone hypothesis: a physiologically
based mathematical model. Endocrine Reviews 1989 10
232 – 274.
11 Mathor MB & Wajchenberg BL. A simplified method for the calculation of unbound or free testosterone by equilibrium dialysis of undiluted plasma.Clinica Chimica Acta1985145213 – 218. 12 Umstot ES, Baxter JE & Andersen RN. A theoretically sound and
practicable equilibrium dialysis method for measuring percentage of free testosterone. Journal of Steroid Biochemistry 1985 22
639 – 648.
13 Hammond GL, Nisker JA, Jones LA & Siiteri PK. Estimation of the percentage of free steroid in undiluted serum by centrifugal ultra-filtration-dialysis. Journal of Biological Chemistry 1980 255
5023 – 5026.
14 Vlahos I, Macmahon W, Sgoutas D, Bowers W, Thompson J & Trawick W. An improved ultrafiltration method for determining free testosterone in serum. Clinical Chemistry 1982 28
2286 – 2291.
15 Ooi DS, Innanen VT, Wang D, Chong GL, Donnelly JG, Arseneault JJ, Pronovost C & Wells G. Establishing reference intervals for DPC’s free testosterone radioimmunoassay.Clinical Biochemistry19983115 – 21.
16 Sodergard R, Backstrom T, Shanbhag V & Carstensen H. Calculation of free and bound fractions of testosterone and estradiol-17 beta to human plasma proteins at body temperature.
Journal of Steroid Biochemistry198216801 – 810.
17 Kapoor P, Luttrell BM & Williams D. The free androgen index is not valid for adult males. Journal of Steroid Biochemistry and Molecular Biology199345325 – 326.
18 Winters SJ, Kelley DE & Goodpaster B. The analog free testoster-one assay: are the results in men clinically useful? Clinical Chemistry1998442178 – 2182.
19 Rosner W. An extraordinarily inaccurate assay for free testoster-one is still with us.Journal of Clinical Endocrinology and Metabolism
2001862903.
20 Handelsman DJ, Conway AJ, Howe CJ, Turner L & Mackey MA. Establishing the minimum effective dose and additive effects of depot progestin in suppression of human spermatogenesis by a testosterone depot.Journal of Clinical Endocrinology and Metabolism
1996814113 – 4121.
21 Handelsman DJ, Wishart S & Conway AJ. Oestradiol enhances testosterone-induced suppression of human spermatogenesis.
Human Reproduction200015672 – 679.
22 Turner L, Conway AJ, Jimenez M, Liu PY, Forbes E, Mclachlan RI & Handelsman DJ. Contraceptive efficacy of a depot progestin and androgen combination in men.Journal of Clinical Endocrinology and Metabolism2003884659 – 4667.
23 Efron B & Tibshirani RJ.An Introduction to the Bootstrap. New York: Chapman & Hall, 1993.
24 Bland JM & Altman DG. Statistical methods for assessing agreement between two methods of clinical measurement.
Lancet1986i307 – 310.
25 Bland JM & Altman DG. Comparing methods of measurement: why plotting difference against standard method is misleading.
Lancet19953461085 – 1087.
26 Akaike H. Information theory and extension of the maximum likelihood principle. InSecond International Symposium on Infor-mation Theory, pp 267 – 281. Eds BN Petrov & F Czaki. Budapest: Akademiai Kiado, 1973.
27 Bhasin S, Singh AB, Mac RP, Carter B, Lee MI & Cunningham GR. Managing the risks of prostate disease during testosterone replacement therapy in older men: recommendations for a standardized monitoring plan. Journal of Andrology 2003 24
299 – 311.
28 Jowett T, Chu F & Ekins R. Validity of current analog-based free hormone immunoassays.Steroids198852365 – 366.
29 Taieb J, Mathian B, Millot F, Patricot MC, Mathieu E, Queyrel N, Lacroix I, Somma-Delpero C & Boudou P. Testosterone measured by 10 immunoassays and by isotope-dilution gas chromatog-raphy-mass spectrometry in sera from 116 men, women, and children.Clinical Chemistry2003491381 – 1395.
30 Wang C, Catlin DH, Demers LM, Starcevic B & Swerdloff RS. Measurement of total serum testosterone in adult men: compari-son of current laboratory methods versus liquid chromatography-tandem mass spectrometry.Journal of Clinical Endocrinology and Metabolism200489534 – 543.
31 Herold DA & Fitzgerald RL. Immunoassays for testosterone in women: better than a guess? Clinical Chemistry 2003 49
1250 – 1251.
32 Emadi-Konjin P, Bain J & Bromberg IL. Evaluation of an algorithm for calculation of serum ‘Bioavailable’ testosterone (BAT).Clinical Biochemistry200336591 – 596.
33 Edwards P & Ekins R. The ‘Pardridge’ hypotheses relating to the role of hormone binding proteins in hormone delivery: a critique.
Steroids198852367 – 368.
34 Pardridge WM. Serum bioavailability of sex steroid hormones.
Clinics in Endocrinology & Metabolism198615259 – 278. 35 Pardridge WM. Plasma protein-mediated transport of steroid and
thyroid hormones.American Journal of Physiology Endocrinology and Metabolism1987252E157 – E164.
36 Ekins R. Analytic measurements of free thyroxine. Clinics in Laboratory Medicine199313599 – 630.
37 Rosner W, Hryb DJ, Khan MS, Nakhla a M & Romas NA. Androgen and estrogen signaling at the cell membrane via G-proteins and cyclic adenosine monophosphate.Steroids 1999
64100 – 106.
38 Reventos J, Sullivan PM, Joseph DR & Gordon JW. Tissue-specific expression of the rat androgen-binding protein/sex hormone-binding globulin gene in transgenic mice.Molecular and Cellular Endocrinology19939669 – 73.
39 Wilke TJ & Utley DJ. Total testosterone, free-androgen index, calculated free testosterone, and free testosterone by analog RIA compared in hirsute women and in otherwise-normal women with altered binding of sex-hormone-binding globulin. Clinical Chemistry1987331372 – 1375.
40 Rosner W. Errors in the measurement of plasma free testosterone.
Journal of Clinical Endocrinology & Metabolism 1997 82
2014 – 2015.
Received 23 September 2004 Accepted 9 November 2004