Exploiting Process Lifetime Distributions
for Dynamic Load Balancing
MOR HARCHOL-BALTER and ALLEN B. DOWNEY University of California, Berkeley
We consider policies for CPU load balancing in networks of workstations. We address the question of whether preemptive migration (migrating active processes) is necessary, or whether remote execution (migrating processes only at the time of birth) is sufficient for load balancing. We show that resolving this issue is strongly tied to understanding the process lifetime distribution. Our measurements indicate that the distribution of lifetimes for a UNIX process is Pareto (heavy-tailed), with a consistent functional form over a variety of workloads. We show how to apply this distribution to derive a preemptive migration policy that requires no hand-tuned parameters. We used a trace-driven simulation to show that our preemptive migration strategy is far more effective than remote execution, even when the memory transfer cost is high.
Categories and Subject Descriptors: C.2.4 [Computer-Communication Networks]: Distrib-uted Systems; C.4 [Computer Systems Organization]: Performance of Systems; C.5.3 [Computer System Implementation]: Microcomputers; G.3 [Mathematics of Comput-ing]: Probability and Statistics; G.m [Mathematics of ComputComput-ing]: Miscellaneous; I.6 [Computing Methodologies]: Simulation and Modeling
General Terms: Algorithms, Design, Performance, Measurement
Additional Key Words and Phrases: Heavy-tailed, load balancing, load sharing, migration, network of workstations, Pareto distribution, remote execution, trace-driven simulation, workload modeling
1. INTRODUCTION
Most systems that perform load balancing use remote execution (i.e., nonpreemptive migration) based on a priori knowledge of process behavior, often in the form of a list of process names eligible for migration. Although
M. Harchol-Balter is supported by National Physical Science Consortium (NPSC) Fellowship and NSF grant number CCR-9201092. A. B. Downey is partially supported by NSF (DARA) grant DMW-8919074.
An earlier version of this article appeared in the Proceedings of the ACM Sigmetrics
Conference on Measurement and Modeling of Computer Systems (May 23–26, 1996), 13–24.
Authors’ addresses: University of California, Berkeley, CA 94720; email: {harchol; downey}@ cs.berkeley.edu.
Permission to make digital / hard copy of part or all of this work for personal or classroom use is granted without fee provided that the copies are not made or distributed for profit or commercial advantage, the copyright notice, the title of the publication, and its date appear, and notice is given that copying is by permission of the ACM, Inc. To copy otherwise, to republish, to post on servers, or to redistribute to lists, requires prior specific permission and / or a fee.
some systems are capable of migrating active processes, most do so only for reasons other than load balancing, such as preserving autonomy. A previ-ous analytic study by Eager et al. [1988] discourages implementing pre-emptive migration for load balancing, showing that the additional perfor-mance benefit of preemptive migration is small compared to the benefit of simple nonpreemptive migration schemes. But simulation studies, which can use more realistic workload descriptions, and implemented systems have shown greater benefits for preemptive migration [Barak et al. 1993; Krueger and Livny 1988]. This article uses a measured distribution of process lifetimes and a trace-driven simulation to investigate these conflict-ing results.
1.1 Load-Balancing Taxonomy
On a network of shared processors, CPU load balancing is the idea of migrating processes across the network from hosts with high loads to hosts with lower loads. The motivation for load balancing is to reduce the average completion time of processes and improve the utilization of the processors. Analytic models and simulation studies have demonstrated the perfor-mance benefits of load balancing, and these results have been confirmed in existing distributed systems (see Section 1.4).
An important part of the load-balancing strategy is the migration policy, which determines when migrations occur and which processes are mi-grated. This is the question we address in this article. The other half of a load-balancing strategy is the location policy—the selection of a new host for the migrated process. Previous work has suggested that simply choosing the target host with the shortest CPU run queue is both simple and effective [Kunz 1991; Zhou 1987]. Our work confirms the relative unimpor-tance of location policy.
Process migration for purposes of load balancing comes in two forms:
remote execution, also called nonpreemptive migration, in which some new
processes are (possibly automatically) executed on remote hosts, and
pre-emptive migration, in which running processes may be suspended, moved to
a remote host, and restarted. In nonpreemptive migration only newborn processes are migrated.
Load balancing may be done explicitly (by the user) or implicitly (by the system). Implicit migration policies may or may not use a priori informa-tion about the funcinforma-tion of processes, how long they will run, etc.
Since the cost of remote execution is usually significant relative to the average lifetime of processes, implicit nonpreemptive policies require some a priori information about job lifetimes. This information is often imple-mented as an eligibility list that specifies by process name which processes are worth migrating [Svensson 1990; Zhou et al. 1993].
In contrast, most preemptive migration policies do not use a priori information, since this is often difficult to maintain, and preemptive strategies can perform well without it. These systems use only system-visible data like the current age of each process or its memory size.
This article examines the performance benefits of preemptive, implicit load-balancing strategies that assume no a priori information about processes.
We answer the following questions:
(1) Is preemptive migration worthwhile, given the additional cost (CPU and latency) associated with migrating an active process?
(2) Which active processes, if any, are worth migrating? 1.2 Process Model
In our model, processes use two resources: CPU and memory (we do not consider I/O). Thus, we use “age” to mean CPU age (the CPU time a process has used thus far) and “lifetime” to mean CPU lifetime (the total CPU time from start to completion). We assume that processors implement time-sharing with round-robin scheduling; in Section 7 we discuss the effect of other local scheduling policies. Since processes may be delayed while on the run queue or while migrating, the slowdown imposed on a process is
Slowdown of process p5 wall-time~p!
CPU-time~p!,
where wall time is the total time a process spends running, waiting in queue, or migrating.
1.3 Outline
The effectiveness of load balancing— either by remote execution or preemp-tive migration— depends strongly on the nature of the workload, including the distribution of process lifetimes and the arrival process. This article presents empirical observations about the workload on a network of UNIX workstations and uses a trace-driven simulation to evaluate the impact of this workload on proposed load-balancing strategies.
Section 2 presents a study of the distribution of process lifetimes for a variety of workloads in an academic environment, including instructional machines, research machines, and machines used for system administra-tion. We find that the distribution is predictable with goodness of fit greater than 99% and consistent across a variety of machines and work-loads. As a rule of thumb, the probability that a process with CPU age of one second uses more than T seconds of total CPU time is 1/T (see Figure 1).
Our measurements are consistent with those of Leland and Ott [1986], but their prior work has been incorporated in few subsequent analytic and simulator studies of load balancing. This omission is unfortunate, since the results of these are sensitive to the lifetime model (see Section 2.2).
Our observations of lifetime distributions have the following conse-quences for load balancing:
—They suggest that it is preferable to migrate older processes because these processes have a higher probability of living long enough (eventu-ally using enough CPU) to amortize their migration cost.
—A functional model of the distribution provides an analytic tool for deriving the eligibility of a process for migration as a function of its current age, migration cost, and the loads at its source and target host. In Section 3 we derive a migration eligibility criterion that guarantees that the slowdown imposed on a migrant process is lower in expectation
Fig. 1. (a) distribution of lifetimes for processes with lifetimes greater than 1 second, observed on machine po mid-semester; the dotted (thicker) line shows the measured distribu-tion; the solid (thinner) line shows the least-squares curve fit; (b) the same distribution on a log-log scale; the straight line in log-log space indicates that the distribution can be modeled by Tk, where k is the slope of the line.
than it would be without migration. According to this criterion, a process is eligible for migration only if its
CPU age. 1
n2mzmigration cost,
where n (respectively, m) is the number of processes at the source (target) host.
In Section 5 we use a trace-driven simulation to compare our preemptive migration policy with a nonpreemptive policy based on name-lists. The simulator uses start times and durations from traces of a real system, and migration costs chosen from a measured distribution.
We use the simulator to run three experiments: first we evaluate the effect of migration cost on the relative performance of the two strategies. Not surprisingly, we find that as the cost of preemptive migration in-creases, it becomes less effective. Nevertheless, preemptive migration per-forms better than nonpreemptive migration even with surprisingly large migration costs, despite several conservative assumptions that give nonpre-emptive migration an unfair advantage.
Next we choose a specific model of preemptive and nonpreemptive migration costs based on real systems (see Section 4) and use this model to compare the two migration strategies in more detail. We find that preemp-tive migration reduces the mean delay (queuing and migration) by 35–50%, compared to nonpreemptive migration. We also propose several alternative metrics intended to measure users’ perception of system performance. By these metrics, the additional benefits of preemptive migration compared to nonpreemptive migration appear even more significant.
In Section 5.4 we discuss in detail why a simple preemptive migration policy is more effective than even a well-tuned nonpreemptive migration policy. In Section 5.5 we use the simulator to compare our preemptive migration strategy with previously proposed preemptive strategies.
We finish with a criticism of our model in Section 6, a discussion of future work in Section 7, and conclusions in Section 8.
1.4 Related Work
1.4.1 Systems. Although several systems have the mechanism to mi-grate active jobs, few have implemented implicit load-balancing policies. Most systems only allow for explicit load balancing. That is, there is no load-balancing policy; the user decides which processes to migrate and when. Examples include Accent [Zayas 1987], Locus [Thiel 1991], Utopia [Zhou et al. 1993], DEMOS/MP [Powell and Miller 1983], V [Theimer et al. 1985], NEST [Agrawal and Ezzet 1987], RHODOS [De Paoli and Goscinski 1995], and MIST [Casas et al. 1995].
A few systems have implicit load-balancing policies; however, they are strictly nonpreemptive policies (active processes are only migrated for purposes other than load balancing, such as preserving workstation
auton-omy). Examples include Amoeba [Tanenbaum et al. 1990], Charlotte [Artsy and Finkel 1989], Sprite [Douglis and Ousterhout 1991], Condor [Litzkow et al. 1988], and Mach [Milojicic 1993]. In general, nonpreemptive load-balancing policies depend on a priori information about processes, e.g., explicit knowledge about the run-times of processes or user-provided lists of migratable processes [Agrawal and Ezzet 1987; Douglis and Ousterhout 1991; Litzkow and Livny 1990; Zhou et al. 1993].
One existing system that has implemented automated preemptive load balancing is MOSIX [Barak et al. 1993]. Our results support the MOSIX claim that their scheme is effective and robust.
1.4.2 Studies. Although few systems incorporate migration policies, there have been many simulation and analytical studies of various migra-tion policies. Most of these studies have focused on load balancing by remote execution.1
Only a few studies address preemptive migration policies [Krueger and Livny 1988; Leland and Ott 1986]. The Leland and Ott migration policy is also age based, but does not take migration cost into account.
Eager et al. [1988] conclude that the additional performance benefit of preemptive migration is too small compared to the benefit of nonpreemp-tive migration to make preempnonpreemp-tive migration worthwhile. This result has been widely cited and in several cases has been used to justify the decision not to implement preemptive migration, as in the Utopia system [Zhou et al. 1993]. Our work differs from Eager et al. [1988] in both system model and workload description. Eager et al. [1988] model a server farm in which incoming jobs have no affinity for a particular processor, and thus the cost of initial placement (remote execution) is free. This is different from our model, a network of workstations, in which incoming jobs arrive at a particular host, and the cost of moving them away, even by remote execution, is significant compared to most process lifetimes. Also, Eager et al. [1988] use a degenerate hyperexponential distribution of lifetimes that includes few jobs with nonzero lifetimes. When the coefficient of variation of this distribution matches the distributions we observed, fewer than 4% of the simulated processes have nonzero lifetimes. With so few jobs (and balanced initial placement) there is seldom any load imbalance in the system and thus little benefit for preemptive migration. Furthermore, the Eager et al. [1988] process lifetime distribution is exponential for jobs with nonzero lifetimes, the consequences of which we discuss in Section 2.2. For a more detailed explanation of this distribution and its effect on the study, see Downey and Harchol-Balter [1995].
Krueger and Livny [1988] investigate the benefits of supplementing nonpreemptive migration with preemptive migration and find that preemp-tive migration is worthwhile. They use a hyperexponential lifetime distri-1Livny and Melman [1982], Wang and Morris [1985], Casavant and Kuhl [1987], Zhou [1987],
Pulidas et al. [1988], Kunz [1991], Bonomi and Kumar [1990], Evans and Butt [1993], Lin and Raghavendra [1993], Mirchandaney et al. [1990], Zhang et al. [1995], Zhou and Ferrari [1987], Hac´ and Jin [1990], and Eager et al. [1986].
bution that approximates closely the distribution we observed; as a result, their findings are largely in accord with ours. One difference between their work and ours is that they used a synthetic workload with Poisson arrivals. The workload we observed, and used in our trace-driven simulations, exhibits serial correlation; that is, it is more bursty than a Poisson process. Another difference is that their migration policy requires several hand-tuned parameters. In Section 3.1 we show how to use the distribution of lifetimes to eliminate these parameters.
Similarly as we have done, Bryant and Finkel [1981] discuss the distri-bution of process lifetimes and its effect on preemptive migration policy, but their hypothetical distributions are not based on system measure-ments. Also as we do, they choose migrant processes on the basis of expected slowdown on the source and target hosts, but their estimation of those slowdowns is very different from ours. In particular, they use the distribution of process lifetimes to predict a host’s future load as a function of its current load and the ages of the processes running there. We have examined this issue and found (1) that this model fails to predict future loads because it ignores future arrivals, and (2) that current load is the best predictor of future load (see Section 3.1). Thus, in our estimates of slow-down, we assume that the future load on a host is equal to the current load.
2. DISTRIBUTION OF LIFETIMES
The general shape of the distribution of process lifetimes in an academic environment has been known for a long time [Rosin 1965]: there are many short jobs and a few long jobs, and the variance of the distribution is greater than that of an exponential distribution.
In 1986, Cabrera measured UNIX processes and found that over 40% doubled their current age [Cabrera 1986]. That same year, Leland and Ott [1986] proposed a functional form for the process lifetime distribution, based on measurements of the lifetimes of 9.5 million UNIX processes between 1984 and 1985. They conclude that process lifetimes have a UBNE (used-better-than-new-in-expectation) type of distribution. That is, the greater the current CPU age of a process, the greater its expected remain-ing CPU lifetime. Specifically, they find that for T . 3 seconds, the probability of a process’s lifetime exceeding T seconds is rTk, where
21.25 ,k , 21.05 and where r normalizes the distribution.
In contrast, Rommel [1991] claims that his measurements show that “long processes have exponential service times.” Many subsequent studies assume an exponential lifetime distribution.
Because of the importance of the process lifetime distribution for load-balancing policies, we performed an independent study of this distribution and found that the functional form proposed by Leland and Ott fits the observed distributions well, for processes with lifetimes greater than 1 second. This functional form is consistent across a variety of machines and workloads, and although the parameter k varies from 21.3 to 20.8, it is generally near 21. Thus, as a rule of thumb,
—the probability that a process with age 1 second uses at least T seconds of total CPU time is about 1/T;
—the probability that a process with age T seconds uses at least an additional T seconds of CPU time is about 1/2—thus, the median remain-ing lifetime of a process is equal to its current age.
Section 2.1 describes our measurements and the distribution of lifetimes we observed. Section 2.2 discusses other models for the distribution of lifetimes and argues that the particular shape of this distribution is critical for evaluating migration policies.
2.1 Lifetime Distribution when Lifetime is Greater than 1 Second
To determine the distribution of lifetimes for UNIX processes, we measured the lifetimes of over one million processes, generated from a variety of academic workloads, including instructional machines, research machines, and machines used for system administration. We obtained our data using the UNIX command lastcomm, which outputs the CPU time used by each completed process.
Figure 1 shows the distribution of lifetimes from one of the machines. The plot shows only processes whose lifetimes exceed one second. The dotted (heavy) line shows the measured distribution; the solid (thinner) line shows the least-squares fit to the data using the proposed functional form Pr{Lifetime . T} 5 Tk.
By visual inspection, it is clear that the proposed model fits the observed data well. In contrast, Figure 2 shows that it is impossible to find an exponential curve that fits the distribution of lifetimes we observed.
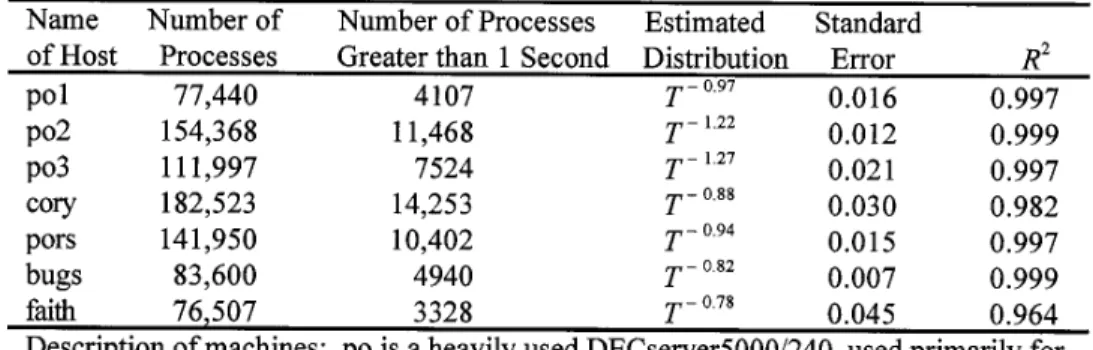
For all the machines we studied, the distribution of process lifetimes fits a curve of the form Tk, with k varying from 21.3 to 20.8 for different machines. Table I shows the value of the parameter for each machine we studied, estimated by an iteratively weighted least-squares fit (with no intercept, in accordance with the functional model). We calculated these estimates with the BLSS command robust [Abrahams and Rizzardi 1988].
The standard error associated with each estimate gives a confidence interval for that parameter (all of these parameters are statistically signif-icant at a high degree of certainty). The R2 value indicates the goodness of fit of the model—the values shown here indicate that the fitted curve accounts for greater than 99% of the variation of the observed values. Thus the goodness of fit of these models is high (for an explanation of R2 values, see Larsen and Marx [1986]).
Table II shows the cumulative distribution function, probability density function, and conditional distribution function for process lifetimes. The second column shows these functions when k 5 21, which we assume for our analysis in Section 3.
The functional form we are proposing (the fitted distribution) has the property that its moments (mean, variance, etc.) are infinite. Of course, since the observed distributions have finite sample size, they have finite mean (0.4 seconds) and coefficient of variation (5–7). One must be cautious
when summarizing long-tailed distributions though, because calculated moments tend to be dominated by a few outliers. In our analyses we use more robust summary statistics (order statistics like the median, or the estimated parameter k) to summarize distributions, rather than moments.
Fig. 2. In log-log space, this plot shows the distribution of lifetimes for the 13,000 processes from our traces with lifetimes greater than 1 second, and two attempts to fit a curve to these data. One of the fits is based on the model proposed in this article, Tk. The other fit is an exponential curve, cz e2lT. Although the exponential curve is given the benefit of an extra free parameter, it fails to model the observed data. The proposed model fits well. Both fits were performed by iteratively weighted least squares.
Table I. Estimated Lifetime Distribution for Each Machine Measured and Associated Goodness-of-Fit Statistics
2.1.1 Processes with Lifetime Less than 1 Second. For processes with lifetimes less than 1 second, we did not find a consistent functional form; however, for the machines we studied these processes had an even lower hazard rate than those of age . 1 second. That is, the probability that a process of age T ,1 seconds lives another T seconds is always greater than 1/2. Thus for jobs with lifetimes less than 1 second, the median remaining lifetime is greater than the current age.
2.2 Why the Distribution Is Critical
Many prior studies of process migration assume an exponential distribu-tion of process lifetimes, both in analytical papers2 and in simulation studies.3 The reasons for this assumption include (1) analytic tractability and (2) the belief that even if the actual lifetime distribution is in fact not exponential, assuming an exponential distribution will not affect the re-sults of load-balancing studies.
Regarding the first point, although the functional form that we and Leland and Ott propose cannot be used in queuing models as easily as an exponential distribution, it nevertheless lends itself to some forms of analysis, as we show in Section 3.1.
Regarding the second point, we argue that the particular shape of the lifetime distribution affects the performance of migration policies and therefore that it is important to model this distribution accurately. Specif-ically, the choice of a migration policy depends on how the expected remaining lifetime of a job varies with age. In our observations we found a distribution with the UBNE property: the expected remaining lifetime of a job increases linearly with age. As a result, we chose a migration policy that migrates only old jobs.
But different distributions yield different relationships between the age of a process and its remaining lifetime. For example, a uniform distribution has the NBUE property: the expected remaining lifetime decreases linearly with age. Thus if the distribution of lifetimes were uniform, the migration policy should choose to migrate only young processes. In this case, we
2Lin and Raghavendra [1993], Mirchandaney et al. [1990], Eager et al. [1986], and Ahmad et
al. [1991].
3Kunz [1991], Pulidas et al. [1988], Wang and Morris [1985], Evans and Butt [1993], Livny
and Melman [1982], Zhang et al. [1995], and Chowdhury [1990].
Table II. Cumulative Distribution Function, Probability Density Function, and Conditional Distribution Function for the Process Lifetime L
expect nonpreemptive migration to perform better than preemptive migra-tion.
As another example, the exponential distribution is memoryless: the remaining lifetime of a job is independent of its age. In this case, since all processes have the same expected lifetimes, the migration policy might choose to migrate the process with the lowest migration cost, regardless of age.
As a final example, processes whose lifetimes are chosen from a uniform log distribution (a uniform distribution in log-space) have a remaining lifetime that increases up to a point and then begins to decrease. In this case, the best migration policy might be to migrate jobs that are old enough, but not too old.
Thus different distributions, even with the same mean and variance, can lead to different migration policies. In order to evaluate a proposed policy, it is critical to choose a distribution model with the appropriate relation-ship between expected remaining lifetime and age.
Some studies have used hyperexponential distributions to model the distribution of lifetimes. These distributions may or may not have the right behavior, depending on how accurately they fit observed distributions. Krueger and Livny [1988] use a three-stage hyperexponential with param-eters estimated to fit observed values. This distribution has the appropriate UBNE property. But the two-stage hyperexponential distribution Eager et al. [1988] use is memoryless; the remaining lifetime of a job is independent of its age (for jobs with nonzero lifetimes). According to this distribution, migration policy is irrelevant; all processes are equally good candidates for migration. This result is clearly in conflict with our observations.
Assuming the wrong lifetime distribution may also underestimate the benefits of preemptive migration. The heavy tail of our measured lifetime distribution implies that a tiny fraction of the jobs require more CPU than all the other jobs combined. As we discuss in Section 5.4, part of the power of preemptive migration is its ability to identify those few hogs. In a lifetime distribution without such a heavy tail, preemptive migration might not be as effective.
3. MIGRATION POLICY
A migration policy is based on two decisions: when to migrate processes and which processes to migrate. The first question concerns how often or at what times the system checks for eligible migrants. We address this issue briefly in Section 5.1.1. The focus of this article is the second question, also known as the selection policy:
—Given that the load at a host is too high, how do we choose which process to migrate?
Our heuristic is to migrate processes that are expected to have long remaining lifetimes. The motivation for this heuristic is twofold. From the process’s perspective, migration time has a large impact on response time.
A process would choose to migrate only if the migration overhead could be amortized over a longer lifetime. From the perspective of the source host, it takes a significant amount of work to package a process for migration. The host would only choose to migrate processes that are likely to be more expensive to run than to migrate.
Many existing migration policies only migrate newborn processes (no preemption), because these processes have no allocated memory, and thus their migration cost is low. The idea of migrating newborn processes might also stem from the fallacy that process lifetimes have an exponential distribution, implying that all processes have equal expected remaining lifetimes regardless of their age, so one should migrate the cheapest processes. The problem with only migrating newborn processes is that, according to the process lifetime distribution, newborn processes are un-likely to live long enough to justify the cost of remote execution. In fact, our measurements show that over 70% of processes have lifetimes smaller than the smallest nonpreemptive migration cost (see Table III).
Thus a newborn migration policy is only justified if the system has prior knowledge about processes and can selectively migrate processes likely to be CPU hogs. We have found, though, that the ability of the system to predict process lifetimes by name is limited (Section 5.4).
Can we do better? The distribution of lifetimes implies that we expect an old process to run longer than a young process; thus it is preferable to migrate old processes.
There are two potential problems with this approach. First, since the vast majority of processes are short, there might not be enough old processes to have a significant load-balancing effect. In fact, although there are few long-lived processes, they account for a large part of the total CPU load. According to our measurements, typically fewer than 4% of processes live longer than two seconds, yet these processes make up more than 60% of the total CPU load. This is due to the long tail of the process lifetime distribution. Furthermore, we show that the ability to migrate even a few
large jobs can have a large effect on system performance, since a single long process on a busy host imposes slowdowns on many short processes.
A second problem with migrating old processes is that the migration cost for an active process is much greater than the cost of remote execution. If preemptive migration is done carelessly, this additional cost might over-whelm the benefit of migrating processes with longer expected lives. 3.1 Our Migration Policy
For this reason, we propose a strategy that guarantees that every migra-tion improves the expected performance of the migrant process and the other processes at the source host. This strategy migrates a process only if
it improves the expected slowdown of the process, where slowdown is defined
as in Section 1.2. Of course, processes on the target host are slowed by an arriving migrant, but on a moderately loaded system there are almost always idle hosts; thus the number of processes at the target host is usually zero. In any case, the number of processes at the target is always less than the number at the source.
If there is no process on the host that satisfies the preceding migration criterion, no migration is done. If migration costs are high, few processes will be eligible for migration; in the extreme there will be no migration at all. But in no case is the performance of the system worse (in expectation) than the performance without migration.
Using the distribution of process lifetimes, we calculate the expected slowdown imposed on a migrant process and use this result to derive a minimum age for migration based on the cost of migration. Denoting the age of the migrant process by a, the cost of migration by c, the (eventual total) lifetime of the migrant by L, the number of processes at the source host by n, and the number of processes at the target host (including the migrant) by m, we have E$slowdown of migrant% 5
Et
5a ` PrH
Lifetime of migrant is tJ
zH
Slowdown given lifetime is tJ
dt 5Et
5a ` Pr$t#L,t1dtuL$a%zna1c1m~t2a! t 5Et
5a ` a t2z na1c1m~t2a! t dt 51 2S
c a1m1nD
.If there are n processes at a heavily loaded host, then a process should be eligible for migration only if its expected slowdown after migration is less than n (which is the slowdown it expects in the absence of migration).
Thus, we require (1/2) ((c/a) 1 m 1 n) , n, which implies
Minimum migration age5Migration cost
n2m .
We can extend this analysis to the case of heterogeneous processor speeds by applying a scale factor to n or m.
This analysis assumes that current load predicts future load, that is, that the load at the source and target hosts will be constant during the migration. In an attempt to evaluate this assumption, and possibly improve it, we considered a number of alternative load predictors, including (1) taking a load average (over an interval of time), (2) summing the ages of the processes running on the host, and (3) calculating a prediction of survivors and future arrivals based on the distribution model proposed here. We found that current (instantaneous) load is the best single predic-tor and that using several predictive variables in combination did not greatly improve the accuracy of prediction. These results are in accord with Zhou [1987] and Kunz [1991].
3.2 Prior Preemptive Policies
Only a few preemptive strategies have been implemented in real systems or proposed in prior studies. The three that we have found are, like ours, based on the principle that a process should be migrated if it is old enough. In many cases, the definition of “old enough” depends on a “voodoo” constant4: a free parameter whose value is chosen without explanation and that would need to be retuned for a different system or another workload.
Under Leland and Ott’s policy, a process p is eligible for migration if age~p!.ages of k younger jobs at host,
where k is a free parameter called MINCRIT [Leland and Ott 1986]. Krueger and Livny’s policy, like ours, takes the job’s migration cost into account. A process p is eligible for migration if
age~p!.0.1 p migration cost~p!,
but they do not explain how they chose the value 0.1 [Krueger and Livny 1988].
The MOSIX policy is similar [Barak et al. 1993]; a process is eligible for migration if
age~p!.1.0 p migration cost~p!.
The choice of the constant (1.0) in the MOSIX policy ensures that the slowdown of a migrant process is never more than 2, since in the worst case the migrant completes immediately upon arrival at the target.
Despite this justification, the choice of the maximum slowdown (2) is arbitrary. We expect the MOSIX policy to be too restrictive, for two reasons: it ignores the slowdown that would be imposed at the source host in the absence of migration (presumably there is more than one process there, or the system would not be attempting to migrate processes away), and it is based on the worst-case slowdown rather than the expected slowdown. In Section 5.5, we show that the best choice for this parameter, for our workload, is usually near 0.4, but it depends on load.
4. MODEL OF MIGRATION COSTS
Migration cost has such a large effect on the performance of preemptive load balancing; this section presents the model of migration costs we use in our simulation studies.
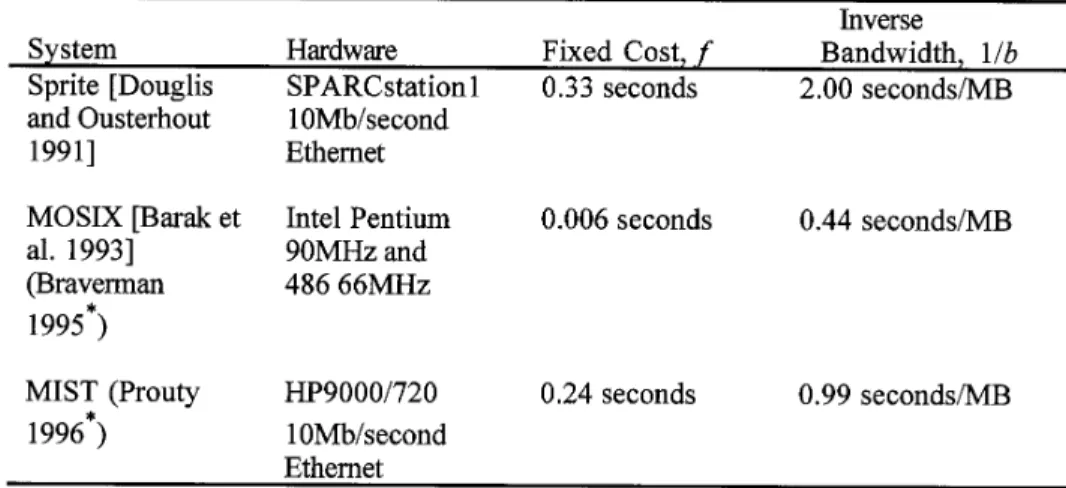
We model the cost of migrating an active process as the sum of a fixed
migration cost for migrating the process’s system state and a memory transfer cost that is proportional to the amount of the process’ memory that
must be transferred.
We model remote execution cost as a fixed cost; it is the same for all processes. The cost of remote execution includes sending the command and arguments to the remote host, logging in or otherwise authenticating the process, and creating a new shell and environment on the remote host.
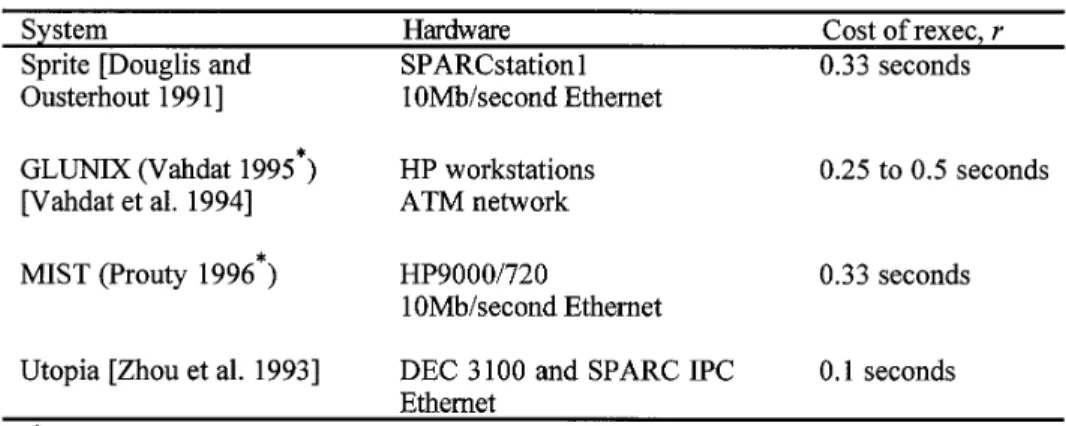
Throughout this article, we use the following notation: —r: the cost of remote execution, in seconds,
—f: the fixed cost of preemptive migration, in seconds, —b: the memory transfer bandwidth, in MB per second, —m: the memory size of migrant processes, in MB. And thus we get
cost of remote execution 5r
cost of preemptive migration 5f1m/b,
where the quotient m/b is the memory transfer cost. 4.1 Memory Transfer Costs
The amount of a process’ memory that must be transferred during preemp-tive migration depends on properties of the distributed system. Douglis and Ousterhout [1991] have an excellent discussion of this issue, and we borrow from them here.
At the most, it might be necessary to transfer a process’ entire memory. On a system like Sprite, which integrates virtual memory with a distrib-uted file system, it is only necessary to write dirty pages to the file system
before migration. When the process is restarted at the target host, it will retrieve these pages. In this case the cost of migration is proportional to the size of the resident set rather than the size of memory.
In systems that use precopying, such as V [Theimer et al. 1985], pages are transferred while the program continues to run at the source host. When the job stops execution at the source, it will have to transfer again any pages that have become dirty during the precopy. Although the number of pages transferred might be increased, the delay imposed on the migrant process is greatly decreased. Additional techniques can reduce the cost of transferring memory even more [Zayas 1987].
4.2 Migration Costs in Real Systems
The specific parameters of migration cost depend not only on the nature of the system (as previously discussed) but also on the speed of the network. Tables III and IV show reported costs from a variety of real systems. Later we use a trace-driven simulator to evaluate the effect of these parameters on system performance. We make the pessimistic simplification that a migrant’s entire memory must be transferred, although, as pointed out, this is not necessarily the case.
5. TRACE-DRIVEN SIMULATION
In this section we present the results of a trace-driven simulation of process migration. We compare two migration strategies: our proposed age-based preemptive migration strategy (Section 3.1) and a nonpreemptive strategy that migrates newborn processes according to the process name (similar to strategies proposed by Wang et al. [1993] and Svensson [1990]). With the intention of finding a conservative estimate of the benefit of preemptive
migration, we give the name-based strategy the benefit of several unrealis-tic advantages; for example, the name-lists are derived from the same trace data used by the simulator.
Section 5.1 describes the simulator and the two strategies in more detail. We use the simulator to run three experiments. First, in Section 5.2, we evaluate the sensitivity of each strategy to the migration costs r, f, b, and
m discussed in Section 4. Next, in Section 5.3, we choose values for these
parameters that are representative of current systems and compare the performance of the two strategies in detail. In Section 5.4 we discuss why the preemptive policy outperforms the nonpreemptive policy. Last, in Section 5.5, we evaluate the analytic criterion for migration age proposed in Section 3.1, compared to criteria used in previous studies.
5.1 The Simulator
We have implemented a trace-driven simulation of a network of six identical workstations.5 We selected six daytime intervals from the traces on machine po (see Section 2.1), each from 9:00 a.m. to 5:00 p.m. From the six traces we extracted the start times and CPU durations of the processes. We then simulated a network where each of six hosts executes (concurrent-ly with the others) the process arrivals from one of the daytime traces.
Although the workloads on the six hosts are homogeneous in terms of the job mix and distribution of lifetimes, there is considerable variation in the level of activity during the eight-hour trace. For most of the traces, every arriving process finds at least one idle host in the system, but in the two busiest traces, a small fraction of processes (0.1%) arrives to find all hosts busy. In order to evaluate the effect of changes in system load, we divided the eight-hour trace into eight one-hour intervals. We refer to these as runs 0 through 7, where the runs are sorted from lowest to highest load. Run 0 has a total of 15,000 processes submitted to the 6 simulated hosts; Run 7 has 30,000 processes. The average duration of processes (for all runs) is 0.4 seconds. Thus the total utilization of the system, r, is between 0.27 and 0.54.
The birth process of jobs at our hosts is burstier than a Poisson process. For a given run and a given host, the serial correlation in interarrival times is typically between 0.08 and 0.24, which is significantly higher than one would expect from a Poisson process (uncorrelated interarrival times yield a serial correlation of 0.0; perfect correlation is 1.0).
Although the start times and durations of the processes come from trace data, the memory size of each process, which determines its migration cost, is chosen randomly from a measured distribution (see Section 5.2). This simplification obliterates any correlations between memory size and other process characteristics, but it allows us to control the mean memory size as a parameter and examine its effect on system performance.
5The trace-driven simulator and the trace data are available at http://http.cs.berkeley.edu/
In our system model, we assume that processes are always ready to run, i.e., they are never blocked on I/O. During a given time interval, we divide CPU time equally among the processes on the host (processor sharing).
In real systems, part of the migration time is spent on the source host packaging the transferred pages, part in transit in the network, and part on the target host unpacking the data. The size of these parts and whether they can be overlapped depend on details of the system. In our simulation we charge the entire cost of migration to the source host. This simplifica-tion is conservative in the sense that it makes preemptive migrasimplifica-tion less effective.
5.1.1 Strategies. We compare the preemptive migration strategy pro-posed in Section 3.1 with a nonpreemptive migration strategy, where the nonpreemptive strategy is given unfair advantages. For purposes of com-parison, we have tried to make the policies as simple and as similar as possible. For both types of migration, we consider performing a migration only when a new process is born, even though a preemptive strategy might benefit by initiating migrations at other times. Also, for both strategies, a host is considered heavily loaded any time it contains more than one process: in other words, any time it would be sensible to consider migra-tion. Finally, we use the same location policy in both cases: the host with the lowest instantaneous load is chosen as the target host (ties are broken by random selection). Thus the only difference between the two migration policies is which processes are considered eligible for migration:
Name-Based Nonpreemptive Migration. A process is eligible for migra-tion only if its name is on a list of processes that tend to be long-lived. If an eligible process is born at a heavily loaded host, the process is executed remotely on the selected host. Processes cannot be migrated once they have begun execution.
The performance of this strategy depends on the list of eligible process names. We derived this list by sorting the processes from the traces according to name and duration and selecting the 15 common names with the longest mean durations. We chose a threshold on mean duration that is empirically optimal (for this set of runs). Adding more names to the list detracts from the performance of the system, as it allows more short-lived processes to be migrated. Removing names from the list detracts from performance, as it becomes impossible to migrate enough processes to balance the load effectively. Since we used the trace data to construct the list, our results may overestimate the performance benefits of this strategy.
Age-Based Preemptive Migration. A process is eligible for migration only if it has aged for some fraction of its migration cost. Based on the derivation in Section 3.1, this fraction is 1/(n2 m), where n (respectively, m) is the number of processes at the source (target) host. When a new
process is born at a heavily loaded host, all processes that satisfy the migration criterion are migrated away.
This strategy understates the performance benefits of preemptive migra-tion, because it does not allow the system to initiate migrations except when a new process arrives.
As described in Section 3.1, we also modeled other location policies based on more complicated predictors of future loads, but none of these predictors yielded significantly better performance than the instantaneous load we use here.
We also considered the effect of allowing preemptive migration at times other than when a new process arrives. Ideally, one would like to initiate a migration whenever a process becomes eligible (since the eligibility crite-rion guarantees that the performance of the migrant will improve in expectation). One of the strategies we considered performs periodic checks of each process on a heavily loaded host to see if any satisfy the criterion. The performance of this strategy is significantly better than that of the simpler policy (migrating only at process arrival times).
5.1.2 Metrics. We evaluate the effectiveness of each strategy according to the following performance metrics.
Mean Slowdown. Slowdown is the ratio of wall-clock execution time to CPU time (thus it is always greater than 1). The average slowdown of all jobs is a common metric of system performance. When we compute the ratio of mean slowdowns (as from different strategies) we use normalized slow-down, which is the ratio of inactive time (the excess slowdown caused by queuing and migration delays) to CPU time. For example, if the (unnormal-ized) mean slowdown drops from 2.0 to 1.5, the ratio of normalized mean slowdowns is 0.5/1.05 0.5: a 50% reduction in delay.
Mean slowdown alone is not a sufficient measure of the difference in performance of the two strategies; it understates the advantages of the preemptive strategy for these two reasons:
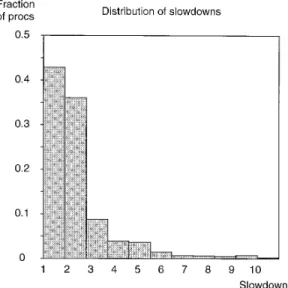
—Skewed Distribution of Slowdowns: Even in the absence of migration, the majority of processes suffer small slowdowns (typically 80% are less than 3.0; see Figure 3). The value of the mean slowdown is dominated by this majority.
—User Perception: From the user’s point of view, the important processes are the ones in the tail of the distribution, because although they are the minority they cause the most noticeable and annoying delays. Eliminat-ing these delays might have a small effect on the mean slowdown, but a large effect on a user’s perception of performance.
Therefore, we also consider the following three metrics.
Variance of Slowdown. This metric is often cited as a measure of the unpredictability of response time [Silberschatz et al. 1994], which is a nuisance for users trying to schedule tasks. In light of the distribution of slowdowns, however, it may be more meaningful to interpret this metric as
a measure of the length of the tail of the distribution, i.e., the number of jobs that experience long delays (see Figure 5(b)).
Number of Severely Slowed Processes. In order to quantify the number of noticeable delays explicitly, we consider the number (or percentage) of processes that are severely affected by queuing and migration penalties (see Figures 5(c) and (d)).
Mean Slowdown of Long Jobs. Delays in longer jobs (those with life-times greater than 0.5 seconds) are more perceivable to users than delays in short jobs (see Figure 6).
5.2 Sensitivity to Migration Costs
In this section we compare the performance of the nonpreemptive and preemptive strategies over a range of values of r, f, b, and m (the migration cost parameters defined in Section 4).
For the following experiments, we chose the remote execution cost r 5 0.3 seconds. We considered a range for the fixed migration cost of 0.1 ,
f , 10 seconds.
The memory transfer cost is the quotient of m (the memory size of the migrant process) and b (the bandwidth of the network). We chose the memory transfer cost from a distribution with the same shape as the distribution of process lifetimes, setting the mean memory transfer cost (MMTC) to a range of values from 1 to 64 seconds. The shape of this distribution is based on an informal study of memory use patterns on the same machines from which we collected trace data. The important feature of this distribution is that there are many jobs with small memory demands
Fig. 3. Distribution of process slowdowns for run 0 (with no migration). Most processes suffer small slowdowns, but the processes in the tail of the distribution are more noticeable and annoying to users.
and a few jobs with very large memory demands. Empirically, the exact form of this distribution does not affect the performance of either migration strategy strongly, but of course the mean (MMTC) does have a strong effect.
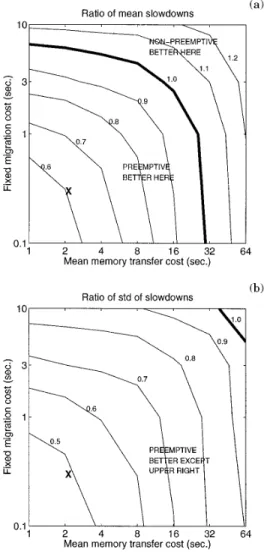
Figures 4(a) and (b) are contour plots of the ratio of the performance of the two migration strategies using normalized slowdown. Specifically, for each of the eight one-hour runs we calculate the mean (respectively, standard deviation) of the slowdown imposed on all processes that complete during the hour. For each run, we then take the ratio of the means
Fig. 4. (a) the performance of preemptive migration relative to nonpreemptive migration deteriorates as the cost of preemptive migration increases. The two axes are the two components of the preemptive migration cost. The cost of nonpreemptive migration is held fixed. The X marks the particular set of parameters we consider in the next section; (b) the standard deviation of slowdown may give a better indication of a user’s perception of system performance than mean slowdown. By this metric, the benefit of preemptive migration is even more significant.
(standard deviations) of the two strategies. Last, we take the geometric mean of the eight ratios (for discussion of the geometric mean see Hennessy and Patterson [1990]).
Fig. 5. (a) mean slowdown; (b) standard deviation of slowdown; (c) percentage of processes slowed by a factor of 3 or more; (d) percentage of processes slowed by a factor of 5 or more.
The two axes in Figure 4 represent the two components of the cost of preemptive migration—namely, the fixed cost, f, and the MMTC, m/b. The cost of nonpreemptive migration, r, is fixed at 0.3 seconds. As expected, increasing either the fixed cost of migration or the MMTC hurts the performance of preemptive migration. The contour line marked 1.0 indi-cates the crossover where the performance of preemptive and nonpreemp-tive migration is equal (the ratio is 1.0). For smaller values of the cost parameters, preemptive migration performs better; for example, if the fixed migration cost is 0.3 seconds, and the MMTC is 2 seconds, the normalized mean slowdown with preemptive migration is almost 40% lower than with nonpreemptive migration. When the fixed cost of migration or the MMTC are very high, almost all processes are ineligible for preemptive migration; thus, the preemptive strategy does almost no migrations. The nonpreemp-tive strategy is unaffected by these costs, so the nonpreempnonpreemp-tive strategy can be more effective.
Figure 4(b) shows the effect of migration costs on the standard deviation of slowdowns. The crossover point—where nonpreemptive migration sur-passes preemptive migration—is considerably higher here than in Figure 4(a). Thus there is a region where preemptive migration yields a higher mean slowdown than nonpreemptive migration, but a lower standard deviation. The reason for this is that nonpreemptive migration occasionally chooses a process for remote execution that turns out to be short-lived. These processes suffer large delays (relative to their run times) and add to the tail of the distribution of slowdowns. In the next section, we show cases in which the standard deviation of slowdowns is actually worse with nonpreemptive migration than with no migration at all (three of the eight runs).
5.3 Comparison of Preemptive and Nonpreemptive Strategies
In this section we choose migration cost parameters representative of current systems (see Section 4.2) and use them to examine more closely the performance of the two migration strategies. The values we chose are —r: the cost of remote execution, 0.3 seconds,
—f: the fixed cost of preemptive migration, 0.3 seconds, —b: the memory transfer bandwidth, 0.5MB per second, and —m: the mean memory size of migrant processes, 1MB.
In Figures 4(a) and (b), the point corresponding to these parameter values is marked with an X. Figure 5 shows the performance of the two migration strategies at this point (compared to the case of no migration).
Nonpreemptive migration reduces the normalized mean slowdown (Fig-ure 5(a)) by less than 20% for most runs (and 40% for the two runs with the highest loads). Preemptive migration reduces the normalized mean slow-down by 50% for most runs (and more than 60% for two of the runs). The performance improvement of preemptive migration over nonpreemptive migration is typically between 35% and 50%.
As discussed previously, we feel that the mean slowdown (normalized or not) understates the performance benefits of preemptive migration. We have proposed other metrics to try to quantify these benefits. Figure 5(b) shows the standard deviation of slowdowns, which reflects the number of severely impacted processes. Figures 5(c) and (d) explicitly measure the number of severely impacted processes, according to two different thresh-olds of acceptable slowdown. By these metrics, the benefits of migration in general appear greater, and the discrepancy between preemptive and nonpreemptive migration appears much greater. For example, in Figure 5(d), in the absence of migration, 7–18% of processes are slowed by a factor of 5 or more. Nonpreemptive migration is able to eliminate 42– 62% of these, which is a significant benefit, but preemptive migration consistently eliminates nearly all (86 –97%) severe delays.
An important observation from Figure 5(b) is that for several runs, nonpreemptive migration actually makes the performance of the system worse than if there were no migration at all. For the preemptive migration strategy, this outcome is nearly impossible, since migrations are only performed if they improve the slowdowns of all processes involved (in expectation). In the worst case, then, the preemptive strategy will do no worse than the case of no migration (in expectation).
Another benefit of preemptive migration is graceful degradation of sys-tem performance as load increases (as shown in Figure 5). In the presence of preemptive migration, both the mean and standard deviation of slow-down are nearly constant, regardless of the overall load on the system.
5.4 Why Preemptive Migration Outperforms Nonpreemptive Migration
The alternate metrics previously discussed shed some light on the reasons for the performance difference between preemptive and nonpreemptive migration. We consider two kinds of mistakes a migration system might make:
(1) Failing to Migrate Long-Lived Jobs: This type of error imposes moder-ate slowdowns on a potential migrant and, more importantly, inflicts delays on short jobs that are forced to share a processor with a CPU hog. Under nonpreemptive migration, this error occurs whenever a long-lived process is not on the name-list, possibly because it is an unknown program or an unusually long execution of a typically short-lived program. Preemptive migration can correct these errors by mi-grating long jobs later in their lives.
(2) Migrating Short-Lived Jobs: This type of error imposes large slowdowns on the migrated process, wastes network resources, and fails to effect significant load balancing. Under nonpreemptive migration, this error occurs when a process whose name is on the eligible list turns out to be short-lived. Our preemptive migration strategy all but eliminates this type of error by guaranteeing that the performance of a migrant improves in expectation.
Even occasional mistakes of the first kind can have a large impact on performance, because one long job on a busy machine will impede many small jobs. This effect is aggravated by the serial correlation between arrival times (see Section 5.1), which suggests that a busy host is likely to receive many future arrivals.
Thus, an important feature of a migration policy is its ability to identify long-lived jobs for migration. To evaluate this ability, we consider the average lifetime of the processes chosen for migration under each policy. Under nonpreemptive migration, the average lifetime of migrant processes was 2.0 seconds (the mean lifetime for all processes is 0.4 seconds), and the median lifetime of migrants was 0.9 seconds. The nonpreemptive policy migrated about 1% of all jobs, which accounted for 5.7% of the total CPU.
The preemptive migration policy was better able to identify long jobs; the average lifetime of migrant processes under preemptive migration was 4.9 seconds; the median lifetime of migrants was 2.0 seconds. The preemptive policy migrated 4% of all jobs, but since these migrants were long-lived, they accounted for 55% of the total CPU. Thus the primary reason for the success of preemptive migration is its ability to identify long jobs accu-rately and to migrate those jobs away from busy hosts.
The second type of error did not have as great an impact on the mean slowdown for all processes, but it did impose large slowdowns on some small processes. These outliers are reflected in the standard deviation of slowdowns— because the nonpreemptive policy sometimes migrates very short jobs, it can make the standard deviation of slowdowns worse than with no migration (see Figure 5(b)). The age-based preemptive migration criterion eliminates most errors of this type by guaranteeing that the performance of the migrant will improve in expectation.
There is, however, one type of migration error that is more problematic for preemptive migration than for nonpreemptive migration: stale load information. A target host may have a low load when a migration is initiated, but its load may have increased by the time the migrant arrives. This is more likely for a preemptive migration because the migration time is longer. In our simulations, we found that these errors do occur, although infrequently enough that they do not have a severe impact on performance. Specifically, we counted the number of migrant processes that arrived at a target host and found that the load was higher than it had been at the source host when migration began. For most runs, this occurred less than 0.5% of the time (for 2 runs with high loads it was 0.7%). Somewhat more often, 3% of the time, a migrant process arrived at a target host and found that the load at the target was greater than the current load at the source. These results suggest that the performance of a preemptive migration strategy might be improved by a reservation system as in MOSIX.
One other potential problem with preemptive migration is the volume of network traffic that results from large memory transfers. In our simula-tions, we did not model network congestion, on the assumption that the traffic generated by migration would not be excessive. This assumption
seems to be reasonable: under our preemptive migration strategy fewer than 4% of processes are migrated once, and fewer than 0.25% of processes are migrated more than once. Furthermore, there is seldom more than one migration in progress at a time.
In summary, the advantage of preemptive migration—its ability to identify long jobs and move them away from busy hosts— overcomes its disadvantages (longer migration times and stale load information).
5.4.1 Effect of Migration on Short and Long Jobs. We have claimed that identifying long jobs and migrating them away from busy hosts helps not only the long jobs (which run on more lightly loaded hosts) but also the short jobs that run on the source host. To test this claim, we divided the processes into three lifetime groups and measured the performance benefit for each group due to migration. The number of jobs in the short group is roughly 10 times the number in the medium group, which in turn is roughly 10 times the number in the long group. Figure 6 shows that migration reduces the mean slowdown of all three groups: for nontive migration the improvement is the same for all groups; under preemp-tive migration the long jobs enjoy a slightly greater benefit.
This breakdown by lifetime group is useful for evaluating various metrics of system performance. The metric we are using here, slowdown, gives equal weight to all jobs; as a result, the mean slowdown metric is domi-nated by the most populous group, short jobs. Another common metric, residence time, effectively weights jobs according to their lifetimes. Thus the mean residence time metric reflects, primarily, the performance benefit for long jobs. Under the mean residence time metric, then, preemptive migration appears even more effective.
5.5 Evaluation of Analytic Migration Criterion
As derived in Section 3.1, the minimum age for a migrant process according to our analytic criterion is
Minimum migration age5
Migration cost
n2m ,
where n is the load at the source host, and m is the load at the target host (including the potential migrant).
We compare the analytic criterion with the fixed-parameter criterion: Minimum
migration age5apMigration cost,
whereais a free parameter. This parameter is meant to model preemptive migration strategies in the literature, as discussed in Section 3.2. For comparison, we use the best fixed parameter, which for each run is the value that yields the smallest mean slowdown. Of course, this gives the fixed-parameter criterion a considerable advantage.
Figure 7 compares the performance of the analytic minimum-age crite-rion with the best fixed parameter. The best fixed parameter varies considerably from run to run and appears to be roughly correlated with the average load during the run (the runs are sorted in increasing order of total load).
The performance of the analytic criterion is always within a few percent of the performance of the best fixed-value criterion. The advantage of the
Fig. 7. The mean slowdown for eight runs, using the two criteria for minimum migration age. The value of the best fixed parameterais shown in parentheses for each run.
analytic criterion is that it is parameterless and therefore more robust across a variety of workloads. We feel that the elimination of one free parameter is a useful result in an area with so many (usually hand-tuned) parameters.
This result also suggests that the parameter used by Krueger and Livny (a5 0.1) is too low, and the parameter used in MOSIX (a51.0) is too high, at least for this workload (see Section 3.2).
6. WEAKNESSES OF THE MODEL
Our simulation ignores a number of factors that would affect the perfor-mance of migration in real systems:
—Bound Jobs Only: Our model considers all jobs as being CPU-bound; thus, their response time necessarily improves if they run on a host with a lighter load. For I/O-bound jobs, however, CPU contention has little effect on response time. These jobs would benefit less from migration. To see how large a role this plays in our results, we noted the names of the processes that appear most frequently in our traces (with CPU time greater than 1 second, since these are the processes most likely to be migrated). The most common names were cc1plus and cc1, both of which are CPU-bound. Next most frequent were trn, cpp, ld, jove (a version of emacs), and ps. So although some jobs in our traces are in reality interactive, our simple model is reasonable for many of the most common jobs. In Section 7 we discuss further implications of a workload including interactive, I/O-bound, and nonmigratable jobs.
—Environment: Our migration strategy takes advantage of the used-better-than-new property of process lifetimes. In an environment with a differ-ent distribution, this strategy will not be effective.
—Local Scheduling: We assume that local scheduling on the hosts is similar to round-robin. Other policies, like feedback scheduling, can reduce the impact of long jobs on the performance of short jobs and thereby reduce the need for load balancing. We explore this issue in more detail in Section 7 and find that preemptive migration is still beneficial under feedback scheduling.
—Memory Size: One weakness of our model is that we chose memory sizes from a measured distribution, and therefore our model ignores any correlation between memory size and other process characteristics. To justify this simplification, we conducted an informal study of processes in our department and found no correlation between memory size and process CPU usage. Krueger and Livny [1988] report a similar observa-tion. Thus this may be a reasonable simplificaobserva-tion.
—Network Contention: Our model does not consider the effect of increased network traffic as a result of process migration. We observe, however, for the load levels we simulated that migrations are occasional (one every few seconds) and that there is seldom more than one migration in progress at a time.
7. FUTURE WORK
In our workload model we have assumed that all processes are CPU-bound. Of primary interest in future work is including interactive, I/O-bound, and nonmigratable jobs into our workload.
In a workload that includes interactive jobs, I/O-bound jobs, and dae-mons, there will be some jobs that should not or cannot be migrated. An I/O-bound job, for example, will not necessarily run faster on a more lightly loaded host, and might run slower if it is migrated away from the disk or other I/O device it uses. A migrated interactive job might benefit by running on a more lightly loaded host if it uses significant CPU time, but will suffer performance penalties for all future interactions. Finally, some jobs (e.g., many daemons) cannot be migrated away from their hosts.
The policy we proposed for preemptive migration can be extended to deal appropriately with interactive and I/O-bound jobs by including in the definition of migration cost the additional costs that will be imposed on these jobs after migration, including network delays, access to nonlocal data, etc. The estimates of these costs might be based on the recent behavior of the job, e.g., the number and frequency of I/O requests and interactions. Jobs that are explicitly forbidden to migrate could be assigned an infinite migration cost.
The presence of a set of jobs that are either expensive or impossible to migrate might reduce the ability of the migration policy to move work around the network and balance loads effectively. However, we observe that the majority of long-lived jobs are, in fact, CPU-bound, and it is these long-lived jobs that consume the majority of CPU time. Thus, even if the migration policy were only able to migrate a subset of the jobs in the system, it could still have a significant load-balancing effect.
Another way in which the proposed migration policy should be altered in a more general environment is that n (the number of jobs at the source) and m (the number of jobs at the target host) should distinguish between CPU-bound jobs and other types of jobs, since only CPU-bound jobs affect CPU contention and therefore are significant in CPU load balancing.
Another important consideration in load balancing is the effect of local scheduling at the hosts. Most prior studies of load balancing have assumed, as we do, that the local scheduling is round-robin (or processor-sharing). A few assume first-come-first-served scheduling, but fewer still have studied the effect of feedback scheduling, where processes that have used the least CPU time are given priority over older processes. We simulated feedback scheduling and found that it greatly reduced mean slowdown (from approx-imately 2.5 to between 1.2 and 1.7, depending on load) even without migration. Thus the potential benefit of either type of migration is greatly reduced.
We evaluated the nonpreemptive migration policy from Section 5.1.1 under feedback scheduling and found that it often makes things worse, increasing the mean slowdown in 5 of the 8 runs and only decreasing it by 11% in the best case (highest load).
To evaluate our preemptive policy, we had to change the migration criterion to reflect the effect of local scheduling. Under processor sharing, we assume that the slowdown imposed on a process is equal to the number of processes on the host. Under feedback scheduling, the slowdown is closer to the number of younger processes, since older processes have lower priority. Thus, we modified the migration criterion in Section 3.1 so that n and m are the number of processes at the source and target hosts that are younger than the migrant process. Using this criterion, preemptive migra-tion reduces mean normalized slowdown by 12–32% and reduces the number of severely slowed processes (slowdown greater than 5) by 30 – 60%. An issue that remains unresolved is whether feedback scheduling is as effective in real systems as it was in our simulations. For example, decay-usage scheduling as used in UNIX has some characteristics of both round-robin and feedback policies [Epema 1995]. Young jobs do have some precedence, but old jobs that perform interaction or other I/O are given higher priority, which allows them to interfere with short jobs. In our experiments on a SPARC workstation running SunOS, we found that a long-running job that performs periodic I/O can obtain more than 50% of the CPU time, even if it is sharing a host with much younger processes. The more recent lottery scheduling behaves more like processor sharing [Wald-spurger and Weihl 1994]. To understand the effect of local scheduling on load balancing requires a process model that includes interaction and I/O.
8. CONCLUSIONS
In summary, this article makes the following points:
—To evaluate migration strategies, it is important to model the tion of process lifetimes accurately. Assuming an exponential distribu-tion can underestimate the benefits of preemptive migradistribu-tion, because it ignores the fact that old jobs are expected to be long-lived. Even a lifetime distribution that matches the measured distribution in both mean and variance may be misleading in designing and evaluating load-balancing policies.
—Preemptive migration outperforms nonpreemptive migration even when memory-transfer costs are high, for the following reason: nonpreemptive name-based strategies choose processes for migration that are expected to have long lives. If this prediction is wrong, and a process runs longer than expected, it cannot be migrated away, and many subsequent small processes will be delayed. A preemptive strategy is able to predict lifetimes more accurately (based on age), and more importantly, if the prediction is wrong, the system can recover by migrating the process later.
—Migrating a long job away from a busy host helps not only the long job, but also the many short jobs that are expected to arrive at the host in the future. A busy host is expected to receive many arrivals because of the serial correlation (burstiness) of the arrival process.