1
Athena SWAN Bronze department award application
Name of university: University of Glasgow
Department: Geographical & Earth Sciences
Date of application: 29th November 2013
Date of university Bronze and/or Silver SWAN award: Bronze Award, November 2012
Contact for application: Professor Maggie Cusack
Email: Maggie.Cusack@glasgow.ac.uk
Telephone: 0141 330 4224/5491
2
1. Letter of endorsement from the head of department:
20th November 2013
Sarah Dickinson
Athena SWAN Manager Athena SWAN Charter Equality Challenge Unit 7th Floor, Queens House 55-56 Lincoln's Inn Fields London WC2A 3LJ
Dear Sarah and members of the Athena SWAN assessment team,
As Head of the School (HoS) of Geographical & Earth Sciences (GES) at the University of Glasgow and Chair of the Self Assessment Team (SAT), it is a pleasure to provide an
endorsement for this application. As a woman in a STEMM subject, I have long been aware of how few women climb the career ladder in science. Athena SWAN provides an opportunity to explore the reasons behind this phenomenon and a mechanism to work towards addressing this issue.
GES is an interesting case since there are staff involved in STEMM research and teaching as well as others whose work is more closely aligned with Social Sciences and Arts. This breadth provides an interesting study ground in which to explore the behaviours and processes that work against equal gender representation in highly promoted posts. GES is, of course, much more than a study ground since it is our place of work, where we spend much of our time, teach students, carry out research and interact with colleagues so it is imperative that we do what we can to ensure that our working environment is equally supportive of females and males and values the contributions and approaches made by both women and men.
It has been enlightening to gather the data and take stock of GES rather than work on a vague sense of how we are. The data provides the required three year snapshot. It should be noted, however, that gender balance has shifted markedly over a longer time period in both
geography and earth sciences before the two units came together to form GES (section 5). The questionnaire to staff and the one to post-graduates brought out interesting and often challenging points that cause us all to reflect. In the staff questionnaire, 86% of respondents agreed with the statement “I understand my School’s reasons for taking action on gender equality”, 2% disagreed and 12% were neutral. Preparation of the submission including gathering data and consulting with staff and post-graduates has already raised the profile of the issue of women in STEMM, demonstrated our commitment to Athena Swan, and opened up many objective discussions.
3 Our action plan addresses key points that link our observations on our own data with the responses in the two questionnaires. We have begun to implement aspects of the action plan. For example, we have requested that other Schools inform us when they invite a female academic to present a research seminar so that we can request that the seminar speaker discusses career strategy with us in GES in an informal setting. We also have our own Athena SWAN@GES seminar series planned and Athena SWAN is now a standing item on our staff meeting agenda (Actions 4.2, 4.3, 6.2).
I shall ensure that resource is in place for the implementation of the action plan. I hope that the implementation of the action plan shifts aspects of what we do in a direction that supports women in academia and improves the working environment for all.
Yours sincerely,
_________________________________________________ School of Geographical & Earth Sciences
University of Glasgow, Glasgow G12 8QQ, Scotland, UK Tel: +44 (0)141 330 4224/5491
Fax: +44 (0)141 330 4894/4817
Head of School: Professor Maggie Cusack
4
2. The self-assessment process
a) A SAT was assembled in December 2012 to obtain the necessary data; to assess the practices of GES with respect to gender equality; to identify challenges that limit full gender equality; and to progress a bronze award application for Athena SWAN in GES. Team members were chosen to reflect a balance between men and women at different career stages, roles within GES and different work-life balance scenarios. These members include a full-time, post-graduate (PG) student (female), a Post-doctoral Research Fellow (male), a University Teacher (female), 2 Lecturers (1 female, 1 male), a part-time Reader (female), and the HoS (female). In addition to GES staff, the team includes the Athena SWAN Coordinator (female) for the University and a representative from the Equality and Diversity Unit (female). Brief biographies for each team member are below:
Alessa Geiger, PG student, joined GES as an undergraduate student in 2007 and is currently in her 4th year of full-time PhD studies in physical Geography. She has been involved in L1-4 undergraduate teaching in Geography. Alessa runs a single household.
Dr. Rhian Meara, University Teacher, completed her PhD in 2010 followed by a one-year Post Doctoral Research Associate (PDRA) before joining GES as a full-time University Teacher in 2012. She manages the L1 undergraduate Earth Science (ES) modules. She works from home one day during the week to avoid long commuting hours.
Dr. Nick Kamenos, Research Fellow, joined GES in 2006 from a non-permanent position at the University of London. He conducts research, runs research laboratories and manages the research SCUBA team at University of Glasgow (GU). Nick works from the office
most of the time.
Dr. Jaime Toney, Lecturer, joined GES as a non-permanent PDRA in 2011 and recently transitioned (March, 2013) to a full-time Lecturer in ES. She is a Health & Safety Officer, manages a research and laboratory group, and teaches L2, L3, and L4 courses in ES and
Geography. Jaime is a single parent with full custody and occasionally works from home when her daughter is ill or out of school.
Dr. Daniel Köhn, Lecturer, joined GES 2011 from a non-permanent position at the University of Mainz, Germany. He is student advisor and exams officer for the honours ES degree. Daniel is part of a dual career household, has two children, and works from home when possible due to long commuting hours (1.5-2h).
Dr. Hester Parr, Reader in Human Geographyjoined GES in 2009. Hester worked part-time (60%) during the assessment period due to child care, although is now 100% and is part of a dual
"academic" career family.
Professor Maggie Cusack, HoS, joined GES as a PDRA and later obtained an independent research fellowship before taking up a lectureship position. Maggie became Professor in 2007 and HoS in 2011. She is a mother of two who works full-time as part of a dual “academic” career family with her husband on the technical staff in GES.
Susan Mckeown,Athena SWAN Coordinator for the University, organised data collection, assisted with staff and student survey collation, and provided Athena SWAN best practice information.
5
Mhairi Taylor, lead Officer for Equality and Diversity Unit, was part of the ASSAT for GU’s Bronze Application submitted in 2012 and has provided data links for this application.
Jean McPartland is PA to the HoS and clerks the SAT, arranging meetings, recording the minutes and circulating the actions points to the SAT.
b) The SAT met formally 11 times since its assembly in December 2012 for substantial discussions and informally in subgroups to achieve tasks between meetings. Data gathering was shared among the team. The original intention was to submit for the April, 2013
deadline, but the SAT agreed that additional data was needed to understand the culture of GES, so the SAT worked together to construct a survey for all staff in GES, and this was
reworked for PGs. Data from the surveys provides additional insight into gender issues in GES and is used throughout the application. Staff input was also gained at two seminars early in the process and at multiple GES staff meetings throughout the assessment and post-action plan stage. SAT members have attended university-level events for Athena SWAN.
c) The SAT plans to meet every two months in order to oversee the progress of the action plan and carry out any emerging initiatives associated with the action plan. The SAT will be further sub-divided into working teams relating to data gathering, staff surveying and seminar
organization (SAT-DA, SAT-ST and SAT-SO, respectively). There are plans in place to increase the numbers of permanent staff on the team. As well as rotating membership, the SAT team will be expanded to include one open seat per meeting, more staff, a PDRA and additional PG representation. (Action 7.2)
The application process so far has highlighted gender issues within GES and prompted a number of action points, corresponding to, but also independent of, the University Bronze Award action plan. We will collect data and take action across promotion and career development processes, working culture and timings of meetings where appropriate and survey staff every two years (Action 5.1, 5.6). We are raising the awareness of gender issues and the ambitions of Athena SWAN by new gender and career development seminars called AthenaSWAN@GES to be held twice yearly for women-only and mixed gender groups (Action 4.2a and 5.1a). These seminars are experience-led and are seen as pivotal to positively changing and augmenting work cultures in GES and developing internal knowledge-sharing mechanisms that encourage women in Higher Education. The SAT team will change over time, to ensure that all members of GES are encouraged to think and act around gender and work issues, and in ways that enable and encourage the retention of women in higher education at all levels.
3. A picture of the department: maximum 2000 words
a) GES sits within the College of Science and Engineering and delivers highly successful four-year undergraduate degree programs in Geography and Earth Science. GES staff are highly committed to research-led teaching and year on year both degrees score above 90% in the National Student Survey (NSS). Three of our staff have won university teaching awards and two have been nominated by students for Student Representative Council teaching awards. Geography at Glasgow is ranked 27th in World University Rankings. In the Guardian league tables Geography was in 5th place and Earth Sciences in 11th. Both degrees achieved the second highest scores in terms of student satisfaction with the course. GES also offers a suite of 9 post-graduate taught (PGT) programs and has a vibrant post-graduate research (PGR) community.
6 Our academic staff profile comprises 23 female and 28 male staff: 3 female teaching
assistants, 3 female university teachers, 2 male senior university teachers, 6 female and 5 male post-docs, 1 female and 2 male Research fellows, 4 female and 4 male lecturers, 5 male senior lecturers, 1 female and 4 male Readers and 4 female and 6 male professors.
GES formed in 2005 from the merger of the Division of Earth Sciences with the Department of Geography & Topographic Science. GES occupies a split-site (two buildings). In addition to staff meetings, there is a monthly coffee session for the entire School and a monthly newsletter, GES News that serves to keep people informed about what is happening across GES.
Research is organised into two research groups: the Human Geography Research Group (HGRG) and the Earth Systems Research Group (ESRG), the latter comprising the Physical Geographers, Earth Scientists and Geomaticians. The research in GES is very diverse and multidisciplinary. This diversity can be measured in many ways and one such measure is that we currently have active grants from all 7 national research councils.
Student data
b) (i) Numbers of males and females on access or foundation courses
In 2009/10, there was one female and three male Earth Sciences students registered. In 2010/11, there was one male Earth Sciences student. In 2011/12, there were three female and four male Earth Sciences students. In 2012/13, there was one female and one male Geography student and two female and three male Earth Sciences students.
b) (ii)Undergraduate male and female numbers
Geography undergraduate students
On average, female students make up 56% of undergraduate students in all four years of the Geography degree program (Figure 1) and the percentage of 1st year female Geography students increased from 55 to 60 to 63% over the last four years (Table 1). At 4th year, females make up 56% of undergraduate students (Table 1). These values are all above the national average (52%) and indicate good recruitment, mentoring and retention within GES.
7
Figure 1: Geography Undergraduate gender profile
193 131 87 111 160 108 57 65 0 50 100 150 200 2009/10 2010/11 2011/12 2012/13 N u mb er o f st u d en ts
1st year Undergraduate Geography
Female Male 71 117 82 57 81 100 67 34 0 20 40 60 80 100 120 2009/10 2010/11 2011/12 2012/13 N u mb er o f st u d en ts
2nd year Undergraduate Geography
Female Male 50 37 69 58 47 41 47 43 0 20 40 60 2009/10 2010/11 2011/12 2012/13 N u mb er o f st u d en ts
3rd year Undergraduate Geography
Female Male 52 48 39 64 37 42 37 40 0 10 20 30 40 50 60 70 2009/10 2010/11 2011/12 2012/13 N u mb er o f st u d en ts
4th year Undergraduate Geography
8
Table 1: Number of female and male students at each stage of Geography degree and percentage of female students at each stage
Earth Sciences undergraduate students
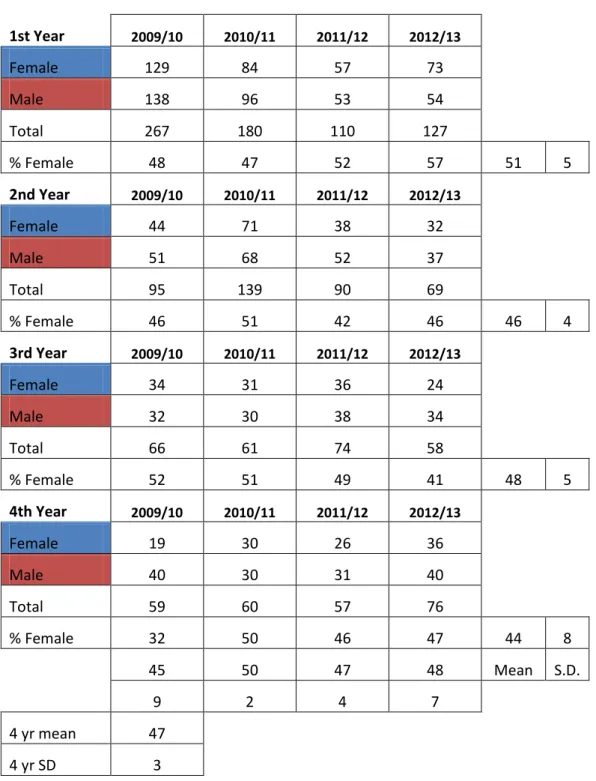
On average, females make up 47% of the undergraduate students in Earth Science for all four years of the degree program (Figure 2). In 4th year of the degree, 44% percent of students are female (Table 2). Both these are above the national average for Geology (39%) and in line with the national average for Physical Geography (47%). In addition, the % females in 1st year Earth Science has increased annually from 10/11 to 12/13: 47%, 52% and 57%. This indicates good recruitment, mentoring and retention within GES.
1st Year 2009/10 2010/11 2011/12 2012/13 Female 193 131 87 111 Male 160 108 57 65 Total 353 239 144 176 % female 55 55 60 63 58 4 2nd Year 2009/10 2010/11 2011/12 2012/13 Female 71 117 82 57 Male 81 100 67 34 Total 152 217 149 91 % female 47 54 55 63 55 7 3rd Year 2009/10 2010/11 2011/12 2012/13 Female 50 37 69 58 Male 47 41 47 43 Total 97 78 116 101 % female 52 47 59 57 54 6 4th Year 2009/10 2010/11 2011/12 2012/13 Female 52 48 39 64 Male 37 42 37 40 Total 89 90 76 104 % female 58 53 51 62 56 5 53 52 57 61 Mean S.D. 5 3 4 3 4 yr mean 56 4 yr SD 1
9
Figure 2: Earth Science Undergraduate gender profile
129 84 57 73 138 96 53 54 0 50 100 150 2009/10 2010/11 2011/12 2012/13 N u mb er o f st u d en ts
1st year Undergraduate Earth Science
Female Male 44 71 38 32 51 68 52 37 0 20 40 60 80 2009/10 2010/11 2011/12 2012/13 N u mb er o f st u d en ts
2nd year Undergraduate Earth Science
Female Male 34 31 36 24 32 30 38 34 0 10 20 30 40 2009/10 2010/11 2011/12 2012/13 N u mb er o f st u d en ts
3rd year Undergraduate Earth Science
Female Male 19 30 26 36 40 30 31 40 0 10 20 30 40 2009/10 2010/11 2011/12 2012/13 N u mb er o f st u d en ts
4th year Undergraduate Earth Science
10 1st Year 2009/10 2010/11 2011/12 2012/13 Female 129 84 57 73 Male 138 96 53 54 Total 267 180 110 127 % Female 48 47 52 57 51 5 2nd Year 2009/10 2010/11 2011/12 2012/13 Female 44 71 38 32 Male 51 68 52 37 Total 95 139 90 69 % Female 46 51 42 46 46 4 3rd Year 2009/10 2010/11 2011/12 2012/13 Female 34 31 36 24 Male 32 30 38 34 Total 66 61 74 58 % Female 52 51 49 41 48 5 4th Year 2009/10 2010/11 2011/12 2012/13 Female 19 30 26 36 Male 40 30 31 40 Total 59 60 57 76 % Female 32 50 46 47 44 8 45 50 47 48 Mean S.D. 9 2 4 7 4 yr mean 47 4 yr SD 3
Table 2: Number of female and male students at each stage of Earth Science degree and percentage of female students at each stage
b) (iii) Postgraduate female and male students completing taught courses
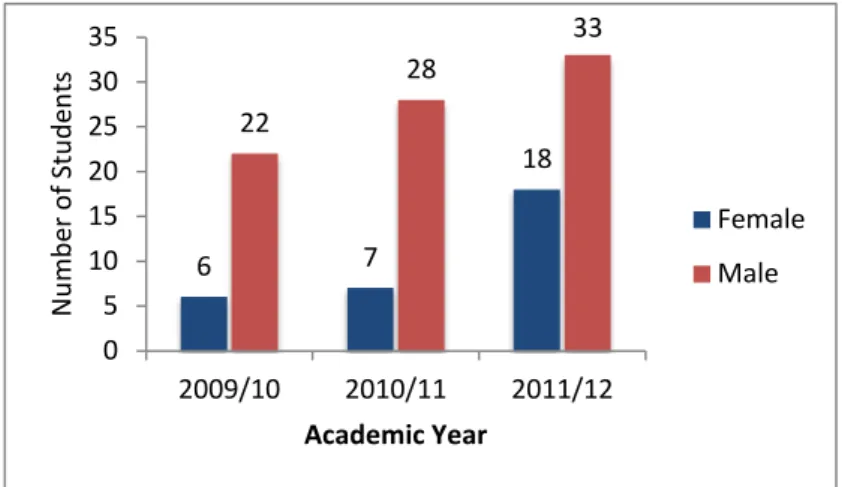
PGT courses in GES include the MRes in Human Geography (HG), two MSc programs in Geomatics and a suite of Water MSc programs that started in 2011/12. Data is provided for the MRes and Geomatics PGT programs (Figures 3 & 4), because they have been running long enough to provide data. The average percentage of women in the PGT courses is 25%. In order to analyse this in greater detail we looked at the gender balance in specific master courses. No PGT students were registered as part-time between 2009 and 2012.
11
Figure 3:Number of post-graduate taught Masters students
Figure 4:Percentage of female post-graduate taught Masters students
Total Masters Students 2009/10 2010/11 2011/12 Female 6 7 18 Male 22 28 33 Total 28 35 51 % Female 21 20 35 25 8 Mean SD
Table 3: Number of students and % female post-graduate taught Masters students
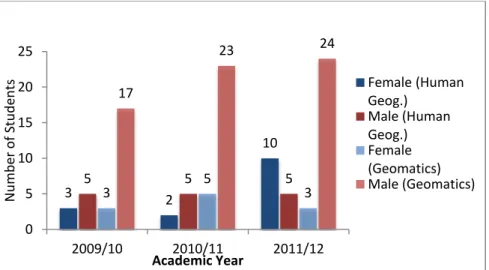
Female participation in the MRes in HG increased from 38% in 09/10 to 67% in 11/12 (Figures 5 & 6 & Table 4). This has moved the percent of females from below the national average (60%) to above. Female participation in the Geomatics master course declined from 15% in 09/10 to 11% in 11/12 (Figures 5 & 6), which are both below the national average (43% Physical Geography). We will assess the low female participation in Geomatics and will
consult with Geomatics staff and external examiners from academia and industry (Action 2.2).
6 7 18 22 28 33 0 5 10 15 20 25 30 35 2009/10 2010/11 2011/12 N u m b er o f St u d en ts Academic Year Female Male 21 20 35 0 20 40 60 80 100 2009/10 2010/11 2011/12 Perc en t (% ) Academic Year
12
Figure 5: Number of female and male students on Human Geography & Geomatics Programs
Figure 6: Percentage of female students on Human Geography & Geomatics Programs
Human Geography 2009/10 2010/11 2011/12 Female 3 2 10 Male 5 5 5 Total 8 7 15 % Female 38 29 67 45 20 Mean SD Geomatics 2009/10 2010/11 2011/12 Female 3 5 3 Male 17 23 24 Total 20 28 27 % Female 15 18 11 15 4 Mean SD
Table 4: Number of students and % female students on Human Geography and Geomatics Masters programs 3 2 10 5 5 5 3 5 3 17 23 24 0 5 10 15 20 25 2009/10 2010/11 2011/12 N u m b er o f St u d en ts Academic Year Female (Human Geog.) Male (Human Geog.) Female (Geomatics) Male (Geomatics) 38 29 67 15 18 11 0 10 20 30 40 50 60 70 80 2009/10 2010/11 2011/12 Perc en t (% ) Academic Year
Female: Human Geog. Female: Geomatics
13
b) (iv) Postgraduate male and female numbers on research degrees
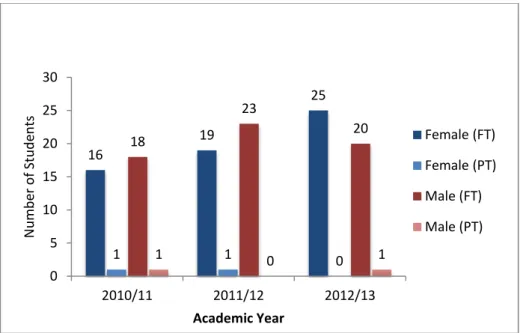
The percentage of female full time PhD students fluctuates over the assessment period from 47% in 10/11 to 56% in 12/13 (Figure 7 & Table 5) with an overall gender balance. The percentages are in line with national averages for Geology, Physical Geography and Human/Social Geography (50% in 2010/11 and 47% in 2011/12). This indicates good
recruitment, mentoring and retention within GES. The numbers of part-time students are too low for meaningful comparative statistics but appear to fluctuate at around 50% male female and male students.
Figure 7: Number of female and male full- and part-time PhD students
PhD students 2010/11 2011/12 2012/13 Female (FT) 16 19 25 Male (FT) 18 23 20 Total 34 42 45 % Female 47 45 56 49 6 Mean SD Female (PT) 1 1 0 Male (PT) 1 0 1 Total 2 1 1 % Female 50 100 0 50 50 Mean SD
Table 5: Number of female and male PhD students and % female full-time and part-time PhD students 16 19 25 1 1 0 18 23 20 1 0 1 0 5 10 15 20 25 30 2010/11 2011/12 2012/13 N u m b er o f St u d en ts Academic Year Female (FT) Female (PT) Male (FT) Male (PT)
14
b) (v) Ratio of course applications to offers and acceptances by gender for undergraduate, postgraduate taught and postgraduate research degrees
Undergraduate applications, offers and acceptances
Generally, more females than males apply to, get offers and accept places for the Geography undergraduate degree (Figure 8)1. The number of applications has declined in the last few years and the drop in applications in 2012 was more marked among females (Figure 8); however, the number of offers and acceptances were greater among female students (Figure 9). The reason for this increase in offers to female applicants is unknown, but we note that it coincides with an increase in qualification entry tariff.
Figure 8: Number of female and male applications, offers and acceptances to Geography
Figure 9: Percentage of female applications, offers and acceptances to Geography
1
Please note that these data refer to those applications that specify Geography or Earth Sciences. At the University of Glasgow, students study three subjects in first year and two in second year before focusing on the subject of their honours degree in years 3 and 4. Thus, the sizes of the first and second year classes are larger than the number of places offered in any one subject. The honours classes also contain students who studied Geography or Earth Sciences as a second or third subject in first year and therefore do not appear in applications or offers data for these subjects.
480 410 339 232 230 133 106 135 97 71 53 58 388 367 312 310 185 105 68 67 78 56 26 28 0 100 200 300 400 500 600 2009 2010 2011 2012 N u mb er o f st u d en ts
Applications F Offers F Aceptances F
Application M Offers M Acceptances M
55 53 52 43 55 56 61 67 55 56 67 67 0 20 40 60 80 2009 2010 2011 2012 % f em ale s
15 Fewer females than males apply for the Earth Science undergraduate degree (Figure 10), although in 2012 the proportion of females applying increased (Figure 10) and offers and acceptances to female students was greater than those for males (Figure 11). We will monitor this to determine if it is an on-going trend and related to increases in tariff that occurred at the same time (Action 2.1)
Figure 10: Number of female and male applications, offers and acceptances to Earth Science
Figure 11: Percentage of female applications, offers and acceptances to Earth Science
Post-graduate applications, offers and acceptances
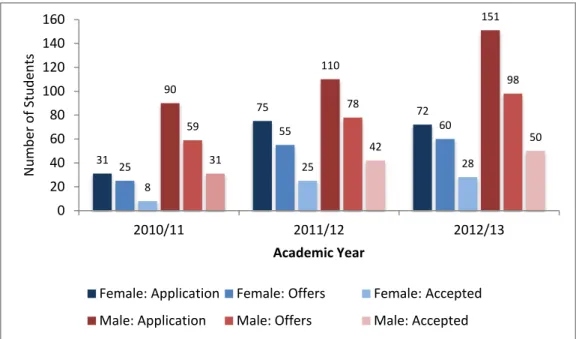
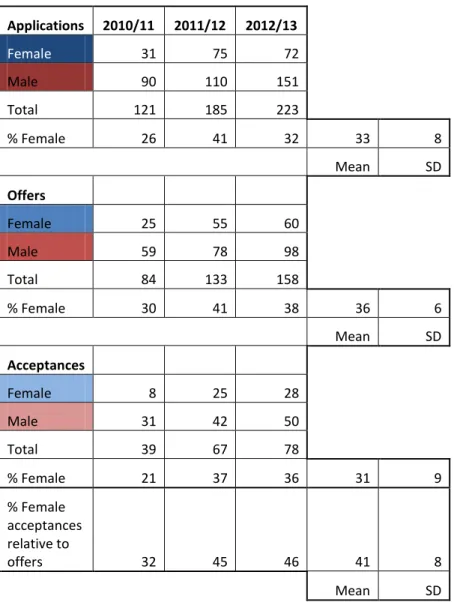
Between 2010/11 and 2011/12 GES recorded a doubling of female applications for the PGT courses (Figure 12 ) that was sustained for 2012/13 (Figure 13). Though fewer female students apply for the PGT courses, a
108 111 91 148 62 46 32 55 29 19 13 21 163 144 162 169 90 52 43 41 45 24 19 14 0 20 40 60 80 100 120 140 160 180 2009 2010 2011 2012 N u mb er o f st u d en ts
Applications F Offers F Aceptances F
Application M Offers M Acceptances M
40 44 36 47 41 47 43 57 39 44 41 60 0 20 40 60 80 2009 2010 2011 2012 % f em ale s
16 higher percentage of female applicants (77%, 3-year average) to male applicants (70%, 3-year average) are offered a place. In addition, an increase in female acceptances in relation to offers from 32% to 46% between 2010 and 2013
(Table 6).
Figure 12: Number of female and male applications, offers and acceptances for PGT programs
Figure 13: Percentage of female applications, offers and acceptances for PGT programs 31 75 72 25 55 60 8 25 28 90 110 151 59 78 98 31 42 50 0 20 40 60 80 100 120 140 160 2010/11 2011/12 2012/13 N u m b er o f St u d en ts Academic Year
Female: Application Female: Offers Female: Accepted
Male: Application Male: Offers Male: Accepted
26 41 32 30 41 38 21 37 36 0 10 20 30 40 50 60 70 80 2010/11 2011/12 2012/13 % o f Fe m ales Academic Year
17 Applications 2010/11 2011/12 2012/13 Female 31 75 72 Male 90 110 151 Total 121 185 223 % Female 26 41 32 33 8 Mean SD Offers Female 25 55 60 Male 59 78 98 Total 84 133 158 % Female 30 41 38 36 6 Mean SD Acceptances Female 8 25 28 Male 31 42 50 Total 39 67 78 % Female 21 37 36 31 9 % Female acceptances relative to offers 32 45 46 41 8 Mean SD
Table 6: Number of female and male PGT applications, offers and acceptances and percentage female applications, offers and acceptances
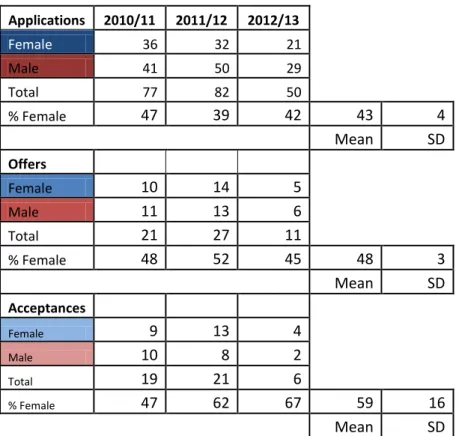
During 2011-13 on average 43% of PhD applicants were female and 48% of the offers for PhD places went to female applicants. Over that same period, 59% of those accepting offers were female and 63% of students registering for a PhD were female2. (Table 7)
2 The number of acceptances and registrations in any one year is different because students can receive an offer
18 Applications 2010/11 2011/12 2012/13 Female 36 32 21 Male 41 50 29 Total 77 82 50 % Female 47 39 42 43 4 Mean SD Offers Female 10 14 5 Male 11 13 6 Total 21 27 11 % Female 48 52 45 48 3 Mean SD Acceptances Female 9 13 4 Male 10 8 2 Total 19 21 6 % Female 47 62 67 59 16 Mean SD
Table 7: Number of female and male PhD applications, offers and acceptances and percentage female applications, offers and acceptances
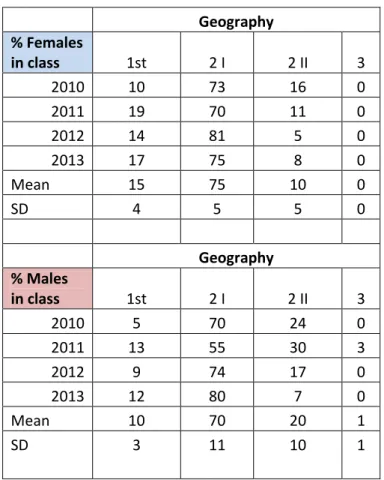
b) (vi) Degree classification by gender Undergraduate degrees
Geography
Figure 14 shows the number of female and male students graduating in each degree category in Geography. The proportion of females in each degree category varies from year to year in Geography (Figure 14). Figure 15 and Table 8 present the percentage of females in the class being awarded each degree category over the last four years. Figure 15 presents the four-year mean data that show that females tend to achieve more of the first class and upper second class honours in Geography although the differences between female and male degree classification are not statistically significant.
19
Figure 14: Number of female and male students graduating in each degree category in Geography 5 36 8 0 2 26 9 0 0 10 20 30 40 50 I 2 I 2 II 3 N u m b er o f stu d en ts
Geography Degree classification 2010
Females Males 9 33 5 0 5 22 12 1 0 10 20 30 40 50 I 2 I 2 II 3 N u m b er o f stu d en ts
Geography Degree classification 2011
Females Males 5 30 2 0 3 26 6 0 0 10 20 30 40 50 I 2 I 2 II 3 N u m b er o f stu d en ts
Geography Degree classification 2012
Females Males 11 47 5 0 5 33 3 0 0 10 20 30 40 50 I 2 I 2 II 3 N u m b er o f stu d en ts
Geography Degree classification 2013
20 Geography % Females in class 1st 2 I 2 II 3 2010 10 73 16 0 2011 19 70 11 0 2012 14 81 5 0 2013 17 75 8 0 Mean 15 75 10 0 SD 4 5 5 0 Geography % Males in class 1st 2 I 2 II 3 2010 5 70 24 0 2011 13 55 30 3 2012 9 74 17 0 2013 12 80 7 0 Mean 10 70 20 1 SD 3 11 10 1
Table 8: Percentage of females and males in the class graduating in each degree category
Figure 15: Mean percentage over four years of females and males in the Geography class graduating in each degree category
Earth Science
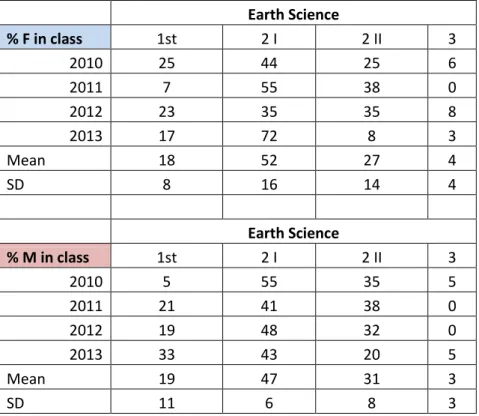
Figure 16 shows the number of female and male students graduating in each degree category in Earth Sciences. The proportion of females in each degree category varies from year to year in Earth Sciences. Table 9 present the percentage of females in the class being awarded each degree category over the last four years. Figure 17 presents the four-year mean data that shows that females tend to achieve close to the same proportion of first class honours and more of the upper second class degrees although, again, these differences are not statistically significant. 15 75 10 0 10 70 20 1 0 20 40 60 80 100 1st 2 I 2 II 3
% females in class in each category % males in class in each catergory
21
Figure 16: Number of female and male students graduating in each degree category in Earth Science 4 7 4 1 2 22 14 2 0 10 20 30 I 2 I 2 II 3 N u m b er o f stu d en ts
Earth Science Degree classification 2010
Females Males 2 16 11 0 6 12 11 0 0 10 20 30 I 2 I 2 II 3 N u m b er o f stu d en ts
Earth Science Degree classification 2011
Females Males 6 9 9 2 6 15 10 0 0 10 20 30 I 2 I 2 II 3 N u m b er o f stu d en ts
Earth Science Degree classification 2012
Females Males 6 26 3 1 13 17 8 2 0 10 20 30 I 2 I 2 II 3 N u m b er o f stu d en ts
Earth Science Degree classification 2013
22
Table 9: Percentage of females and males in the Earth Science class graduating in each degree category
Figure 17: Mean percentage over four years of females and males in the Earth Science class graduating in each degree category
18 52 27 4 19 47 31 3 0 10 20 30 40 50 60 70 80 90 100 1st 2 I 2 II 3
% females in class in each category % males in class in each catergory
Earth Science % F in class 1st 2 I 2 II 3 2010 25 44 25 6 2011 7 55 38 0 2012 23 35 35 8 2013 17 72 8 3 Mean 18 52 27 4 SD 8 16 14 4 Earth Science % M in class 1st 2 I 2 II 3 2010 5 55 35 5 2011 21 41 38 0 2012 19 48 32 0 2013 33 43 20 5 Mean 19 47 31 3 SD 11 6 8 3
23
Post-graduate taught
On average female PGTs on the HG Masters course receive higher degree classifications (distinction & merit) than their male counterparts (Figure 18, Table 10). Within the PGT Geomatics course female performance varies from year to year with the majority of grades received by female students being with merit and distinction (Figures. 19 & Table 11).
Figure 18: Number of female and male students achieving distinction, merit, qualification or no classification in Human Geography Masters program
With Distinction 2009/10 2010/11 2011/12 Female 3 0 8 Male 1 2 1 Total 4 2 9 % Female 75 0 89 With Merit 2009/10 2010/11 2011/12 Female 0 2 2 Male 4 2 3 Total 4 4 5 % Female 0 50 40 Qualified 2009/10 2010/11 2011/12 Female 0 0 0 Male 0 0 1 No Classification 2009/10 2010/11 2011/12 Female 0 0 0 Male 0 1 0
Table 10: Number of female and male students and percentage female students achieving distinction, merit, qualification or no classification in Human Geography Masters program
3 0 8 0 2 2 1 2 1 4 2 3 0 0 1 0 1 0 0 1 2 3 4 5 6 7 8 9 2009/10 2010/11 2011/12 N u m b e r o f Stu d e n ts Academic Year Female: Distinction Female: Merit Male: Distinction Male: Merit Male: Qualified Male: No Classification
24
Figure 19: Number of female and male students achieving distinction, merit, qualification or no classification in Geomatics Masters program
Distinction 2009/10 2010/11 2011/12 Qualified 2009/10 2010/11 2011/12 Female 0 3 0 Female 0 0 2 Male 1 1 3 Male 0 1 14 Total 1 4 3 Total 0 1 16 % Female 0 75 0 % Female 0 0 13 Merit 2009/10 2010/11 2011/12 No Classification 2009/10 2010/11 2011/12 Female 2 1 1 Female 1 1 0 Male 9 11 7 Male 7 10 0 Total 11 12 8 Total 8 11 0 % Female 18 8 13 % Female 13 9 0
Table 11: Number of female and male students and percentage female students achieving distinction, merit, qualification or no classification in Geomatics Masters program
The increase in PGR population in GES results in a higher number of PhD completions (Figure 20). There has been a doubling of PGRs submitting their thesis for examination from 2009/10 to 2011/12 (Figure 21, Table 12) as a result of increased recruitment with good retention practices including our annual progression conference organised by PGR students. This is an opportunity to celebrate the work of our PGR’s, provide input, feedback, guidance and enable discussion. Further data will be collected in the future that observes and interprets retention and drop-out rates for males and female PGRs (Action 2.1).
0 3 0 2 1 1 0 0 2 1 1 0 1 1 3 9 11 7 0 1 14 7 10 0 0 2 4 6 8 10 12 14 16 2009/10 2010/11 2011/12 N u m b e r o f Stu d e n ts Academic Year Female: Distinction Female: Merit Female: Qualified Female: No Classification Male: Distinction Male: Merit Male: Qualified Male: No Classification
25
Figure 20: Number of female and male PhD candidates completing their degrees
Figure 21: Percentage of female students in the pool of candidates completing their PhD degree PhD Completion 2009/10 2010/11 2011/12 Female 1 4 9 Male 2 4 6 Total 3 8 15 % Female 33 50 60 48 14 Mean SD
Table 12: Number of female and male and percentage of female students completing their PhD degree
We will continue to analyse and review all student data (Action 2.1)
1 4 9 2 4 6 0 2 4 6 8 10 2009/10 2010/11 2011/12 N u m b er o f St u d en ts Academic Year Female Male 33 50 60 0 20 40 60 80 100 2009/10 2010/11 2011/12 Perc en t (% ) Academic Year Female
26
Staff data
b) (vii) Female: male ratio of academic staff and research
Only about one-third of GES Professors are female and there is a classic scissor plot with females making up the minority of permanent, full-time academic positions (Figure 22). From Lecturer onwards the proportion remains below 33%. Females fill the majority of (typically) non-permanent roles with flexible hours, such as, University Teacher (72%). The Research Assistant category is difficult to assess due to low numbers. Research Associates fluctuate around 50%, although in 2012/13 the numbers were skewed more toward male PDRAs (62%). The biggest transition evident in this data is the transition from PDRA to Lecturer, which is the change from (typically) non-permanent to permanent employment. This may be related to the perception revealed in the survey that the job is incompatible with work-life balance by some PGRs and staff (see Section 4), but also the lack of clear transition support from one type of post to another. These issues are identified and discussed in more detail in Section 4.
Additional action points include GES promoting the extensive existing resources, workshops and opportunities offered at the University level, which include interview skills workshops and more (Action 3.2).
27
Figure 22: Number of female and male staff at each grade in GES over the last three years
b) (viii) Turnover by grade and gender
Between 2010 and 2011, 55% of job leavers were male, including two Research Assistants, one Senior Graduate Assistant, one Lecturer, one Senior Lecturer and one Professor. 45% of job leavers were female with three Research Associates, one Marie Curie Early Stage
Researcher and one Senior Lecturer. In 2011 to 2012 40% of job leavers were male with one Research Assistant, one teaching Fellow, one Lecturer and one University teacher. The 60% of female leavers included two Research Assistants, one Graduate Teaching Assistant, two Research Associates and one University Teacher. In 2012 to 2013, 92% of job leavers were male with five Research Associates, one University Teacher, one Graduate Teaching Assistant, one Tutor, two Research Assistants, one Reader and one Senior Research Fellow. Female job leavers only make up 8% with one Research Associate.
It is not clear why the last year has such a high percentage of male job leavers. We will continue to monitor the data within the next 3 years in order to see if last year was an exception. In general male leavers include a larger number of higher grade jobs, which is expected since males make up a larger proportion of these positions. We will collect, analyse and review data of staff leaving on short-term and long-term contracts (Action 7.1) and monitor PDRA destinations (Action 1.3)
4. Supporting and advancing women’s careers
a) (i) Job application and success rates by gender and grade
On average, females make up 44% (Table 13) of the applicant pool to all jobs in GES over the last 3-years and have a greater success rate than males for appointments, overall (57%). The data for short-term contract positions show that female success rates are consistently high. However, for permanent positions, the overall numbers are low and are particularly skewed by a Geomatics Lecturer post in 2011/2012 where only 23% of applicants were females (3 out of 13), and the post went to a male candidate. The lack of women in Geomatics has been flagged in other sections of the application (Section 3biii) and the SAT will investigate the reasons for low numbers of females in the Geomatics sector of GES (related to Action 1.1 and
28
1.2 and Action 2.2). Both permanent and short-term contract data suggest that the applicant pool could be better balanced, which should be addressed in our action plan for recruitment
(Actions 1.2, 1.4).
GES follows University policy and guidance in wording for job descriptions and related information. Recommendations to increase the number of female applicants for academic posts are being addressed through the University’s Bronze Award Action Plan.
We will continue to collect and review staff applications and appointments by gender (Action 1.2).
The SAT also plans to monitor and assess data to promote proportional gender representation on appointing committees (Action 3.4).
Table 13: Job applications and appointments in GES by gender
a) (ii) Applications for promotion and success rates by gender and grade
Over the last 3-years most candidates (male and female) received promotions when they applied (Table 14), although the same female applicant was unsuccessful in 2010 and 2011.
Table 14: Promotion applications and outcome by gender and grade Grade applied for Gender Decision Grade applied for Gender Decision Grade applied for Gender Decision
Professor F No Professor F No
Senior Lecturer -
Grade 9 M Yes
Professor M Yes Professor M Yes Lecturer - Grade 8 M Yes
Professor F Yes Professor M No
Research Associate -
Grade 7 F Yes
Senior Lecturer -
Grade 9 M Yes Lecturer - Grade 8 M Yes
Senior Lecturer - Grade 9 M Yes Research Fellow - Grade 8 M Yes Senior Lecturer - Grade 9 M Yes
Reader - Grade 9 M Yes
29 GES supports the promotion of staff and offers feedback if applicant is not successful. The HoS (female) sits on the College-wide promotion panel ensuring adequate representation and feedback for individual candidates. We currently have 22 staff members in positions eligible for promotion, although 5 were hired within the last 3-years at their current level (note: promotion within Professorial zones was just instituted at the University in the past year). 23% of eligible staff apply for promotion on average each year. The proportion of female applicants (21%) is lower than the proportion of females in the eligibility pool (29%). The majority of the applicants are male as a consequence of the larger proportion of male staff. Most applicants are ready when they apply and so successful however currently an individual needs to approach the HoS for promotion. The staff survey revealed clearer promotion pathways are necessary in GES. This lack of clarity may prevent qualified candidates from seeking promotion. We will clarify the promotion process and criteria at University level and in particular with relation to part-time staff and participation in outreach activities (Action 3.6), and make clearer how university criteria is managed at School level. We are currently embedding promotion discussions as part of the annual P&DR (Action 3.7). Actions around promotion pathways will proactively identify staff members ready for promotion and may assist women who need encouragement to apply, and increase the number of applications overall. T he College of MVLS in the University will also monitor the gender balance on College promotion panels from November 2013 and report to the University Athena SWAN SAT as part of the University Action Plan. This data will be available for the GES SAT to analyse and inform any future actions.
We also plan to hold ‘Career Development meetings’ as part of the AthenaSwan@GES seminar series in order to address career transition as a topic where senior staff can share their experiences (Action 4.2).
Increasing the number of women who progress to higher grades and to leadership roles is a matter also being addressed through the University’s Bronze Award Action Plan.
We will continue to monitor promotion and success rates by gender (Action 3.8).
b) (i) Recruitment of staff
The University institutes good practice in recruitment and all members of appointment committees must undertake the Recruitment and Selection course, including the Equality and Diversity Essentials Online course. The HoS ensures that the correct procedures are followed and HR monitors this. The University HR Recruitment Team will monitor gender
representation on appointing committees starting in December 2013 and make them available to GES for review of current policy. At the school level, all staff are encouraged to solicit applications from suitably talented candidates. Women staff members in particular will be encouraged to actively promote recruitment opportunities in GES via their own and
disciplinary networks (Action 3.5). This will raise the profile of GES as a School where women are working at a variety of levels and encourages female applicants.
The GES staff survey (2012-13) does not reveal direct qualitative responses regarding recruitment, but one staff member noted she was appointed as Reader directly after
30 at interview, and GES agreed, demonstrating evidence of flexibility to women in recruitment and their access to relatively senior posts.
b) (ii) Support for staff at key career transition points
The SAT identified the following three key transitions as problematic in GES: (1) from PhD to PDRA (2) from PDRA to permanent position/independent researcher (Section 3b vii) and 3) Senior Lecturer/Reader to Professor (and we have related actions, respectively: Actions 4.2, 3.1, 3.3). The SAT will identify the key issues for career progression among women in
permanent positions (Action 3.3). Both GES staff and PG surveys highlighted areas for the SAT to work on – especially in regards to female PGR – and their perceptions of academic life for women. Female staff and PGs will be invited to yearly AthenaSWAN@GES events for women to discuss a variety of topics around career transition and development (Action 4.2). We will also invite a variety of female academics from other Schools to discuss their career path informally (Action 4.3).
The University provides numerous training workshops for PDRAs to transition to independent, grant-seeking researchers or lecturers, as well as, a wide range of resources and support for early-career researchers in transition linked to the Research Development Framework. PDRAs are not always aware of these resources, so GES will play a more active role in promotion of these in the future (Action 3.2). All new lecturing and teaching staff on formal probation participate and complete the New Lecturer/Teacher Programme (NTLP) offered by the Learning and Teaching Centre. These programmes assist with transition.
The HoS appoints a mentor for lecturing and teaching probationary staff, and honours gender-specific requests. Following probation, informal mentoring relationships are established, and in the future GES will promote and encourage those (Action 5.4). Following probation, all staff are offered staff development opportunities within the University related to skill sets and directed at different career stages. GES arranges specific types of training and development opportunities where and when they are appropriate, such as communicating your research. In current survey responses, other key transitions points were raised, e.g., one female staff member who returned from maternity leave within the last three years recommended a review of the ‘return to work’ policy and plan for women returning from maternity leave in GES and the SAT will do this (Action 6.1).
5. Career development
a) (i)Promotion and career development
Probation: Normally the period is 3-years and a mentor is assigned. Probationers are given a 50% teaching load in the first year increasing to 75% in year two, and 100% in year three. Probationers have access to numerous University-level training courses for career
development, supervising PGRs, etc. Probationers are required to complete a Probationary Objectives form, which encourages them to reflect on teaching and research strategies, as well as, administrative objectives set forth by the HoS and discuss these with the HoS to ensure reasonable objectives are made. Probationers also engage in P&DR (explained below). All probationers have completed successfully in the last 3-years in GES.
Beyond probation: GES staff have access to the University Staff Development Service (SDS), which has a range of programmes. The University has recently launched the Early Career Development Programme for staff on Grade 7 and 8 recruited since August 2013. The College and GES assist with mentor matching as part of this programme. The sector-leading Principle Investigator (PI) programme is offered for early career researchers and aspiring PI’s. The New
31 Academic Leadership training is available to new or recently appointed (in the past year) HoSs, Directors of Research Institutes and Deans. All these schemes assist with career development, and the SAT survey for 2014 will monitor how these programmes helped locally.
Performance and Development Review (P&DR): P&DR is a comprehensive annual evaluation of activity around research and scholarship, learning and teaching, knowledge exchange, internationalisation, leadership and management and esteem. Each year performance is reflected upon and success recognised with a particular focus on objectives set the previous year. The SDS offers training for the reviewer and those being reviewed. The HoS, Research Group Heads, HoS Administration, an academic for the Technicians all act as reviewers for GES’s P&DR. The reviews are signed off by the HoS, and moderated at Grade 9 and 10 by the College Board of Review. P&DR does take into consideration responsibilities for teaching, research, administration, pastoral work and outreach work. Promotion is being discussed in the P&DR starting in 2013.
Promotion: The University’s Appointment, Progression and Promotion policy provides for appointment, progression and promotion to any grade within an academic career track. It provides a career path to full-Professorship in Research and Teaching following a
self-application process. The HoS completes a statement to support the applicant’s submission. In the case of professorial promotion applications, recently instituted, the HoS consults with all the Professors within GES. Each application is then considered by the relevant College
Progression and Promotion Committee (CPPC) convened by the relevant Head of College/Vice Principal.
Our local data raises awareness and confidence issues about pathways to promotion. It is significant that 48% of male GES survey respondents report ‘agreement’ they understand the GU-GES promotion process and criteria, but only 19% of female staff members say the same. In a qualitative comment, one female staff member elaborated that promotion is not often discussed in GES and another reports a lack of clarity over how part-time contributions would be assessed for promotion. As a result of these responses, GES now has new action-points in place to address this feedback. (Actions 3.3, 3.5, 3.6, 3.7).
a) (ii) Induction and training
The University provides an induction for all new staff members, which includes an
introduction to: The Concordat to Support the Career Development of Researchers; and the Staff Development Service (SDS), which provides a range of programmes and courses throughout the year, including topics such as: communication, P&DR, researcher
development, and work-life balance. The SDS offers an Induction Seminar to all new staff that introduces the university structure, strategy, facilities, benefits and relevant policies as well as the opportunity to meet other new staff. SDS also offers a New Staff Stallholder event biannually, which is hosted by the Principal. It provides staff with more information on University services and functions and the opportunity to meet other new colleagues and key people. The University HR Service invited all new staff and their partner/family to a Welcome and Networking event, which was held for the first time in September 2013 and included a treasure hunt for children. The College of Science and Engineering hosts a welcome reception for all new academic staff twice yearly.
All staff members are expected to complete an e-Learning training module on Equality and Diversity Essentials, which includes a short assessment. 34% of University staff have
32 All new staff must complete an Induction online within three months of joining. This E-Induction is provided and monitored by the University’s Department of Health, Safety and Wellbeing and includes the Equality and Diversity Essentials online course. New members of staff are also assigned an Induction “Buddy” to help them settle in and ask for general information and guidance. GES will promote these links and schemes in our own induction pack from 2014.
In addition to The Concordat, the University received the ‘HR Excellence in Research’ award from the European Commission in 2010, which was renewed after review in 2012. This award highlights our good employment practices with respect to staff’s career, personal and
professional development. In addition to University level development opportunities, the College of Science and Engineering hosts a series of ‘Crucible’ workshops for early career researchers that develop a number of crucial skills, including interdisciplinary collaboration and innovation. Adequate resources are provided for career development at the University and College levels and are actively promoted to newly appointed staff members within GES. GEShas its own induction pack covering information about people and processes. We will also include links to the University provision and e-induction (Action 4.1). All new staff members at Lecturer grade or higher are provided with a mentor when starting in GES.
Within their first year they participate in the P&DR process, in which they define objectives for the upcoming year and have the opportunity to discuss career development and other issues arising. Senior-level staff members maintain an open door policy and new staff are welcome to discuss issues related to work-load, career development and promotion at anytime without going through the Line Manager or formalised P&DR process. It is significant to note that mentors are provided at the PDRA grade in HGRG, where they are not in ESRG, and this is where our highest drop-off for females occurs (see Section 3b vi), as a result the SAT will look to standardise PDRA mentoring and promote the formal mentoring systems in addition to our informal, open-door approach in order to augment support (Action 4.4).
a) (iii) Support for female students
Undergraduate students within GES are supported by their course tutors and advisors, who take an academic as well as pastoral advisor role. In addition the respective course convenors and, in the case of our final year students, the dissertation advisor also provides support. Masters students can seek advice from their advisor, course convenors and their dissertation supervisor. The first point of contact for PhD students are their thesis supervisors and GES’s postgraduate convenor. Particular issues can also be addressed during the annual
postgraduate progression interview, carried out by the postgraduate convenor and two other members of staff.
The College of Science and Engineering Graduate School offers a variety of training courses that are open to all PhD students. 62% of all PhD students at GES agree these cover their needs. Only 33% of females, compared with 69% of males agree there are sufficient career development opportunities within GES. In the postgraduate survey female PGs highlighted the importance of teaching for developing their career, noting “not enough opportunities for learning how to teach” (female PG) are provided by GES. We plan to run targeted training for PGs teaching in the classroom and fieldwork (Action 4.6). In addition female survey
respondents feel a strong professional gain from outreach involvement, however they highlight a lack of access and support within GES for this. We will increase outreach awareness, support and engagement for PGs (Action 4.7).
33 Female and male PGs find research equally stimulating however post-PhD progression is perceived as more difficult by females: “there doesn’t seem to be much opportunity beyond underpaid/temporary/job share/moving away” (female PG). 67% of female PGs state that having a family and a successful academic career is not achievable. In response, we are running gender development seminars (Action 4.2) and prompting a mentoring scheme for PGs run by PGs (Action 4.5).
6. Organisation and culture
a) (i) Male and female representation on committees
GES has a School Executive that meets weekly to discuss issues arising in GES and to horizon scan. The Executive comprises the HoS who chairs the meeting (female), Deputy HoS (female), Director of Research (male) and Director of Teaching (male), an ordinary elected member (male), HoS Administration (female) and Technical Unit Manager (female). Four females and three males.
The Research & Knowledge Exchange Committee is chaired by the Director of Research (male) along with the Head of the Human Geography Research Group (female) and the Earth Systems Research Group (male), the Director of Graduate Studies (female), HoS (female) and HoS Administration (female). Four females and two males
Learning & Teaching Committee is chaired by the Director of Teaching (male) and includes the Head of Geography teaching (male), Head of Earth Science teaching (male), Director of PGT programs (male) and Administration (female). One female and four males.
Graduate Studies Committee is chaired by the graduate convenor (female) and includes Head of PGT (Male), Head of MRes (Male), Administration (female) and student representatives from each class. Two females and two male staff. Gender of student representatives is different year on year.
Health & Safety Committee is chaired by the Technical Unit Manager (female) and comprises Lab Safety Coordinator (female), Field Safety Coordinator (female), Postdoctoral Rep (male) Postgraduate Rep (female), Technician (male). Four females and two males
We will continue to monitor committee membership by gender to maintain or improve female representation especially on key committees while also seeking to avoid
overburdening female staff. (Action 5.5)
a) (ii) Female: male ratio of academic and research staff on fixed-term contracts and open-ended (permanent) contracts
The ratio of female and male academic and research staff on fixed-term contracts throughout the last three years shows a relatively even distribution indicating the school has a gender balance on these short-term positions. The gender balance in non-permanent positions is a positive sign. However, there is a strong gender imbalance in permanent positions where males occupy between 70 to 75% of the positions. It should be noted that this is different from the situation in the early ‘90s when all earth sciences academic staff were male and only two geography academic staff were female. The SAT team will continue to monitor, assess and review the gender balance on fixed-term and permanent contracts (Action 1.4). Planned positive actions include working towards an increase in female applicants for permanent positions (where this can be helped by existing Actions 3.1, 3.2, 3.3, 4.1, 4.2) and an increase
34 in female applicants for promotions to higher positions by actively embedding promotion discussions in the P&DR interviews (Action 3.7) and female career development training
(Action 4.2). 2010 2011 2012 F % F M % M Total F % F M % M Total F % F M % M Total GES 21 38 34 62 55 21 39 33 61 54 19 35 35 65 54
Fixed Term Funding 13 46 15 54 28 14 52 13 48 27 10 45 12 55 22
Permanent Funding 8 30 19 70 27 7 26 20 74 27 9 28 23 72 32
Table 15: Number of female and male staff on part-time contracts
b) (i)Representation on decision-making committees
The Chair of the School Executive (HoS) is a member of the College Management Group and is thus involved in decision making beyond the School. The Directors of Teaching, Research and Graduate Studies likewise represent GES at equivalent College committees. Thus GES is equally represented by male and female staff at decision-making committees at College level.
b) (ii) Workload model
The workload model includes all aspects of academic endeavour from teaching in lectures, laboratories, tutorials and fieldwork, assessment, research grants, publications, knowledge exchange and outreach, student advising, SAT committee as well as some allocation for external activities such as external examining, editorial and research council or contributions to subject-specific or learned societies. Large administrative roles such as Head of Learning & Teaching or Head of Graduate School are held for four years. This duration provides the opportunity for the individual to have strategic input and yet avoids being in the role too long to risk becoming ‘type-cast’. This rotation ensures knowledge of the different aspects of GES activities is spread across the staff. We will ensure Athena SWAN activity is accounted for in the workload model and balanced with other work accordingly (Action 7.3).
b) (iii) Timing of departmental meetings and social
GES Staff meetings start at 3pm with papers circulated well in advance so everyone is aware of all matters arising and the meeting is not too protracted, thus those with care
commitments are not excluded from the latter part of meeting. Meetings do go on until a prompt finish at 4.30pm, slightly outside core hours. The SAT team will review the timings of these staff meetings starting in 2014 (Action 5.7). Social gatherings take place regularly – with a formal School coffee morning every month on Fridays at 10.30am and many informal
gatherings in discrete groups and clusters. GES’s Christmas party is in the afternoon, enabling those with caring responsibilities to attend. We consider ourselves a friendly and collegiate School that genuinely tries to respond to individual circumstances where this is possible and appropriate for both men and women. The HoS encourages members of staff to take time off from work and enjoy holiday breaks to try ensure a Work Life Balance (Action 5.8).
In the GES survey for Athena SWAN female staff members raised a range of concerns over timings of work activities, including opportunities to interact with seminar speakers, managing
35 field classes and family life in particular, the timing of email work cultures and social life male staff members tend to recognise the same issues, but are less concerned about them in the survey or tended to represent them as essential components of the job that cannot be changed. Indicative examples from female staff show some difficulties with full engagement with seminars:
There was a comment highlighting that the opportunity to interact with guest speakers at Friday seminars (4pm-5pm) and attend dinner/drinks afterwards was difficult for those with family commitments, for example picking up children from aftercare.
HGRG currently asks seminar speakers to be available for coffee before the seminar starts in order to provide networking opportunities for postgraduates and for those who cannot stay after seminar social events. The ESRG will be asked to also adopt this practice under a review of seminar series organization (Action 5.3)
Out-of-office-hours work such as field class duties are particular to GES, and these are ones which both women and men are aware of the impact on leisure and family life for staff – with only around 43% agreeing such work is family friendly or helps work-life balance. In
qualitative comments we have seen more gender divergence around the issue, with some male members of staff recognising this as a problem, but regarding it as ‘part of the job’ and inevitable. A SAT led sub-group will take action to review field class timings and staffing with a view for appropriate change (Action 5.2)
Within the GES PG survey there is a strong sense the inherent lack of work/life balance in the academy is a structural timing problem. In the qualitative replies it is repeatedly mentioned by female respondents (n=7) that the lack of a healthy and sustainable work/life balance in academia is off-putting and is discouraging them from pursuing a career in academia. At the same time, the staff survey revealed staff agreed (96%) that both women, as well as men, serve as visible, positive role models. The SAT will investigate further why there is a
disconnect between having positive female role models and a sense that a career in academia is discouraging via discussion in the AthenaSWAN@GES seminars (Action 4.2).
b) (iv)Culture
The culture of GES is broadly characterised as friendly and respectful in everyday life. >85% of staff members understand why GES is taking action on gender issues through Athena SWAN. The survey also shows GES provides female role models. Some responses do suggest evidence of a past ‘masculine’ working culture and a female staff member commented on a ‘casual masculinism’ dominating conversation and social events.
Masculinism was not just represented in the survey as something rather crude and ‘blokey’, but also something subtler that manifests in how men and women feel differently about work. In one example, a staff member perceived differences in men and women being public with their work-life responsibilities, such as being able to openly manage childcare in the office environment. Although there are female staff members who feel comfortable openly managing childcare in the office, this is not the case across the whole of GES.
A subtle masculinism was also identified in other aspects of working cultures, with examples ranging from male staff members perceived to be dominating opinion and decision-making through ‘confident talk’ at meetings to men putting themselves forward more often for
promotion. These are potentially significant issues related to the culture of GES. The SAT plan AthenaSWAN@GES seminars for women and mixed gender groups that will providing a public forum for related discussion in 2014 and beyond (Action 4.2).
36 Both men and women commented on a culture of over-work that impacts on their diverse caring responsibilities. The cultural problem of over-work is often regarded as one inherent to life in academia. This may help us explain why GES has the traditional ‘scissors plot’ where young women or mid-career women ‘look up’ and see successful women academics, but ones who are clearly working beyond normal working hours.
Although young men may be challenged by long working hours too, our survey data suggests academic jobs seem a particularly undesirable option for women with regards to work-life balance generally and family life specifically. In our PG survey only 33% of female PGs agree that having a family and a successful academic career is achievable, in comparison to 83% of male PGs. There are two possible issues to follow up on here: (1) whether flexible working can appear as ‘over-working’, if emails, etc. are being sent out of hours and (2) whether the survey can help us understand the extent of over-working further (Action 4.2 and 5.1 will help us develop more appropriate monitoring mechanisms).
It is noted that both female and male members of staff in GES have a range of non-family, non-traditional and family lives outside of work, and ones that often include a range of caring responsibilities and these might be better accommodated with the adoption of Athena SWAN guidelines and principles.
b) (v) Outreach activities
Glasgow University hosts Science Connects, which runs the STEMNET and STEMM
Ambassadors programmes for the west of Scotland. Over 1,000 STEMM Ambassadors are enrolled from the west of Scotland including: ten GES staff members (eight female) who regularly participate in outreach. This programme reaches students from primary to upper secondary level and includes science cafes that reach the wider public.
GES participates in the Glasgow Science Festival annually and in 2013 ran the ‘Earth through Microscopic Vision’ workshop for ~50 upper secondary students, which included eight staff members (50% female) and six PhD students (83% female). Individual researchers run activities at the Glasgow and Edinburgh Science Festivals, including events such as, ‘Solar System Rocks’ and ‘Acid Oceans’ (80% female). These events reach upwards of 3,000 members of the public with a bias toward school children. A number of PhD students (two females this year) voluntarily teach at the Marine Institute in Millport, UK.
GES staff and students who participate in outreach frequently feature in the monthly GES Newsletter and Twitter feed. Outreach is typically completed within core hours and deemed part of a staff member’s workload. While outreach is not a specific criterion for the
University’s promotion guidelines, outreach does add an aspect of esteem, communication, networking and fulfilment of impacts on research grants that are widely considered beneficial and encouraged within GES. Outreach activities help raise the profile of women working in academia and in GES.
37
Figure 23: Staff survey response about the perception of the value placed on outreach activities
The survey results (Figure 23) show only 42% of females and 50% of males believe outreach is valued and acknowledged within GES, while 24% of all staff members are neutral, which may suggest GES’s position on the value of outreach is not transparent. This is further highlighted in Figure 24.
Figure 24: Staff survey response about whether or not outreach activity is a criterion for promotion
Figure 24 shows there is much more ambiguity to the role outreach plays in the promotion process (Action 3.6) with 50% of females and 30% of males remaining neutral.
0 26 16 26 11 5 16 0 33 17 22 6 11 11 0 5 10 15 20 25 30 35 % of Females % of Males 0 17 11 50 6 17 0 0 33 6 33 6 22 0 0 10 20 30 40 50 60 % of Females % of Males