Marion Koelle, Patrick Lindemann, Tobias Stockinger, and Matthias Kranz (Editors)
Human-Computer
Interaction with
Augmented Reality
Advances in Embedded Interactive Systems
Technical Report – Summer 2014
Volume 2, Issue 4. ISSN: 2198-9494
Human-Computer Interaction with Augmented
Reality
Marion Koelle, Patrick Lindemann, Tobias Stockinger, and Matthias Kranz
October 2014
Contents
Preface
4
A brief Introduction to Augmented Reality
5
Prisca Bonnet, Pierre Ducher, and Alexander Kubiak
Evaluation of Augmented Reality in the Field
7
Alexander Kubiak
Evaluation of Augmented Reality Applications in a Laboratory
Context
15
Prisca Bonnet
Interaction with Augmented Reality
23
Pierre Ducher
Copyright Notes
30
Preface
Augmented Reality (AR) enhances the user’s view of the world with
computer-generated information. While the research field of Augmented Reality recently
made great progress in terms of tracking accuracy and rendering quality, human
factors often play only a minor role in the development process of Augmented
Reality applications. Nevertheless, there is an increasing number of developers
that create AR applications. We try to satisfy their needs for design
guide-lines, recommendations and best practices by providing spotlights on selected
applications and highlighting the relevant recommendations.
This technical report gives a brief introduction to Augmented Reality, and
provides an overview of user-centered research methods that are available to
Augmented Reality development as well as interaction methods and technologies.
During the summer term in 2014, the Embedded Interactive Systems Laboratory
at the University of Passau encouraged students to conduct research on the
general topic of “Human-Computer Interaction with Augmented Reality”. Each
student analyzed a number of scientific publications and summarized the findings
in a paper.
Thus, each chapter within this technical report depicts a survey of specific aspects
of a topic in the area of human factors in Augmented Reality.
Passau, October 2014
The Editors
Marion Koelle, Patrick Lindemann, Tobias Stockinger, and Matthias Kranz
A Brief Introduction to Augmented Reality
Prisca Bonnet
Universität Passau
[email protected]
Pierre Ducher
Universität Passau
[email protected]
Alexander Kubiak
Universität Passau
[email protected]
ABSTRACT
In this report, we briefly introduce Augmented Reality (AR). Besides presenting the definitions of AR by Azuma and Milgram, this paper lists challenges introduced by human factors like discoverability or interpretability. Furthermore, technologies for AR are examined, presenting different AR devices and technical challenges.
Keywords
Augmented Reality, AR, Mixed Reality
1. INTRODUCTION
Today more than ever people have a lot of information at their disposal. Presenting these data to the user is not an easy task, one must be careful not to overwhelm him with them. Augmented Reality proposes a way to mix in-formation with the real environment world by using differ-ent techniques. By blending data with a live view of the real world, we can better integrate them and make it feel more natural for the user. To embed information into the real environment, the most accessible and used solution is using a smartphone and its camera. However this is only one possibility. Other scenarios might require different means to display information. There are two categories: mobile and stationary AR systems. For mobile systems, the device can be worn or hand held. Stationary systems usually have a surface, like a table, to interact with them.
We will have a more formal definition of Augmented Re-ality in the next part, followed by the state of the art in part three. Finally, we will discuss the human factors in the conclusion.
2. DEFINITION
In 1997, Azuma defined Augmented Reality (AR) in his survey [1]: A system delivers AR if following characteristics are satisfied: The real environment is combined with a vir-tual one, the system is interactive in real time and registers
• Prisca Bonnet, Pierre Ducher, and Alexander Kubiak are master’s students at the University of Passau, Ger-many
• This research report was written forAdvances in Em-bedded Interactive Systems (2014), Volume 2, Issue 4 (October 2014). ISSN: 2198-9494
in 3D. In contrast to other definitions this allows AR systems to use other technologies besides Head-Mounted Displays [1]. While Furht and Carmigniani define AR as enhancing the real environment by adding virtual information [4], Azuma’s definition also includes applications that remove real objects from the environment.
Already three years earlier, Milgram and Kishino defined a Reality-Virtuality Continuum spanning between the real and virtual environment creating a Mixed Reality in [7] as shown in Fig. 1.
Mixed Reality (MR) Real
Environment Reality (AR)Augmented Virtuality (AV)Augmented EnvironmentVirtual
Figure 1: Milgram’s Virtuality Continuum based on the definition in [7]
As shown in Fig. 1, Mixed Reality also contains the Aug-mented Virtuality (AV). While AR enhances the real envi-ronment by adding virtual objects, AV adds some real ob-jects to a virtual environment [7]. Figure 2 shows an exam-ple of an AR application meeting Azuma’s definition. The application combines the real world, registered in 3D with virtual addons and reacts to interactions in real time.
Figure 2: Example of an AR application [8]
When it comes to developing mobile AR applications, there are not only the definitions of Azuma and Milgram to be considered. Also, human factors present the follow-ing challenges [6]: The first challenge is discoverability as many users may not be aware of what services are
avail-able. The application needs to assist the user by showing e.g. hints. The next challenge is the interpretability of the virtual objects by having clear meanings. Another impor-tant challenge is the usability by providing easy learnability and usage of the application. Also, the usefulness of an ap-plication is important, meaning the apap-plication offers a long term value [6]. An example of usefulness would be the use of AR for navigation instead of advertisement.
3. TECHNOLOGIES FOR AR
Augmented Reality can be applied to a variety of domains is a vast domain, using different types of devices. In this section, we will describe the different devices and methods mostly used in AR, and the technical challenges they raise.
3.1 Devices in AR
We can distinguish two main groups of devices used in Augmented Reality applications. First, there are fixed de-vices, that can be used in museum or public places. They can consist of screens, pedestal-mounted binoculars or pro-jectors displaying images directly on physical objects [3]. Second, mobile devices can be carried by the user. The most widespread devices are hand-held devices such as smart-phones and tablets, but head-mounted displays are getting more and more popular, with the commercialization of data-glasses such as Google’s Glass.
In AR, devices can be either optical see-through or video see-through [2]. Optical see-through devices consist of a semi-transparent screen, on which information is overlaid to appear as if it was part of the real world. Dataglasses or fixed transparent screens usually are optical see-through. Video see-through devices capture the scene using one or several cameras, add virtual information on the recorded image, and display it to the user. Most hand-held devices are video see-through.
3.2 Challenges in AR
Depending on the type of device, AR applications are fac-ing several technical challenges [4]. Most applications usfac-ing mobile devices are based on computer vision techniques, in order to analyze a scene before adding corresponding virtual information. Computer vision is a vast and complex field, and the algorithms still have to be improved. Besides, the algorithms used in AR have to be very effective, in order to minimize the latency. AR applications often use one or more tracking technologies to determine the user’s absolute position, or his relative position to an object. To this end, the application can use GPS data, based or marker-less tracking [5]. AR applications often rely on other data, such as compass, gyroscope or voice commands. The quality of a given application will depend on the precision of those sensors, which can cause accuracy and latency issues.
4. CONCLUSION
We have seen that with the rise of better and more ef-ficient technology, Augmented Reality is now possible. It could change and improve the everyday life of everyone [4]. Nevertheless, wearing a computer equipped with sensors all day can rise some concerns. To achieve good information quality, we need to share some personal information with the device, thus causing privacy issues. Also, communica-tion with the device may seem unnatural to most as we
normally don’t speak to computers. For this reason we need better interfaces increasing the need for more sensors, so that we can interact more naturally with computers. To ful-fil this latter goal, devices may have an integrated camera potentially filming what is in front of the user. This is also a concern of the citizens. They are not keen to have this kind of technology being used around them, especially because of privacy issues. All of these questions will need answers before Augmented Reality becomes more popular.
5. REFERENCES
[1] R. Azuma. A survey of augmented reality.Presence, 6(4):355–385, 1997.
[2] R. Azuma, Y. Baillot, R. Behringer, S. Feiner, S. Julier, and B. MacIntyre. Recent advances in augmented reality.Computer Graphics and Applications, IEEE, 21(6):34–47, 2001.
[3] O. Bimber and R. Raskar.Spatial augmented reality. Peters, 2005.
[4] B. Furht, editor.Handbook of Augmented Reality. Springer, 2011.
[5] Y. Genc, S. Riedel, F. Souvannavong, C. Akinlar, and N. Navab. Marker-less tracking for ar: A learning-based approach. InMixed and Augmented Reality, 2002. ISMAR 2002. Proceedings. International Symposium on, pages 295–304. IEEE, 2002.
[6] W. Huang, L. Alem, and M. A. Livingston, editors.
Human Factors in Augmented Reality Environments. Springer, 2013.
[7] P. Milgram and F. Kishino. A taxonomy of mixed reality visual displays.IEICE TRANSACTIONS on Information and Systems, 77(12):1321–1329, 1994. [8] Wikimedia Commons. Augmented GeoTravel.
http://commons.wikimedia.org/wiki/File:
Augmented_GeoTravel.jpg, 2010. (accessed August 28, 2014).
Evaluation of Augmented Reality in the Field
Alexander Kubiak
Universität Passau
[email protected]
ABSTRACT
While there already exist several surveys analyzing the eval-uation of usability of Augmented Reality (AR) applications, most reviewed papers did not conduct any field studies. Therefor, this work reviews papers in the context of AR that conducted field evaluations. With usability becoming the central goal in the design process, field studies become more important to evaluate the user experience under real conditions. To integrate evaluation in the design process, new techniques will be required. This paper also lists meth-ods describing how to make usability the central goal in developing AR applications.
Keywords
Augmented Reality, AR, Field Study, User Experience, Us-ability, Evaluation
1. INTRODUCTION
With modern technology, AR is becoming more popular. As it is still a considerably new domain, especially for the users, research about user experience is still in its infancy [24]. Nevertheless, to make AR applications more attractive, user experience should be a central goal and design strategy [24]. To identify usability problems early in the develop-ment, user testing is required. Studies show that usability evaluation is rising [3, 8]. However, most usability evalua-tions are conducted in the laboratory [7, 24].
While testing the performance and system functionality in the laboratory is good practice, evaluating the usability and user experience should be conducted in the field. Even though analyzing the usability in the laboratory is less time consuming and more cost-effective [15, 22], more usability problems are found in the field [7, 22, 27]. An important factor is the increased cognitive load in the field compared to the laboratory [7, 22, 23] which cannot be simulated.
Fortunately, field studies become more popular as big companies start investing into AR technology. Especially
• Alexander Kubiak is a master’s student at the Univer-sity of Passau, Germany
• This research report was written forAdvances in Em-bedded Interactive Systems (2014), Volume 2, Issue 4 (October 2014). ISSN: 2198-9494
VW and EADS invest in big projects like ARVIKA [5, 10] and AVILUS [28] to use AR in the manufacturing process. This shows that AR is past being of interest for research ex-clusively. Not only the industry invests in AR. The military also starts using AR for their purposes [11, 12, 13]. Those projects do not only help advancing the technology used in AR, by using user-driven development and new methods like Wizard of Oz and field evaluation, they also set examples how to create good AR systems.
The paper is structured as follows: Chapter 2 lists re-lated work evaluating usability of AR systems and compar-ing laboratory vs. field studies. Chapter 3 lists techniques how evaluation can be integrated into the design process of AR applications by applying traditional HCI principles or by using new approaches like the Wizard of Oz. In Chapter 4, papers conducting field studies will be reviewed. Finally, Chapter 5 presents a summary of the topic.
2. RELATED WORK
In this section, related work will be listed. It is divided into two parts. In Section 2.1, surveys analyzing the usabil-ity evaluation in different papers will be described. Section 2.2 reviews papers comparing usability evaluation in the lab-oratory vs. in the field and arguing about the importance of field studies.
2.1 Surveys
D¨unser et al. [8] published a survey of user evaluation techniques used in AR. They reviewed all papers published between 1993 and 2007 evaluating AR applications. Over-all, they identified 165 papers which were grouped in the following categories: perception, user task performance and collaboration. Furthermore, the papers were categorized ac-cording to the user study approaches. However, most papers mentioned did not conduct field studies.
Bai and Blackwell [3] review usability evaluations of pa-pers published in ISMAR between 2001 and 2010. They identified 71 papers which were grouped in the categories task performance, perception and cognition, collaboration and finally user experience. The categories were adopted from [8] and extended by user experience. For each category, the authors analyzed common metrics used to measure the category’s goal. Also, the authors analyzed the evaluation approaches and challenges. Similar to [8], most papers men-tioned did not conduct any field studies. Still, this paper is the basis for Chapter 4 as the evaluation approaches are
also grouped in the suggested categories.
Olson and Salo present experiences of mobile AR applica-tions in [24]. Conducting an online survey, they explored the user experience of applications available in 2011. Users gave mostly narrative feedback about their experiences, for exam-ple when using Google Goggles which was renamed Google Glass. While the paper does not present other work about evaluating user experience, it summarizes common experi-ences and discusses design considerations for future work. Also, the paper lists different measurements for user expe-rience and states that user expeexpe-rience is becoming a central goal and design strategy.
2.2 Lab vs. Field
To analyze the use of usability testing in the field, several papers discussing evaluation in the laboratory vs. in the field were published. Kjeldskov et al. [15] present a mobile system to support planning and conducting work tasks in a hospital. The system was evaluated in both the labora-tory and the field. The authors argue that a study in the laboratory is less time consuming and more cost-effective as transportation cost do not exist and observation of the par-ticipants is a lot easier. Cameras can be mounted to the ceilings allowing different angles of view. Also, the partici-pants can focus more on the system instead of other tasks that arise in the hospital. The authors conclude that lab-oratory testing is cheaper, easier and finds more usability problems than field testing.
In contrast, Nielsen et al. [22] and Rogers et al. [27] both conclude that field testing is ”worth the hassle”, meaning that even though it is more expensive and time consuming, field studies reveal more usability problems. While [22] is a direct reply to [15] by evaluating and discussing the results of both laboratory and field studies, [27] argues in a more informal way.
Nielsen et al. [22] compare the two approaches by evalu-ating a mobile system which is usually used by skilled work-ers to register the use of equipment, materials, mileage and time. The system consists of a mobile phone and a scanner attached to the phone. As mentioned before, the authors argue that testing in the field found more usability prob-lems than testing in the laboratory. While the laboratory evaluation revealed 48 problems, field testing detected 60. An important remark is that only field evaluation was able to identify usability problems related to cognitive load and interaction style. This goes well with Nunes and Recarte [23]: In their paper, they state that there exists an inverse relationship between cognitively demanding activities and visual processing capacities.
Similar to [22], the authors of [27] also argue that field testing reveales more usability problems. Rogers et al. [27] present a system for scientists and students to observe the growth of a freshly planted forest. While the laboratory testing, conducted by environmental scientists, could not reveal usability problems, the field study performed by stu-dents found several problems using the system. As in [22], a large factor was the increased cognitive load in the field. The authors conclude that despite the difficulty of collect-ing observations for analysis, for example in form of video
recordings, the field study reveals a lot more usability prob-lems than the laboratory evaluation.
The biggest difference found between laboratory and field testing was presented by Duh et al. [7]. They conducted an evaluation of the common use of a mobile phone, like calling or messaging other people. With 171 problems found, the field test revealed nearly twice as many usability problems as the laboratory test with 92 problems. When it comes to critical problems which prevent participants from complet-ing tasks, the difference was even more severe: Field testcomplet-ing revealed 64 critical problems while testing in the lab only found 12. Aside from higher cognitive load as argued above, users also stated the lack of privacy and the noise level in the field as possible reasons for the different amount of revealed usability problems.
Concluding can be said that field studies usually reveal more usability problems, especially problems caused by in-creased cognitive demands that are very hard to be simu-lated in a laboratory. However, the evaluation in the field is more expensive and time consuming as recording the partici-pants for analysis after the testing is difficult. Also, common practices used in the laboratory as thinking aloud might be difficult to apply in the field as there are many other people nearby and there is more noise. Furthermore the equipment has to be transported to the field which also increases the cost and time usage.
3. EVALUATION
IN THEDESIGN PROCESS
As user experience and usability become the central goal in AR applications [24], it is important to model them as early as in the design process. While user experience in AR is still in its infancy [24], design goals for HCI exist. D¨unser et al. [9] identify fundamental differences between traditional GUI systems and AR systems: GUI guidelines assume that the user uses mouse, keyboard and a screen to interact with the system. However, these typically do not exist in AR. There are numerous other possible interactions between the user and an AR application. Also, while tradi-tional HCI guidelines for interfaces work in 2D, AR registers and often displays information in 3D [1].Lacking guidelines for user interfaces in AR, applications are often developed using rapid prototyping to allow eval-uation to be a recursive activity during the entire design cycle [2]. One approach is using the Wizard of Oz. After discussing the use of HCI techniques and principles in AR in Section 3.1 and showing a model for usability engineer-ing applied to AR in Section 3.2, the Wizard of Oz will be introduced in Section 3.3.
3.1 HCI Techniques & Principles in AR
As mentioned above, there exist many HCI guidelines for GUI user interfaces. However, these cannot easily be ap-plied to AR as information is registered and displayed in 3D [1] and AR incorporates other means of interaction [9]. Several papers propose using HCI techniques in AR. D¨unser et al. [9] introduce the following common design principles for AR allowing the development of applications with better usability and user experience:
con-nection between a user interface and its functions. This can be achieved by providing a model describing subject-object relationships.
Reducing cognitive overhead to allow the focus on the actual task instead of overwhelming the user with in-formation resulting in poor user experience.
Low physical effort to make a task accomplishable with a minimum of interaction steps. Applications with in-teraction that is too complex will not be successful.
Learnability to provide easy learnability for a user. As AR provides novel interaction techniques, the usage of those techniques has to be easy to learn.
Responsiveness to guarantee good performance of the ap-plication as users only tolerate a certain amount of system lag [35].
Error tolerance to deliver stable applications. As AR sys-tems are mostly in early development stages there ex-ist many bugs. Applications should be able to continue working even when experiencing an error.
While above principles are just some desirable design prin-ciples to be integrated into the design process of an AR sys-tem, Swan and Gabbard [30] discuss the usage of traditional HCI methods in AR. In their opinion, methods like domain analysis, user needs, task analysis and use case development can easily be applied to AR. However, those methods only determinewhat information need to be presented to users, nothow these information should be displayed.
3.2 Usability Engineering in AR
Gabbard et al. [11] describe how to use usability engineer-ing for AR systems. This allows the reduction of usability problems already in the design process. They propose an iterative process consisting of the following phases as shown in Figure 1. 1. Domain Analysis 2. User-Centered Requirements 3. Conceptual User Interaction Design 4. Rapid Prototyping 5. Usability Engineering Analysis & Design Development Evaluation
Figure 1: Usability Enginnering as proposed in [11]
As it can be seen in Figure 1, the model consists of five phases that can easily be re-iterated. The following describes the purpose of each phase:
Domain Analysis to specify the system domain by ana-lyzing which users attempt to perform which tasks.
User-Centered Requirements to specify the user inter-action with the system.
User Interaction Design to design user interactions.
Rapid Prototyping to implement user interaction designs.
Usability Evaluation to evaluate the usability.
Based on an application for the military, the authors fo-cused on the domain analysis to show the difficulties of de-veloping good AR applications. They state that user profiles sometimes are generated using surveys. However, with new AR applications the actual end-use population may not be easily definable or reachable [11]. They state that a user profile should include information about a user, such as the amount of computing or AR experience.
By studying military books and manuals the authors iden-tified around 100 tasks that could be enhanced by using AR. For each task they analyzed how the AR system could sup-port perceptual and cognitive demands. As they identified a list of features that cannot be delivered by existing AR systems, the authors want to conduct more research before continuing the development. This shows that the process of usability engineering identified problems that have to be solved first instead of creating prototypes that will not de-liver satisfactory usability.
3.3 Wizard of Oz
To evaluate the user experience and usability of a system, rapid prototyping is helpful as design flaws are revealed early in the development. One promising approach is the usage of Wizard of Oz. In this approach, a wizard usually simulates either some part of the model or the complete envisioned in-terface [6]. Therefor, a first prototype can be evaluated very early in the design process, even when it is not clear what the underlying technology should be [6]. The wizard then works as controller by simulating unbuilt system components.
Later in the development the wizard can also be used as supervisor controlling the system, still able to override deci-sions made by either the system or the user. The wizard can be a moderator as well which lies between the controller and supervisor. This role is used when a component is already working but not trusted [6]. The advantage of the modera-tor is that it can override the component’s output before it reaches the rest of the system.
The Wizard of Oz is often applied by using persons as “wizards”, triggering events with a remote or a controller application when the participant arrives at some point or activates an event. This approach is used in [6] and [20].
Even though the wizard helps conducting more realistic evaluations, the awareness of it or incorrect behavior can corrupt an evaluation and compromise the results [19]. How-ever, as user experience is becoming the central goal of the design process [24], early evaluations are very important. Without the usage of the wizard, the system, early in its development, might behave unexpectedly and contain many bugs. Therefor, the Wizard of Oz is a great method for developing AR applications as its usage allows very early usability evaluations.
Examples
Dow et al. [6] use this approach to develop a system for cre-ating a mixed reality on a cemetery by using location-based audio recordings. They showed how well the Wizard of Oz approach works with the iterative design as they developed and implemented the system in three stages. While the first
stage used the wizard as controller, the second stage only re-quired a moderator whereas the last stage used the wizard just as supervisor.
The authors used the Wizard of Oz approach to perform early evaluation of the content the users could listen to as well as of the interface. During the iterations, they did not only improve the Mixed Reality system but also the inter-face for the Wizard of Oz controller.
Friedrich [10] introduces ARVIKA, a large project to use AR for development, production and service in the industry. The pilot project, sponsored by the German ministry of Ed-ucation and Research and big companies like VW, EADS, Siemens and others, also used the Wizard of Oz to include concepts in the tests that have not been implemented yet. Therefor, test persons have been able to evaluate the system very early in the development.
M¨oller et al. [20] present different user interfaces for in-door navigation using a mobile phone. They implemented AR as well as Virtual Reality to evaluate the user expe-rience. The navigation mechanism was also implemented using the Wizard of Oz approach. In contrast to above sys-tems, the wizard was used to modify the accuracy of a user’s position as well as guaranteeing comparable conditions for all participants. To do so, a Wizard of Oz app was built to control the instructions shown on the participants’ devices. Also, the control application sent location information to the participant’s device. Each participant was followed by a researcher operating the control application.
4. EVALUATION IN THE FIELD
Evaluating AR in the field is still not very common. Kjeld-skov et al. [15] state that field evaluation is very expensive and time consuming. Even though the actual evaluation sessions took less time in the field, the overhead in plan-ning and transporting requires many man-hours, resulting in higher costs. Also, recording is difficult in the field as cameras cannot be mounted to walls or ceilings.
Most of the papers conducting field studies mainly eval-uate usability and user experience. The success of an AR application depends a lot on the user satisfaction. Therefor, user experience is not only a central goal, it is also a design strategy [24]. This was already discussed in Chapter 3. Ols-son and Salo [24] state that user experience research is still in its infancy.
Bai and Blackwell [3] and D¨unser et al. [8] both catego-rize published papers in terms of their evaluation. In both, papers that conduct usability evaluation have been grouped according to categories introduced by Swan and Gabbard in [30]. In [3], these categories are extended by user experience. The following list describes the categories adopted from [3] that are also used in this paper.
Task Performance to evaluate the user accomplishments when using the system.
Perception and Cognition to understand how perception and cognition work in AR.
Collaboration to evaluate the interaction of multiple users.
User experience to evaluate the user’s subjective feelings.
As most of the papers cited in [3] and [8] did not conduct any field studies, the following sections describe the results found by Bai and Blackwell in [3] as well as results of an own research in the context of AR and field evaluation.
4.1 Task Performance
This section describes papers evaluating task performance. As seen in [3], the task performance is always measured in time. Usually the time to complete a task is measured. An-other metric for the performance is accuracy, which is used in 63% of the papers according to [3]. Furthermore, the er-ror rate is used to measure the performance, as a system works better if the user makes less errors. This metric is interchangeable with accuracy which increases if the error rate decreases.
Most of the papers listed in [3] did not conduct field evaluations. Listed below are papers cited in [3] that per-formed field studies as well as the results of an own research which evaluated the user task performance by conducting field studies.
Schwerdtfeger et al. [29] introduce an AR system to as-sist workers in a warehouse. Using head-mounted displays, the worker will be guided to the correct box and shown the amount of its content to be picked. The AR system was compared to the common paper approach. When evaluat-ing the field study, the authors used error rate and pickevaluat-ing time as measurements for performance. To observe the par-ticipants, they used a special observer who was placed on an observation deck above the experimentation area. The observer analyzed each step the participant did.
Besides measuring performance, the field test also evalu-ated the subjective strain using the NASA-TLX test and the user experience by questionnaire which will be described in Section 4.2 and Section 4.4.
Similar to [29], Henderson and Feiner [12, 13] also used completion time and error rate to evaluate their AR system for task localization in maintenance of an armored personnel carrier turret. The system was evaluated in field conditions with six participants. The evaluation purpose was not only to evaluate the AR system but also to compare it to a system only using a LCD display showing the next steps. Besides completion time and error rate, the authors also used local-ization time analysis to measure the performance. However, they did not describe how the observations were made.
In addition to measuring the task performance, the field study also evaluated the user experience using a formal ques-tionnaire. This will be described in Section 4.4.
Kjeldskov and Stage [16] also used completion time to evaluate task performance. Instead of error rate, they used accuracy which can be interpreted the same way. The au-thors introduce new techniques to evaluate the usability of mobile systems. They conducted two experiments consid-ering mobile messaging on phones. The goal was to com-pare different scenarios like walking on a treadmill or walk-ing outside next to other pedestrians. To identify usability problems, evaluations were initially recorded on video to be analyzed by experts afterwards. As the authors found col-lecting high-quality video data in the field to be very diffi-cult, they only recorded audio for the second experiment and took written notes. This resulted in a lack of detailed data.
The authors state that because of recording the participant’s actions, it was difficult to experience realistic pedestrian mo-tion as other pedestrians tended to move away [16].
Besides measuring task performance the authors also an-alyzed the work load which will be described in Section 4.2. Completion time was also used by Morrison et al. [21] to evaluate the task performance. They present a mobile AR game using paper maps and overlay information on screen. They conducted several evaluations with the third one being a field study. Participants were asked to take photos for completing tasks. Besides measuring the completion time, the authors also counted the photos taken and grouped them by task-related and non-task-related. To collect the data, each team was accompanied by a researcher taking notes, photographs and videos.
Additionally, the authors also evaluated collaboration and user experience. The results will be analyzed in Section 4.3 and Section 4.4.
Concluding can be said that the metrics used to evaluate task performance in the field are very similar to the findings presented in [3]. In every paper the task completion time is measured and analyzed. The usage of error rate or accuracy is also very common. Combined with task completion time this shows the effectiveness of a system.
While field evaluations conducted indoors allow good ob-servations similar to laboratory evaluations, researchers test-ing their applications in the outdoors found collecttest-ing high-quality video recordings very difficult [16]. Therefor, they often used written notes or photographs which however lack of detailed data.
4.2 Perception and Cognition
To measure perception and cognition, Bai and Blackwell [3] found that common measures are depth and occlusion perception, display technology, virtual information layout and registration error. Also, time and accuracy are used in half of the presented papers. However, in this category, all papers listed in [3] did not conduct any field studies. There-for this section only contains papers of an own research.
Schwerdtfeger et al. [29] conducted a cognition evaluation as well. The paper that was introduced in Section 4.1. To evaluate the cognition, the authors used the NASA-TLX to analyze the task load and compare it to the approach not using AR. For this purpose, the heart rate variability was an-alyzed by making participants wear a pulse recorder. Their study showed that the task load is higher when using AR, but the difference is not significant. Also, they report about users having problems using the head-mounted display, es-pecially with focussing. This shows that the perception of the system did not work as well as expected.
As the heart rate was measured with a pulse recorder, the analysis was not more difficult than it would have been in the laboratory.
Kjeldskov and Stage [16] also used the work load to evalu-ate cognition by performing a NASA-TLX test immedievalu-ately after each evaluation. Therefor, the evaluation was not more difficult than it would have been in the laboratory. The pa-per was already presented in Section 4.1. As they evaluated the impact of movement on the ability to perform a task, the
work load indicates that the perception of the application is reduced when the user is moving.
In contrast to [16] and [29], Henderson and Feiner [12, 13] did not use the work load to evaluate cognition. Instead, they measured the head movement. In their paper which was presented in Section 4.1, they described that partici-pants had to wear a head band to collect the tracking data. As they compared their AR system to an LCD approach, the amount and degree of head movements is an indicator for the user’s perception. They stated that the AR system had less movement in nearly all tasks.
Perception and cognition can also be evaluated informally, as conducted by Hile et al. [14]. They present an application for a mobile phone using AR to navigate pedestrians. To de-termine a user’s position, they use geotagged photographs. The navigation was performed either using a 2D map or by showing floating arrows on images to direct the user. To evaluate the system in a field study, an informal study was performed by evaluating the participants’ user experience in semi-structured interviews. Participants complained about missing depth of arrows making the instructions not clear.
Summarizing can be said that there is no common mea-sure for evaluating perception and cognition. While the work load can be evaluated formally by using the NASA-TLX and is often applied, it is only a good indicator for cogni-tion when comparing different systems. Evaluating the work load in the field does not seem to be more difficult compared to evaluation in the laboratory, as it is either measured us-ing pulse recorders or evaluated usus-ing the NASA-TLX test immediately after each test.
Perception can also be evaluated using informal inter-views where users express their experience which then can be traced back to perception or cognition.
4.3 Collaboration
In [3], the papers grouped in this category usually mea-sured collaboration with awareness and ease of use. As al-ready in Section 4.2, the papers listed in [3] did not conduct any field studies. The following two papers evaluated col-laboration very informally.
Wagner [32, 33] presents an invisible train game using AR. The game consists of a real miniature wooden train track and PDAs simulating the trains. Users are able to operate junctions and control the simulation. Collaboration was evaluated informally by conducting unsupervised field tests. Researchers could observe users passing around the PDAs and explaining the game to each other. This showed the ease of use of the application as users could easily ex-plain it to each other. Also, unstructured interviews were conducted with some users.
A similar approach for evaluating collaboration was used by Morrison et al [21]. In their paper which was presented in Section 4.1, they state that the application itself did not require collaboration. However, as the field study was con-ducted in teams, the authors observed team members inter-acting to use the application efficiently.
It can be seen that collaboration is not evaluated fre-quently. While Bai and Blackwell [3] just found 9 papers
evaluating collaboration, an own research only resulted in two papers. Both presented an informal evaluation of col-laboration by just observing the participants or interviewing them afterwards.
4.4 User Experience
The evaluation of user experience is split into formal and informal evaluation, similar to [3]. Formal evaluation mostly uses a quantitative approach by using structured question-naires or interviews, the informal evaluation uses a qualita-tive approach allowing users to communicate their feelings about the application.
While the performance of field studies is usually more dif-ficult than laboratory testing, the evaluation of user expe-rience in the field can similar to the evaluation in the lab-oratory. As the evaluation is mostly performed by using questionnaires and interviews, there is no difference between laboratory and field. However, observing users in the field which is often used when conducting informal user experi-ence evaluation, is more difficult.
4.4.1 Formal User Experience
In addition to evaluating task performance and cognition, Schwerdtfeger et al. [29] also evaluated user experience. The paper was presented in Section 4.1. By conducting question-naires using the Likert scale and semi-structured interviews, they formally evaluated the user experience, particularly the discomfort of using the system. For example, using the AR system caused more headache or other discomfort concern-ing eyes compared to the paper system. As the observer was standing on a platform above the participant, recording and analyzing the user’s actions was simple.
Henderson and Feinder [12, 13] evaluated the user experi-ence as well. Similar to Schwerdtfeger et al. [29], they used questionnaires with Lickert scale. This paper also was pre-sented in Section 4.1. To determine the ease of use, the sat-isfaction level and intuitiveness were evaluated using ques-tionnaires. The authors found that the LCD system is easier to use, while the AR system is more satisfiable. For intu-itiveness both systems were tied.
Instead of a questionnaire using the Likert scale, Walter-Franks and Malaka [34] used the System Usability Scale to evaluate the user experience. Furthermore, they conducted a structured interview. They present a pedestrian navigation application using AR and photos. To navigate a pedestrian, the system uses GPS to locate the user. Then, the user is navigated using pre-recorded images augmented with ar-rows showing the directions. A field study was conducted to compare the AR navigation mode to a 2D map. While the questionnaire showed a better user experience using the AR system, the interviews revealed usability problems for all modes that were evaluated.
It can be seen that formal evaluation of user experience is usually performed by using structured questionnaires and in-terviews. Formal questionnaires mainly use the Likert scale or the System Usability Scale to evaluate the user experi-ence. Interviews can also be formal by structuring them with questions expecting clear answers. Usually an open question is added at the end to allow the user to comment on usability issues not covered by the previous questions.
4.4.2 Informal User Experience
Hile et al. [14] evaluated user experience using semi-structured interviews. The paper was already presented in Section 4.2. By analyzing the interviews, the authors evalu-ated the usage patterns, learned about confusion while navi-gating and received suggestions for improvement. Also, they received feedback about the satisfaction of the users. They conclude that most participants would use the AR system instead of a common map if given the choice.
Completely unstructured and informal interviews were used by Wagner [32, 33] to evaluate the user experience. The papers which were presented in Section 4.3 state that no specific or predetermined sets of questions were asked [33]. Still, those interviews helped to learn about the usability and improve the system. Also, user experience could be ob-served unsupervised as visitors passed around the devices and explained the usage to each other.
Aside from interviews, Miyashita et al. [18] also used ques-tionnaires, observations by the museum staff and analysis of action logs to evaluate the user experience. They present a system to enhance museum visits with AR. Augmentation had two functions: Providing background knowledge to art-work as well as guiding a visitor through the exhibition. The observations showed that the text displayed on the device is often too small and the brightness to low. Also, the device is too heavy for many users. Interviews confirmed the ob-servations. Still, users admitted that the system motivated them to examine the artwork more closely.
Rakkolainen et al. [26] used interviews to evaluate the user experience as well. Furthermore, the participants were asked to think aloud during the evaluation which was recorded for further analysis. The authors introduce a navigation sys-tem for pedestrians using AR with a handheld device. As the paper compares different models, the usability study de-termined that users prefer the 3D model combined with a map rather than 3D only or map only.
Using simple feedback by users was the choice of Pasman et al. [25]. They built a system to display large 3D models on a handheld device using AR. The purpose of their sys-tem is to simulate the presence of a large 3D model, e.g. a building outside or a sofa inside. In a field study the sys-tem was tested. Aside from determining problems with the tracking system and the brightness of the display, the field test showed that the building being rendered at the actual site was appreciated by the users. However, the authors do not describe if the evaluations were conducted using inter-views, questionnaires or recordings.
A similar approach was used by Thomas et al. [31]. They introduce an AR implementation of the game Quake. Using the system, the campus of the University of South Australia was turned into a level of the game. The system was eval-uated with an informal user study as the participants were asked how they felt about the system. Users commended the ease of use of the system but complained about the lag which made it difficult to aim at the monsters. Many users also found bright lightning to make it difficult to see through the display. As earlier, the authors do not describe how the participants’ feelings were evaluated.
Bartie and Mackaness [4] evaluated the user experience using interviews and logs of dialogues between the user and the system. They present a speech-based system to help the user explore a city. The user wears a laptop in a backpack and communicates with the system by using speech com-mands. Using GPS, the system locates the user and gives information about what buildings the user can see. If de-sired, the system also gives additional information about a building. As the system was running on a laptop carried in a backpack, data logging was easy. The evaluation of the logs revealed some problems addressing the performance. The informal user feedback collected in interviews also revealed possible improvements.
Solely interviews were used by Kray et al. [17] to evaluate the user experience. They introduce a mobile navigation sys-tem for pedestrians using mobile phones to display routing information. The interviews were used to collect the opin-ions of the users. Even though the attitude towards the sys-tem was positive, interviews showed that users complained about the slow usage of 3D maps. Also, the interaction be-tween 2D and 3D maps did not work well.
Concluding can be said that informal evaluation of user experience is mostly conducted using interviews or feed-back. The interviews are often unstructured using open questions. Also, observations help evaluating the user expe-rience. In [18], the interviews mostly confirmed the observa-tions. When conducting informal evaluation, interviews are usually recorded and analyzed afterwards to extract the us-ability flaws. As seen in [4], logging can also help identifying usability problems. Especially if the field test takes longer than just a few minutes, users probably will not remember all usability problems they detected.
5. CONCLUSION
Even though usability evaluation of AR applications is ris-ing [3, 8], field studies are still not common. Most papers reviewed in [3, 8] only evaluate usability in the laboratory. However, several papers comparing laboratory vs. field eval-uation show that field studies reveal more usability problems [7, 22, 27]. They conclude that even though field testing is more expensive and time consuming, it is worth the effort and cost.
As usability becomes more important, user experience should be a central design goal [24]. To allow user-driven development, different strategies exist. One is to apply tra-ditional HCI principles to AR. However, this is difficult, as AR registers information in 3D [1] and offers different inter-action possibilities [9]. While traditional HCI methods can be used to determine what information should be presented, they do not show how to present those information [30]. To allow user-driven development the model for usability engi-neering can be used [11]. Another technique allowing fast usability evaluation is the use of the Wizard of Oz to simu-late components that do no exist yet.
When evaluating the usability of an AR application, there are four categories, as presented in [3]. Even though most field studies mainly address the user experience by using in-formal evaluation techniques such as feedback or interviews, some also evaluate the task performance, perception &
cog-nition and collaboration in the field. Task performance is usually measured in time to complete an assignment. Other metrics are accuracy or error rate. Measuring perception & cognition is often performed using the NASA-TLX to eval-uate the work load in comparison to non-AR systems. An-other metric is informal feedback, for example users com-plaining about headaches when using the AR system [29]. Collaboration is rarely evaluated. If analyzed, the study is usually very informal by just observing how people inter-act with the system. To evaluate the user experience most papers state questionnaires, interviews that can either be structured or unstructured and feedback. Some also use video or audio recordings or action logs to gather informa-tion about the usability.
Despite higher costs and more time consumption [15, 22] compared to laboratory evaluation, it can be seen that many papers conduct field studies to evaluate the usability under realistic conditions. As the cognitive load is higher in the field [7, 23], users are more stressed than in the laboratory. Reasons can be privacy issues, noise, low visibility because of sunlight, low GPS signal and others. Those reasons cannot completely be simulated in the laboratory which makes field testing indispensable for good usability evaluation.
6. REFERENCES
[1] R. T. Azuma et al. A survey of augmented reality.
Presence, 6(4):355–385, 1997.
[2] C. Baber. Evaluating mobile human-computer interaction.Handbook of Research on User Interface Design and Evaluation for Mobile Technology, 1:731–744, 2008.
[3] Z. Bai and A. F. Blackwell. Analytic review of usability evaluation in ISMAR.Interacting with Computers, 24(6):450–460, 2012.
[4] P. J. Bartie and W. A. Mackaness. Development of a speech-based augmented reality system to support exploration of cityscape.Transactions in GIS, 10(1):63–86, 2006.
[5] F. Doil, W. Schreiber, T. Alt, and C. Patron. Augmented reality for manufacturing planning. In
Proceedings of the workshop on Virtual environments 2003, pages 71–76. ACM, 2003.
[6] S. Dow, B. MacIntyre, J. Lee, C. Oezbek, J. D. Bolter, and M. Gandy. Wizard of Oz support throughout an iterative design process.Pervasive Computing, IEEE, 4(4):18–26, 2005.
[7] H. B.-L. Duh, G. C. Tan, and V. H.-h. Chen. Usability evaluation for mobile device: a comparison of
laboratory and field tests. InProceedings of the 8th conference on Human-computer interaction with mobile devices and services, pages 181–186. ACM, 2006.
[8] A. D¨unser, R. Grasset, and M. Billinghurst. A survey of evaluation techniques used in augmented reality studies. Technical report, 2008.
[9] A. D¨unser, R. Grasset, H. Seichter, and M. Billinghurst. Applying HCI principles to AR systems design. 2007.
[10] W. Friedrich, D. Jahn, and L. Schmidt. ARVIKA -augmented reality for development, production and service. InISMAR, volume 2002, pages 3–4, 2002.
[11] J. Gabbard, J. E. Swan II, D. Hix, M. O. Lanzagorta, M. Livingston, D. B. Brown, and S. J. Julier. Usability engineering: domain analysis activities for augmented-reality systems. InElectronic Imaging 2002, pages 445–457. International Society for Optics and Photonics, 2002.
[12] S. Henderson and S. Feiner. Exploring the benefits of augmented reality documentation for maintenance and repair.Visualization and Computer Graphics, IEEE Transactions on, 17(10):1355–1368, 2011.
[13] S. J. Henderson and S. Feiner. Evaluating the benefits of augmented reality for task localization in
maintenance of an armored personnel carrier turret. In
Mixed and Augmented Reality, 2009. ISMAR 2009. 8th IEEE International Symposium on, pages 135–144. IEEE, 2009.
[14] H. Hile, R. Vedantham, G. Cuellar, A. Liu, N. Gelfand, R. Grzeszczuk, and G. Borriello. Landmark-based pedestrian navigation from collections of geotagged photos. InProceedings of the 7th international conference on mobile and ubiquitous multimedia, pages 145–152. ACM, 2008.
[15] J. Kjeldskov, M. B. Skov, B. S. Als, and R. T. Høegh. Is it worth the hassle? Exploring the added value of evaluating the usability of context-aware mobile systems in the field. InMobile Human-Computer Interaction-MobileHCI 2004, pages 61–73. Springer, 2004.
[16] J. Kjeldskov and J. Stage. New techniques for usability evaluation of mobile systems.International journal of human-computer studies, 60(5):599–620, 2004. [17] C. Kray, C. Elting, K. Laakso, and V. Coors.
Presenting route instructions on mobile devices. In
Proceedings of the 8th international conference on Intelligent user interfaces, pages 117–124. ACM, 2003. [18] T. Miyashita, P. Meier, T. Tachikawa, S. Orlic,
T. Eble, V. Scholz, A. Gapel, O. Gerl, S. Arnaudov, and S. Lieberknecht. An augmented reality museum guide. InProceedings of the 7th IEEE/ACM International Symposium on Mixed and Augmented Reality, pages 103–106. IEEE Computer Society, 2008. [19] L. Molin. Wizard-of-Oz prototyping for co-operative
interaction design of graphical user interfaces. In
Proceedings of the third Nordic conference on Human-computer interaction, pages 425–428. ACM, 2004.
[20] A. M¨oller, M. Kranz, S. Diewald, L. Roalter, R. Huitl, T. Stockinger, M. Koelle, and P. Lindemann.
Experimental evaluation of user interfaces for visual indoor navigation. InProceedings of the SIGCHI Conference on Human Factors in Computing Systems, CHI ’14, pages 3607–3616. ACM, 2014.
[21] A. Morrison, A. Oulasvirta, P. Peltonen, S. Lemmela, G. Jacucci, G. Reitmayr, J. N¨as¨anen, and A. Juustila. Like bees around the hive: a comparative study of a mobile augmented reality map. InProceedings of the SIGCHI Conference on Human Factors in Computing Systems, pages 1889–1898. ACM, 2009.
[22] C. M. Nielsen, M. Overgaard, M. B. Pedersen, J. Stage, and S. Stenild. It’s worth the hassle!: the added value of evaluating the usability of mobile systems in the field. InProceedings of the 4th Nordic
conference on Human-computer interaction: changing roles, pages 272–280. ACM, 2006.
[23] L. Nunes and M. A. Recarte. Cognitive demands of hands-free-phone conversation while driving.
Transportation Research Part F: Traffic Psychology and Behaviour, 5(2):133–144, 2002.
[24] T. Olsson and M. Salo. Narratives of satisfying and unsatisfying experiences of current mobile augmented reality applications. InProceedings of the 2012 ACM annual conference on Human Factors in Computing Systems, pages 2779–2788. ACM, 2012.
[25] W. Pasman, C. Woodward, M. Hakkarainen, P. Honkamaa, and J. Hyv¨akk¨a. Augmented reality with large 3D models on a PDA: implementation, performance and use experiences. InProceedings of the 2004 ACM SIGGRAPH international conference on Virtual Reality continuum and its applications in industry, pages 344–351. ACM, 2004.
[26] I. Rakkolainen and T. Vainio. A 3D city info for mobile users.Computers & Graphics, 25(4):619–625, 2001.
[27] Y. Rogers, K. Connelly, L. Tedesco, W. Hazlewood, A. Kurtz, R. E. Hall, J. Hursey, and T. Toscos. Why it’s worth the hassle: The value of in-situ studies when designing UbiComp. InUbiComp 2007: Ubiquitous Computing, pages 336–353. Springer, 2007. [28] B. Schwerdtfeger. AVILUS tracking contest 2010
-Abschlussbericht. Technical report, Technical report, TUM, 2010.
[29] B. Schwerdtfeger, R. Reif, W. A. Gunthner, G. Klinker, D. Hamacher, L. Schega, I. Bockelmann, F. Doil, and J. Tumler. Pick-by-Vision: A first stress test. InMixed and Augmented Reality, 2009. ISMAR 2009. 8th IEEE International Symposium on, pages 115–124. IEEE, 2009.
[30] J. E. Swan and J. L. Gabbard. Survey of user-based experimentation in augmented reality. InProceedings of 1st International Conference on Virtual Reality, pages 1–9, 2005.
[31] B. Thomas, B. Close, J. Donoghue, J. Squires, P. De Bondi, M. Morris, and W. Piekarski. ARQuake: An outdoor / indoor augmented reality first person application. InWearable Computers, The Fourth International Symposium on, pages 139–146. IEEE, 2000.
[32] D. Wagner.Handheld augmented reality. PhD thesis, Citeseer, 2007.
[33] D. Wagner, T. Pintaric, F. Ledermann, and D. Schmalstieg. Towards massively multi-user augmented reality on handheld devices. InPervasive Computing, pages 208–219. Springer, 2005.
[34] B. Walther-Franks and R. Malaka. Evaluation of an augmented photograph-based pedestrian navigation system. InSmart Graphics, pages 94–105. Springer, 2008.
[35] C. Ware and R. Balakrishnan. Reaching for objects in VR displays: lag and frame rate.ACM Transactions on Computer-Human Interaction (TOCHI), 1(4):331–356, 1994.
Evaluation of Augmented Reality Applications in a
Laboratory Context
Prisca Bonnet
Universität Passau
[email protected]
ABSTRACT
The development of Augmented Reality (AR) applications has become increasingly popular recently, with the spread of portable and cheap high-fidelity mobile devices such as smartphones, tablets and dataglasses. Those devices are particularly suited for AR applications because of their mo-bility and their various input mechanisms e.g. voice com-mand, touchscreen, high-quality camera.
In the field of Human-computer interaction (HCI), usabil-ity and user experience (UX) studies are often conducted via user-based evaluation. Those evaluation can be divided in two categories: laboratory and field-test studies. While evaluation in a laboratory allows to control precisely the ex-periment’s condition, evaluation in the field is more realistic and take more parameters into account.
Recently, new techniques has been developed to conduct more realistic evaluations within a controlled laboratory en-vironment. In this report, we will consider several labo-ratory evaluation setups and discuss their advantages and drawbacks. We will describe and classify those setups using different aspects : display, interaction, controller and mea-sures. Finally, we will discuss the main issues related to those setups.
Keywords
Augmented Reality, Evaluation, Usability, UX
1. INTRODUCTION
The evaluation on any application can be done either with or without users. If conducted without users, the evaluation is based on heuristics [2]. If several studies have been con-ducted to create guidelines for the evaluation of virtual en-vironments [28, 29], heuristics-based evaluation is difficult to apply to AR applications, because of the range of the domain itself [2]. When an AR application can be needing mobile or fixed devices, one or several users, be controlled by voice command or a touchscreen, and be intended for novice or experimented users, it is indeed difficult to define relevant heuristics [6, 9].
Permission to make digital or hard copies of all or part of this work for personal or classroom use is granted without fee provided that copies are not made or distributed for profit or commercial advantage and that copies bear this notice and the full citation on the first page. To copy otherwise, to republish, to post on servers or to redistribute to lists, requires prior specific permission and/or a fee.
Advances in Embedded Interactive Systems’14 Passau, Germany Copyright 2014 ACM X-XXXXX-XX-X/XX/XX ...$15.00.
Therefore, a user-based evaluation is often suitable. As AR creates a new user experience, new evaluation techniques have to be developed. The mobile aspect of AR applications require to develop new methods during conception, develop-ment and evaluation. “HCI methods, models and techniques will need to be reconsidered if they are to address the con-cerns of interactions on the move.” [12].
Evaluation can be conducted either in the field or in a lab-oratory environment. Testing in the field is the natural way to conduct user-based evaluation, because it puts the user in realistic conditions, but it requires specific consideration compared to controlled laboratory experiment [18, 22].
It can be difficult to collect data in the field, and it may be impossible to concentrate research on specific aspects of the interactions [22, 24]. Furthermore, several evaluation techniques, such as Think aloud or video recording,can be difficult to use in the field [12].
Evaluating a product while sitting down in a laboratory leads to different results than an evaluation in the field, or while moving. On the other hand, focusing only on the prod-uct can lead to the finding of more usability problems [15]. On the contrary, other studies [8, 22] point out that evalua-tion in the field allows to discover more usability problems, due to various parameters: ambient noise, movement, pri-vacy concerns.
A survey by Kjeldskov and Graham in 2003 on evalua-tion of mobile systems [14] pointed out that 71 percent of the evaluations were conducted in a laboratory environment, but most of them preferred to use a trial and error mecha-nism rather than focusing grounding engineering to develop new techniques to meet the challenge of mobile systems. In 2004, Kjeldskov and Stage [15] reviewed 114 papers (1996 - 2002) dealing with HCI in mobile systems. Only half of the papers considered usability, and 6 proposed new evalu-ation techniques. More recently, several solutions have been developed, in order to create a realistic environment in a laboratory context. Different aspects of the user experience have been studied, and have led to new ways of conducting user evaluation in a laboratory.
In the following sections, we will describe and compare several setups for evaluation in controlled laboratory envi-ronment. It can rely on a display to immerse the user in a given situation, or on specific interactions techniques. Those will be described in the next two sections. The different con-trollers that can be used to simulate a real environment are described in section 4. Section 5 lists the different measures used during evaluation process. In section 6, we discuss the issues related to evaluation in a laboratory environment.
2. DISPLAYS
This section covers the different displays used to immerse the user in a given situation for the evaluation. We discuss advantages and drawbacks of the described methods. We distinguish two types of setups: those where a prerecorded scene is displayed, and those which use computer-rendered environments.
2.1 Prerecorded video
Singh et al. [27] propose to use immersive video as a tool for prototyping and evaluating AR applications. It displays a recorded video in a wide field-of-view display. In their prototype, they used three screens to create a viewing angle of about 140 degrees. Their setup is shown in Figure 1.
Ostkamp and Kray [23] created an environment where any android application could be evaluated. They used an im-mersive video environment with a viewing angle of 114 de-grees. The video footage was recorded with three cameras mounted on a tripod and an audio recorder.
This kind of approach allows to use real video footage instead of a computer-rendered environment. Therefore, the simulation is more realistic. Furthermore, it is relatively cheap and fast. Thus, this approach does not allow the user to move in the environment, and limits the control over the displayed video.
2.2 Computer-rendered environment
The main advantage of this approach is the possibility for the user to move freely in the computer-generated space. This means that the user can walk, turn and even duck, and see the corresponding image on the screen. With this approach, it is possible to control the content of the virtual environment. Therefore, it is suitable to study the influence of some parameters on the user’s reactions.
To evaluate an advertising application in a supermarket, H¨uhn et al. [10] used a computer assisted virtual environ-ment (CAVE). The virtual environenviron-ment was projected on 4 screens disposed as a close space around the user. A virtual
supermarket model was created, and adjusted to the differ-ent experimdiffer-ents. With this approach, the developers were able to modify the virtual supermarket to fit the needs of the experiment, and the user could move freely in the virtual space.
The main drawback of this environment was the lack of products in the shelves, and of other visitors in the virtual supermarket. Figure 2 shows the adaptability but lack of realism of their approach.
To study navigational place findings, Schellenbach et al. [26] used a virtual environment (VE) in which the user moves. They created a virtual museum, and the display was a big screen in front of the treadmill. Two projectors allowed 3D projection. They tracked the head position of the user to correct the perspective accordingly.
Computer-rendered environments are also used in van Veen et al. experiment, using the laboratory at the Max Planck Institute in Tuebingen [31].
3. INTERACTIONS
When using an AR application, the user often interacts with the system. The interaction can be limited to a mobile device used to run the AR application, or consist of several ways to move in a simulated environment.
3.1 Mobile devices
The AR application runs often on a mobile device, e.g. a smartphone or a head-mounted display (HMD). This de-vice can be virtual, and the interaction will rely on a key-board and/or a mouse. It can also be physical and interact if needed with the virtual environment.
3.1.1 Virtual mobile devices
When the environment is simulated with a VE, the mobile device can also be part of the simulation. Several prototyp-ing or evaluation tools follow this approach [3, 7, 11].
For example, Ubiwise [3] is a simulation tool designed to investigate applications which use mobile phones as
Figure 2: The computer-rendered supermarket of H¨uhn et al. [10]
tion devices. Those devices are represented in the 3D sim-ulation, an therefore have to be interacted with via mouse and keyboard. The interaction process is neither intuitive nor immersive, and cannot represent a realistic use of the devices [10].
Those approaches provide a cheap an easy way to conduct evaluation, even in the prototyping phase [3]. But the main drawback is the disruption with the real usage of the mobile device [11]. The user has to use a mouse and keyboard instead of directly interacting with the device.
Therefore, hybrid simulations, using a virtual environ-ment and a physical mobile device, can be a good way to have a more realistic and intuitive simulation.
3.1.2 Physical mobile devices
Using a physical mobile device for evaluation, even in early stages of development, can be a rapid way to discover many usability issues [8, 10].
Leichtenstern et al. [16] used a virtual world and physi-cal mobile phone as an evaluation platform for user studies. They implemented several interactions the user can make on the virtual world, e.g. control a TV or a heater, through sev-eral interaction techniques: scanning, pointing and touching. They conducted two user studies, one in real condition and the other one within the hybrid environment, and obtained similar results for both experiments. Since they used a stan-dard screen to display the virtual environment to the user, some test subjects had difficulties immersing in the simula-tion. Using a CAVE could improve the immersion.
H¨uhn et al. [10], Ostkamp and Kray [23] and several oth-ers [26, 8, 15, 1] used a physical mobile device to conduct their evaluation. Since they wanted to study the user ex-perience with a given application where the mobile device was in the center of the interaction, using a physical mobile device was the best way to have a realistic simulation.
3.2 Movement
Most of the time, AR applications are used while “on the move“. Taking the user’s movement into consideration in a laboratory evaluation can be helpful both for the user’s im-mersion and to consider that part of the user’s experience.
3.2.1 Treadmills
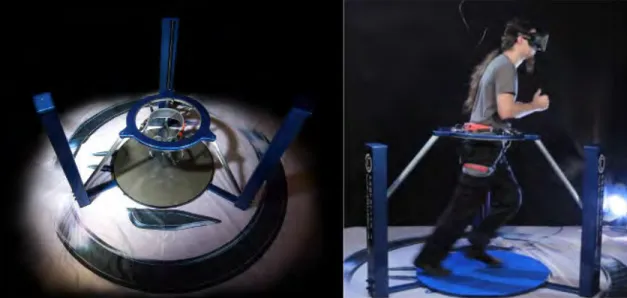
In their study, Schellenbach et al. [26] used a treadmill to simulate the user’s movement in their VE. They argue that self motion is an important component of navigational place finding, as pointed out in [19]. In fact, it has been proved that cognitive and motor functions compete for shared men-tal resources [17, 32].
Shellenbach et al. [26] argue that laboratory evaluation allows to have a clean data collection with replicable condi-tions. The different parameters on the user experience can be distinguished and studied. The treadmill they used can adapt to the user preferred speed. Since the treadmill only moves in one direction, only one screen is sufficient for the user to immerse in the simulation.
3.2.2 Buttons
In the treadmill experiment by Schellenbach et al. [26], the user could only move in the direction of the treadmill. To enable turning moves in the VE, they used wireless han-deld buttons to perform smooth virtual turns in the virtual museum. It was not a very intuitive approach, but it was an easy way to overcome the issue of turning moves.
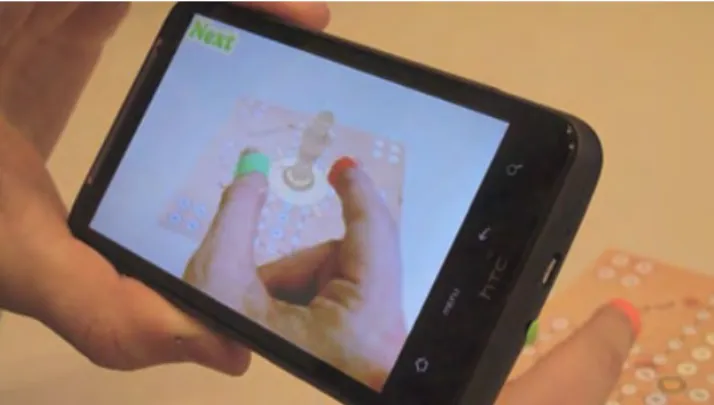
Vadas et al. [30] wanted to study the action of reading on a mobile device while on the move. They wanted to compare three mobile devices, but without taking their input mech-anisms into account. To that end, they asked their test subjects to use a basic input device with buttons, regardless of which mobile device they were testing. The subjects had to read a text and answer multiple choice questions. The text was displayed either on a mobile device, on an e-book reader or on a head-mounted display. The keypad used for input allowed to choose an answer and validate the answer. Figure 3 shows their setup. With this method, only the dis-play mechanism of the three devices had an influence on the the user’s experience.
3.2.3 Sensors
In their CAVE, H¨uhn et al. [10] used a head-tracking sys-tem to know the position of the user and adjust the displayed image accordingly. The user could duck or jump during the experiment, and see the perspective adjusted. To control his movement in the virtual supermarket, the user acted as
![Figure 1: Usability Enginnering as proposed in [11]](https://thumb-us.123doks.com/thumbv2/123dok_us/1308045.2675014/9.918.115.456.666.815/figure-usability-enginnering-as-proposed-in.webp)
![Figure 1: The immersive video environment of Singh et al [27].](https://thumb-us.123doks.com/thumbv2/123dok_us/1308045.2675014/16.918.201.739.666.979/figure-immersive-video-environment-singh-et-al.webp)
![Figure 2: The computer-rendered supermarket of H¨ uhn et al. [10]](https://thumb-us.123doks.com/thumbv2/123dok_us/1308045.2675014/17.918.135.799.75.317/figure-computer-rendered-supermarket-h-uhn-et-al.webp)
![Figure 3: The experiment of Vadas et al [30]. Left: Input device. Right: Three reading devices compared in their study.](https://thumb-us.123doks.com/thumbv2/123dok_us/1308045.2675014/18.918.155.795.75.324/figure-experiment-vadas-input-device-reading-devices-compared.webp)
![Figure 4: The experiment of Nakanishi [21]. Left: Miniaturing. Right: Full virtual prototyping.](https://thumb-us.123doks.com/thumbv2/123dok_us/1308045.2675014/19.918.118.835.78.252/figure-experiment-nakanishi-left-miniaturing-right-virtual-prototyping.webp)

![Figure 2: MATRIX [21], Multipurpose Array of Tactile Rods for Interac-tive eXpression, an array of tactile actuators](https://thumb-us.123doks.com/thumbv2/123dok_us/1308045.2675014/25.918.487.854.75.306/figure-matrix-multipurpose-tactile-interac-expression-tactile-actuators.webp)
![Figure 5: KITE Platform [22], hand-held AR device made with off-the-shelf hardware](https://thumb-us.123doks.com/thumbv2/123dok_us/1308045.2675014/26.918.510.797.75.274/figure-kite-platform-hand-held-device-shelf-hardware.webp)