Economic Transition and Cross-border Mergers & Acquisitions:
The Indian Experience among BRICs
by K.S. Reddy
Xi’an Jiaotong University, School of Management, China
Yu Li
Xi’an Jiaotong University, School of Management, China
En Xie
Xi’an Jiaotong University, School of Management, China
This paper analyzes the market for cross-border mergers and acquisitions of Asian emerging economy-India during the period 1991–2010. We compare Indian market performance among BRIC economies (Brazil, Russia, and China) for both inbound and outbound acquisitions. To do so, we use statistical data on overseas investment transactions from the UNCTAD’s World Investment Report-2011, and discuss potential changes in the market tendencies based on inductive/deductive logics and case examples. We check macroeconomic indicators of BRICs in order to support the economic, banking and financial reforms in India. Further, we highlight the internationalization process of Indian firms by supporting the data on parent corporations and foreign affiliates. We draw conclusions from India’s share as a percentage of the world economy, developing economies, BRICs and Asia. Overall, India is next to China for all selected categories.
1.
Introduction
Emerging markets (hereinafter, EMs) promise attractive investment opportunities but pose many risks and complexities, and returns across these markets could vary significantly (Dobbs, Lund, & Schreiner, 2010; Hoskisson, Wright, Filatotchev, & Peng, 2013; Wright, Filatotchev, Hoskisson, & Peng, 2005). These economies have become the focus of sustained and considerable research because they account for the largest share of the world’s population and land. In addition, they have abundant natural resources, technical skills, and robust domestic demand. These resources and the demands for them seem to be growing quicker in these countries than in the developed nations (Kearney, 2012; Shah, 2012). EMs are located favorably for some activities in the global chains of several businesses and present a dynamic and stimulating setting for the international management research (Drummond, 2012; Peng, 2012; Ramamurti, 2012). Traditionally, most EMs were highly regulated, with restricted competition and foreign entry. They were less sophisticated and their regulatory system was inconsistent (Elango & Pattnaik, 2011; Madhok & Keyhani, 2012). With successive policy reforms and amendments in various laws, a number of emerging markets have subsequently pursued potential opportunities of globalization and liberalization. In particular, globalization has facilitated knowledge transfer, foreign direct investment, trade, short-term capital flows, and movements of labor, among others. Besides, it is a powerful force for economic growth, and it affects
economic growth in different countries differently (Stiglitz, 2003). In fact, globalization has provided an excellent opportunity for multinational companies (MNCs) in light of deregulation and privatization policies (Norbäck & Persson, 2008). The complete systemic change has led the liberalization of government controls, a superior role of the private sector and increased competition with the aim of greater global integration (Ramaswamy & Renforth, 1996).
While Holtbrügge and Kreppel (2012) emphasize the internationalization process of Indian and Brazilian firms, Chinese and Russian firms receive substantial political support from their governments to invest abroad. For instance, mergers and acquisitions (M&A) announced by EMs in the first quarter of 2012(January–March) accounted for 28% of the world economy that reached US$132.5 billion, representing a 33% decrease compared to the same period in 2011, and a 19% drop compared to the previous quarter. Importantly, the major targeted EM economy hitherto in 2012 is China, with 674 deals worth of US$31.3 billion, followed by Brazil with US$21.2 billion, India withUS$10.6 billion, and Russia with US$10.2 billion (Thomson Reuters, 2012). This observation indicates that both Chinese and Indian MNCs seem to be rewriting the rules of M&A (Kumar, 2009).
The theory of business cycles in economics (Fels, 1952; Schumpeter, 1939), the theory of international trade (Brecher & Parker, 1977) and the theory of internationalization process in international business (Andersen, 1993; Dunning, 1988; Johanson & Vahlne, 1977), and resource-based view (RBV) theory in strategic management (e.g., Geringer, Beamish, & Dacosta, 1989; Penrose, 1959; Wan, Hoskisson, Short, & Yiu, 2011) explore the link between economic activity, global trade and firm performance. Thus, the theme of corporate restructuring emerged during the economic transitions (Peng, 2003) when the western nations initiated the industrial revolution. In the literature, the term restructuring has been widely used in diverse contexts such as mergers, acquisitions, joint ventures, alliances and buyouts. In due course of time, the developed economies engulfed developing countries because of the 1990–91 economic deregulation and liberalization experience (e.g., Weston, Chung, & Hoag, 1998).
Several researchers have extensively investigated M&A in key areas, ranging from negotiation process to due diligence activity, stock returns to accounting performance for pre- and post- acquisition periods, post-merger strategies to culture-integration issues, and so forth (e.g., Barbopoulos, Paudyal, & Pescetto, 2012; Basuil & Datta, 2015; Boateng, Hua, Uddin, & Du, 2014; Collins et al., 2009; Conklin, 2005; Corhay & Rad, 2000; Das & Kapil, 2012; Erel, Liao, & Weisbach, 2012; Ketkar, 2012; Kling et al., 2014; Malhotra, Sivakumar, & Zhu, 2011; Mukherji, Mukherji, Dibrell, & Francis, 2013; Rasedie & Srinivasan, 2011; Reus, 2012; Serdar Dinc & Erel, 2013; Stepanok, 2015; Vasconcellos, Madura, & Kish, 1990). But only a few studies in international mergers and joint ventures have been conducted in the EMs institutional setting. For instance, scholars from EMs pursue research in cross-border mergers and acquisitions (hereinafter, CB-M&A) to add theoretical, conceptual and empirical evidence to the literature and improve the institutional framework (e.g., for China: Anderson, Sutherland, & Severe, 2015; Deng, 2009; Liu & Zou, 2008; for India: Ramakrishnan, 2008; Srivastava & Prakash, 2014; Tripathi & Lamba, 2015; for Russia: Bertrand & Betschinger, 2012; for Latin America: Pablo, 2013; for mixed-sample of emerging economies: Bhagat, Malhotra, & Zhu, 2011; Lebedev, Peng, Xie, & Stevens, 2015; Nagano & Yuan,
2013; Nicholson & Salaber, 2013; Sun, Peng, Ren, & Yan, 2012; Yang, Jiang, Kang, & Ke, 2009). However, scholars have ignored to show the robust results of the market for CB-M&A over the last two-decade. To try to fill the gap in this literature, we conduct a exploratory research to examine the impact of India’s macroeconomic change and policy reforms on CB-M&A market in terms of number of deals and value of transactions during 1991–2010. We assess purchases (outbound) and sales (inbound) for the world economy and emerging markets (hereinafter, BRIC group–Brazil, Russia, India and China (including Hong Kong)) in order to explore intriguing insights from the Indian institutional setting. Further, we study the internationalization process of Indian MNCs by referring to the statistics on parent corporations and foreign affiliates for the year 2010.
There are three key motivating factors behind choosing an exploratory research for Indian environment: the growing importance of EMs, especially the BRIC group; the rising number of BRIC economies and an increasing number of Indian multinational corporations’ foreign affiliates; and the 1991 economic reforms in India that influenced Indian enterprises to pursue global diversification through acquisitions. Through all of this, we want to contribute to the economic policy reforms related to business restructuring activities.
In this paper we present a brief outcome of this study. India and China’s GDP rates do not represent negative value in the last twenty-year period. We find similar GDP growth rates for both of them in 2010. Expectedly, India’s real GDP per capita is significantly lower than other BRIC economies: Brazil (US$4,543.53) and Russia (US$4,665). From real GDP insights, we notice a slow growth rate for Russia while higher growth rates for China and a medium growth rate for India. Interestingly, India’s number of deals for CB-M&A sales is notably higher than purchases during 1991–2002, then both sales and purchases are moving together until the year 2006 and thereafter. Market for a number of outbound deals has surpassed the inbound deals from the year 2007 to 2010. As noted, a number of Indian firms have invested about US$29,083 millions in 2007, which is a phenomenal growth representing 333% compared to the previous year. India’s share as a percentage of the world economy represents more than one percent in six years for number of deals and three years for value in the last two decades. This radical change recognizes that Indian economic, financial and banking reforms place the local MNCs in the world map through internationalization process. Overall, India is next to China in the BRIC group, Asia and developing countries segments.
2.
Research Design and Organization
The purpose of this paper is to discuss the economic and financial reforms and their impacts on market for cross-border M&A in India. To do so, we choose an archival method to collect appropriate data and information for various reasons. For example, data related to macroeconomic variables were extracted from the World Bank’s World Development Indicators and the Euromonitor database. Data associated with CB-M&A transactions were accessed from the World Investment Report (UNCTAD, 2011). India’s CB-M&A cases were collected from the Thomson Reuters Quarterly Reports, KPMG, PricewaterhouseCoopers and Bloomberg Year book on M&A. Then, we analyzed the market for CB-M&A in various segments: the world economy, BRIC group, Asia and developing economies, and discussed
potential changes based on inductive and deductive logics. All in all, a blend of empirical data and relevant case examples are being highlighted.
The remainder of the paper is organized as follows: Section 3 looks into the economic progress of BRIC group. Section 4 addresses the Indian economic, banking and financial reforms since 1991. Section 5 discusses potential changes in the market for cross-border M&A deals (sales and purchases). Section 6 shows additional findings on parent corporations and foreign affiliates of BRIC group. In Section 7, we offer a set of policy guidelines together with implications for future research.
3.
Economic Progress of BRIC Group, 1991–2010
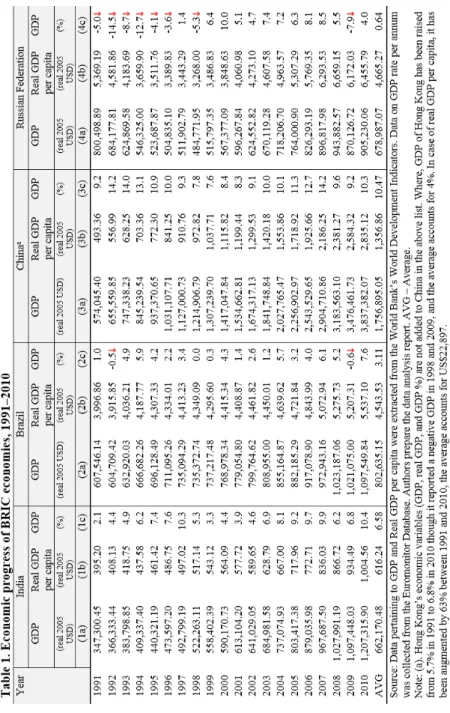
Table 1 shows the real GDP, real GDP per capita and GDP growth rates for BRIC economies during 1991–2010 (see Figure 1). We find that Indian GDP rate has dramatically improved year-on-year in the last two decades because of new economic policy reforms, deregulation and abolition of the license raj system (Ahluwalia, 2002; Dongre, 2012). For example, 2.1% in 1991 has augmented to 10.3% in 1997. In contrast, for the same period, except the year 1992, Chinese GDP rate has collapsed until the year 1999. India confirms highest GDP rate in 1997 compared to China, Brazil and Russia. We also notice the effect of the Asian financial crisis in the subsequent years after 1997. The Indian GDP growth rate has declined to below 5% during 1999–2002, for example, 3.3% in 1999, 4.4% (2000), 3.9% (2001) and 4.6% (2002).
Russia has negative GDP growth rate between 1991 and 1998, except for the year 1997 (1.4%), whereas Brazil shows a mixed trend. Russia’s negative trend expands to eight years, but Brazil’s only two years. We also observe a similar trend in the aftermath of 2007–08 global financial crisis. For example, the Indian GDP rate has declined by 6.2% (6.8%), Brazil 5.2% (-0.6%), China 9.6% (9.2%) and Russia 5.5% (-7.9%) for 2008 (2009). Indian and Chinese GDP rates have never reported in negative value in the last twenty-year period. Based on the average GDP rate in China (10.47%), India (6.58%), Brazil (3.11%) and Russia (0.64%), we exert that China is the leading country in BRIC group as well as developing economies and world economy. We find similar GDP growth rates for both China and India in 2010. However, India’s economic growth for the fourth quarter of 2011–12 shows 5.3%, a nine-year low (Sanyal, 2012).
Figure 1. GDP (percentage) of BRIC economies, 1991–2010 Source: Table 1.
Further, in the year 1991, we observe a modest change in real GDP per capita (approximately, US$100) between China (US$493.36) and India (US$395). In the subsequent years, there is a considerable economic gap between China and India. For example, in case of India, the real GDP per capita increased from US$395 in 1991 to US$1,004.56 in 2010, whereas in China, it increased from US$493.36 to US$2,835 during the same period. In fact, their averages in the last two decades are US$616.24 and US$1,356.86, respectively. India’s real GDP per capita is significantly lower than that of other BRIC economies, Brazil (US$4,543.53) and Russia (US$4,665). Therefore, we suggest that India must revise economic, financial and legal policies pertaining to overall economic development in order to face the future challenges in the global economy. One would notice that India took nearly twenty-year to reach US$1000 of real GDP per capita. Referring to GDP growth rates, we observe the slower growth rate for Russia, the highest for China and a medium growth rate for India.
4.
Economic Transitions and Reforms in India
The Asian financial crisis in mid-1997 had elevated worries in the Asian-region financial markets; and so had been the case with the crash of IT bubbles in 2000 as well. As a result, there has been a remarkable growth in the number of acquisitions and takeovers (cf. Reddy, Nangia, & Agrawal, 2013). The drivers of Asian economic growth include healthy economic indicators: the rising stock prices, turnover of financial assets, and further deregulation in the local markets (Böhme, Chiarella, & Lemerle, 2008, p. 5). When the U.S. and Asian region relations improved gradually, India tried to become a part of the global political and economic experience (Banga, 2014; Evans, 2004; Sood & Szyf, 2011). The result for India has been an organized change from being a closed system to an open economy since the start of economic reforms (Ernst & Young, 2010; Mishra & Sharma, 2011). Indeed, a number of Indian MNCs have gained significant concentration in the world economy, especially as acquirers in developed markets (Afsharipour, 2010).
During the 80s and 90s, several countries embarked on extensive reform processes, mainly in the banking sector (Jaffry, Ghulam, Pascoe, & Cox, 2007). In the case of India, the reforms have been market-driven, characterized by deregulation and privatization (Ahluwalia, 2002). As such, Indian government unveiled its new economic policy to attract foreign investment in several sectors of the economy and later intensified its free market approach through a series of policy amendments (Ahluwalia, 1994; Khandwalla, 2002). The liberalization has ended the infamous license-permit raj (Reed, 2002). And the main benefit of liberalization has been a decline in the cost of capital for local firms (Ghosh, Harding, & Phani, 2008, p. 405), while it has increased the efficiency with which investment funds are allocated (Galindo, Schiantarelli, & Weiss, 2007). Importantly, it brought a forced change: increased competition, reinforced by the arrival of multinationals. It also raised investors and consumers expectations. These changes together have propelled domestic firms to focus on core businesses (Anandan, Kumar, Kumra, & Padhi, 1998, p. 67) with a view to expanding overseas operations.
Since the independence, Indian economy has grown at a rather slower pace of 3.6% per year for three decades, but later picked up growing at an average rate of about 5.6% per year between 1981 and 1990, and then by 7.7% per year over the 10th five year plan (cf. Jaffry et al., 2007; Mehrotra, 2010). By and large, it has sustained an average growth rate of 6% over the last 25 years (Cheng et al., 2007). The removal of industrial licensing, easing of foreign investment, the import of raw materials, capital goods and technology have distinctly enlarged the competition in Indian industry (Ramakrishnan, 2008). Consequently, a series of reforms were undertaken with respect to industry, trade and financial sectors (Dongre, 2012).
The deregulation helped financial sectors through improved trade, technology and infrastructure development (Wadhva, 2000). The reforms were designed deeply to promote greater efficiency in the economy through the promotion of competition and to bring the output-input combination to the optimal production frontier and induce them to produce financial services at lower costs (Kumar, 2013; Mohan, 2006). For example, a number of new policy reforms were introduced during 1992– 97, incorporating a reduction in reserve requirements, interest rate reform and an effort to remove barriers to market entry (Jaffry et al., 2007). As a result, economic reforms had brought selective productivity gains at the micro level, but translated into major restructuring in the international competitiveness of most industries (Wadhva, 2000). In fact, it also motivated the Indian firms to pursue the path of internationalization (Nayyar, 2008).
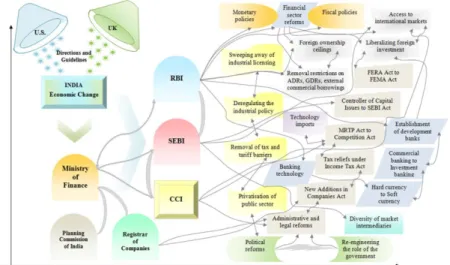
Keeping all of those reforms in mind, we designed a conceptual mapping of Indian economic, banking and financial reforms since the economic liberalization in 1991 (Figure 2). On the one hand, economic policy reforms included privatization of public sector enterprises; removal of government-initiated price control measures; easing of industrial licensing, elimination of trade barriers, deregulating the industrial policy; establishment of development banks, reduction in the statutory maximum levels for reserve ratios, gradual dismantling of the administered interest rate structure; liberalizing of foreign investment, foreign trade and outward investment policies, technology imports, reforms in foreign exchange policies; and foreign ownership ceiling. On the other hand, financial and capital market policy reforms included the establishment of a statutory regulator for securities market, introduction of electronic trading to improve transparency, dematerialization of
shares, and diversity of market intermediaries, such as merchant bankers, underwriters, share registrars, rating agencies, takeover code, and so forth (see Ahluwalia, 1994, 2002; Choudhury, 2010; Department of Disinvestment, 2007; Dongre, 2012; Elango & Pattnaik, 2011; Hattari & Rajan, 2010; Herd, Koen, Patnaik, & Shah, 2011; Khandwalla, 2002; Kumar, 2013; Mohan, 2006; Moore, Green, & Murinde, 2006; Varma, 1998; Wadhva, 2000). Importantly, the newly elected government in 2014 came up with policies to establish result-oriented foreign collaborations, design foreign trade and investment policies, focus on infrastructure development and industrialization (e.g., Make-in-India), and deepen the financial inclusion (e.g., Jan Dhan Yojana).
Figure 2. Complex system (conceptual mapping) of Indian economic policy reforms
Source: Authors own presentation
5.
Analysis: Cross-Border M&A Market in India
Indian and Chinese MNCs are important sources of FDI (outward flows) around the world (UNCTAD, 2009). Though companies around the world had announced 7,700 deals worth US$2.7 trillion – a 3% increase from 2010, the market for the M&A slowed in 2011 due to the European sovereign-debt crisis which continued to upset the global economy (Sivertsen, 2012). In a recent comparative study, Sun et al. (2012) find that Chinese firms have low success rate (47%) in CB-M&A deals compared to Indian firms (67%). Against this backdrop, we present exploratory findings of CB-M&A deals by sales and purchases for the period 1991–2010. 5.1Heading Level Three
In Table 2, we show a seller’s performance for a number of deals and value of transactions. This table examines rates of growth for the world economy and India,
and shows the percentage of contribution made by India to developing countries, Asia, South Asia and BRICs. As the data indicate, Indian CB-M&A deals and value are: the rate of growth 166% in 1993, 740% in 2006, -50% in 2002, and -49% in 2005, respectively. We also report averages for the world economy (7.33%, 24.78%) and India (31.55%, 67.55%). We notice the rate of growth for value is higher than the rate of growth for number of deals. We observed the declining trend for the number of deals and value in the world economy and India during two time periods such as 2001–03 and 2008–09. We remarked that corporate restructuring and M&A activities were affected adversely by the 2007–08 global financial crisis. India’s contribution to the world CB-M&A is still not that great in terms of number of deals and value of transactions. However, the rate of growth in India is significantly higher than the rate of growth for the world economy in both number of deals and value of the deals. The average for India is 60 deals with average value of US$1,873 millions.
Referring to a number of deals, share of India to developing economies has notably improved from 1.53% in 1991 to 8.91% in 2010. We find similar contributions made by India to Asia and South Asia regions in terms of value of deals, though the share of India to BRICs has been adjusted in some years for number of deals and value. For example, in the case of number of deals India’s share represents varies between 4% to 14%. In the case of value, it ranges from zero percent to 32%. As such, India’s contribution is next to China’s in Asia and BRICs. Also, the number of deals has declined due to the financial meltdown while the deal amount has spiked up by 136%.
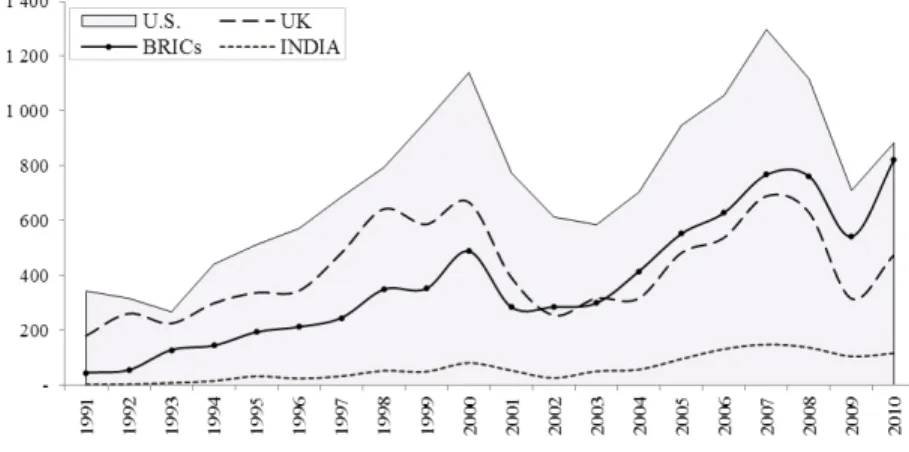
We plot a trend line for a number of cross-border M&A deals by sales for the UK, the U.S., BRICs and India. We find that the U.S. and the UK are dominant developed nations; the U.S. has been a market raider, followed by the BRIC group since 2002. One would see the BRIC group has surpassed the UK since 2002 (see oval in Figure 3), and it may overtake the U.S. over the next few years. In fact, there is a crossover point between BRIC group and the UK. Interestingly, the U.S. curve looks like a mountain, and it thus justifies the theory of business cycles. This finding may point out the moderate competition between MNCs from developed markets and MNCs from emerging markets in adapting global strategies. We notice that number of deals for India have markedly increased over two time periods, such as 1998–2000 and 2005–08. However, India’s contribution to BRIC group is next to China. China has gained hi-tech expertise by attracting more number of R&D-intensive greenfield projects and M&A activities as well as participating in the world economy through imports (Liu & Zou, 2008, p. 362).
Table 2. Number and value of cross-border inbound M&A transactions of Indian economy, 1991–2010
Figure 3. Number of cross-border inbound M&A transactions of Indian economy
Source: Table 2.
Figure 4. Value of cross-border inbound M&A transactions of Indian economy Source: Table 2.
We also plot a trend line for value of cross-border M&A deals by sales for the UK, the U.S., BRICs and India (Figure 4). We observe that the U.S. has constantly taken the largest share, followed by the UK. In the year 2000, the U.S. represented the highest value of transactions of about US$271,721 million and then it sharply tumbled to US$123,934 in 2001. At the start, there was a noticeable gap between the U.S. and the UK CB-M&A value by the seller, but the UK has surpassed the U.S. between 2004 (US$42,807 million) and 2007 (US$171,646 million). More specifically, the BRIC group, the UK and the U.S. have reached a comparable level in the aftermath of the 2007–08 global financial crisis (i.e. 2009). From this we can suggest that the financial crisis has optimistically favored BRICs, especially India and China. For example, India’s CB-M&A value has significantly improved from US$4,424 million in 2006 to US$6,049 million in 2009. Overall, CB-M&A sales
value has declined during 2008–09 and then quickly recovered in 2010 for the UK, the U.S., BRICs, and India.
5.2Number and Value of Cross-Border M&A Outbound Deals (purchases)
The rates of growth for number of deals and value for the world economy over the two decades are 7.33% and 24.78%, respectively (Table 3). We find the highest number of deals and value for India in 2007, but the rate of growth is comparatively lower than the previous year, i.e. 175 (30.6%) and US$29,083 million (333%). We also notice the highest rate of growth for India’s number of deals in the aftermath of the financial crisis—about 148% in 2010. This observation suggests that most Indian MNCs are willing to internationalize their operations through joint ventures, acquisitions and other market entry modes. We find similar trends for value of deals.
Further, we find Indian share to developing economies to be 16% for three years consecutively (2007–09) in terms of the number of deals while it stands at 7.29% for transactions and 4.70% in value. Likewise, we notice analogous observations for India’s share to Asia, South Asia and BRICs. For example, average India’s share to BRIC group for number of deals stood at 18.09% and at 10.84% for value. Indeed, India’s shares in the world economy, developing economies, Asia, South Asia and BRIC group have improved significantly during 1991–2010. These observations confirm that the Indian economic reforms since 1991, policy rigors and a government decision together have remarkably influenced the Indian internationalization strategy. By and large, India stands next to China for number of deals and value because “Chinese MNCs characterize three relatively unique aspects: (i) the previously underappreciated role played by the local country governments of MNCs as an institutional force, (ii) the challenge of going overseas in the absence of significantly superior technological and managerial resources, and (iii) the quick adoption of acquisitions as a first mode of entry” (Peng, 2012, p. 97).
We plot a trend line for CB-M&A purchases, representing the number of deals for the U.S., the UK, BRICs and India (Figure 5). We find that the U.S. firms made the highest number of deals followed by the UK since 1991. We notice the impact of global financial crisis on the U.S., the UK, BRICs and Indian performance in 2009, then recovered in 2010. In particular, a number of Indian firms have initiated to internationalize their products and services since 2000, and changes are already happening as noticed during 2006–08. We notice similar observations for BRIC group. More importantly, BRIC group has markedly exceeded both the U.S. and the UK from 2008 (see oval in Figure 5). Thus, Chinese and Indian MNCs have acquired resources and skills as to lead the world economy in terms of parental-foreign affiliates and the number of outbound deals (Sun et al., 2012).
Table 3. Number and value of cross-border outbound M&A transactions of Indian economy, 1991–2010
Figure 5. Number of cross-border outbound M&A transactions of Indian economy
Source: Table 3
Figure 6. Value of cross-border outbound M&A transactions of Indian economy
Source: Table 3.
We also plot a trend line for CB-M&A purchases, representing the value of deals for U.S., UK, BRICs and India in Figure 6. Since 1991, the U.S. has contributed the highest value to the world economy, but UK has outperformed the market in 1999, 2000 and 2007. The Figure infers that the U.S. MNCs invest more amount of equity in cross-country deals. In other words, they mostly acquire firms by transferring equity capital. In our view, the U.S. banks’ lending norms and investment guidelines are more flexible, easier and they motivate firms to participate in international M&A negotiations. Conversely, BRICs MNCs have invested significantly in outbound deals since 1999, which supported the actual growth that commenced in 2004. In 2006, the BRIC group outperformed the UK, declined in 2007 and then surpassed both the U.S. and the UK from 2008 onward. India alone overtook the UK in 2009 and 2010. However, most of the deal amount was contributed by Chinese firms except for the year 2007 because Chinese MNCs engage in M&A to access and acquire strategic
assets in order to overcome their competitive disadvantages (Deng, 2009). Developing markets MNCs bid even higher valuation due to their national pride (Hope, Thomas, & Vyas, 2011). In 2007, Indian firms invested US$29,083 million, a phenomenal growth, representing 333% compared to the previous year. One would notice the BRIC group predominantly pushing international investments since 2003, whereas India did so beginning in 2005.
5.3India’s Cross-Border M&A Cases and the Experience
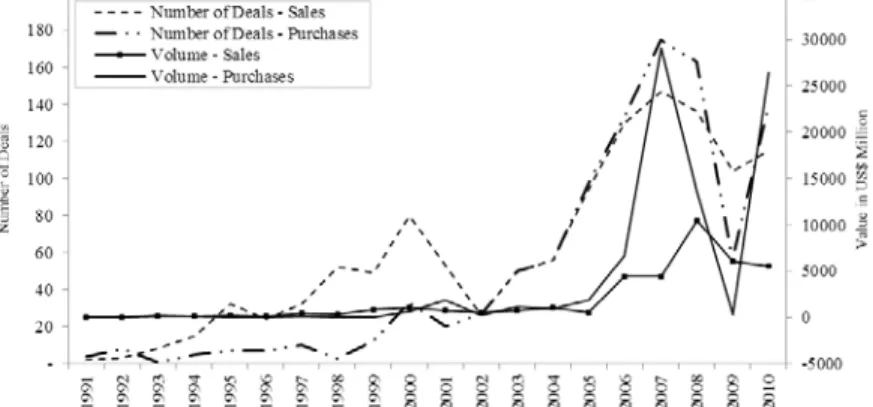
In Table 5 we list a few Indian CB-M&A deals (buy/sell) completed during 2007–2012. The year 2007 stood as the year with the highest number of deals and value of transactions for Indian firms. To prove this statement, we plot a trend line for CB-M&A inbound and outbound market defining the number of deals and value of transactions for the period 1991 through 2010 (Figure 7). The year 2007 shows the highest number of deals as well as the highest value for purchases compared to sales. For example, a few notable transactions include Tata Steel’s acquisition of Corus for US$12.2 billion, Hindalco’s acquisition of Novelis for US$6 billion, and Suzlon Energy purchasing 33.85% of equity stake in RE Power for US$1.7 billion (Afsharipour, 2010; Nayyar, 2008). Thus, we suggest that a number of Indian parent companies have acquired foreign multinationals through their overseas affiliates, and thereby established new foreign affiliates.
In a recent study, Sun et al. (2012) report that top ten overseas deals in China amounted to US$29.08 billion, accounting for 22% of the total CB-M&A during 2000–08, and the top ten transactions in India amounted to US$29.63 billion, representing 49%. In the subsequent years, a few Indian MNCs have lucratively completed the higher amount of deals against their counterparts. For example, Bharti Airtel acquired Kuwait-based Zain Telecom for US$10.7 billion in 2010, Adani Enterprises and GVK Power bought Australian-based Abbot Point Coal for US$1.9 billion and Hancock Coal for US$1.26 billion, respectively in 2011. In addition, we find that a number of Indian firms have become targets for overseas MNCs. For example, UK’s British Petrol acquired some percentage of equity stake in the Reliance Petrol for US$7.2 billion in 2011.
Figure 7. India’s cross-border M&A inbound and outbound deals, 1991–2010 Source: Table 2, Table 3.
Further, the number of deals for sales was notably higher than purchases during 1991–2002, both were moving together until the year 2006 and then, purchase deals surpassed the sales from 2007 to 2010. This finding suggests that a number of Indian companies have become targets for foreign parent firms in light of foreign market entry or other international business venturing models. Indian firms are trying to tap international markets through diverse inorganic strategies, such as joint ventures, alliances, especially M&A mode from the year 2003. As a result, both purchases and sales show similar curve (or, trend) until 2006. From the year 2007, Indian MNCs have invested the highest amount of equity/cash to buy global entities in various developed and developing markets. In the event of 2007–08 global financial crisis, Indian firms were even able to purchase foreign firms because of undervaluation of target assets and availability of debt financing from Indian-based overseas investment bankers (Reddy et al., 2013; Sun et al., 2012).
Conversely, the value of sales and purchases were moving closer until the year 2004, but value of purchase deals noticeably surpassed the value of sales from the year 2005. The rate of growth for purchases sharply declined in 2009, but immediately recovered in 2010. One would think that a set of political, legal and societal changes may have affected the strategies of local and overseas firms when competing in and out of India (Peng, Wang, & Jiang, 2008, p. 926). All in all, we suggest that India’s economic, banking and financial reforms have attracted a number of overseas investment bankers and private equity firms in recent years. Importantly, the economic changes, foreign investment policies and firm-specific characteristics have motivated Indian MNCs to avail potential opportunities in other developing economies, for example, Africa and Middle East regions (Elango & Pattnaik, 2011).
6.
Parent Corporations and Foreign Affiliates, and Additional
Observations
We further analyzed a number of parent corporations (PCs) and foreign affiliates (FAs) of BRIC economies for the year 2010 in order to examine the economic change and its impact on the internationalization process of Indian firms in Table 4. Globally, there were 103,353 PCs and 886,143 Fas. In particular, developed economies had the highest number of PCs (70%) compared to developing economies (30%). In the case of FAs, developing economies accounted for 58%. Indeed, the percentage of BRIC group PCs to the world shows 20% and the group host roughly fifty percent of the total FAs. For example, Asia accounted for 24% of the PCs and 55% of the FAs, where China accounts for 11.61% and 49%, India 1% and 0.23%, Brazil 0.24% and 0.51%, and Russia 0.11%, and 0.24%. Evidently, Chinese FAs are dominating the universe through their PCs that represent nearly 50%, while India’s share is still lower than one percent in both the cases.
Similarly, we computed India’s contribution to developing economies and BRICs. For example, PCs and FAs in India as a percentage of total in developing economies were 3.57% and 0.4% respectively. In the case of the BRIC group, Indian share was 5.38% and 0.45%. Referring to this, Santangelo and Meyer (2011) suggested that commitment plays a key role in EM based subsidiaries' involvement, and thus it may reflect positively or adversely, especially in the EMs global expansion process.
Table 4. Number of parent corporations and foreign affiliates, by region and economy, 2010
China is the only country having a maximum number of PCs and FAs in each segment, such as the world economy, developing economies, Asia and BRICs. Surprisingly, both the UK and the U.S. combined PCs and FAs share is significantly lower than China, but their combined share is higher than India, Brazil and Russia. In the world economy, Chinese PCs represent the highest number of FAs (434,248). Thus, we suggest that China would be a leading economy in terms of global investments and integration, followed by the U.S., the UK and other BRIC economies. Our study also posits that Indian laws relating to foreign operations, acquisitions and collaborations for local firms are stringent and heavily regulated even after the policy reforms in 1991 when compared to China, Brazil, and Russia. For example, Brazil and Russia have the highest number of FAs (18 times of PCs) compared to India (1.89 times). Therefore, Indian policy makers should take a call on deregulation of various foreign laws pertaining to international operations and transactions. If they do, Indian MNCs would gain opportunity to establish higher number of foreign affiliates and subsidiaries. Specifically, FAs help PCs to access global capital, technical work force, technology, culture, ideas and so forth.
6.1Additional Observations
In the aftermath of global financial crisis, China’s CB-M&A sales in terms of number of deals as a percentage of the total for the world economy have noticeably declined since 2006. In contrast, shares of Brazil, India and Russia have increased. From this observation, we conjecture that these countries attracted a significant amount of FDI (inflows) and inbound deals through greenfield investment, acquisitions, alliances and networks. During the same period, BRIC group CB-M&A purchases in terms of number of deals as a percentage of the total for the world economy have shown mixed shares ranging from 0.34% to 4.5%. For example, China and India accounted for more than 2% each, Russia 1% and Brazil less than 1%. We find that 25 countries contribute more than 1% of the world economy CB-M&A sales and 22 countries account for CB-M&A purchases. Specially, the U.S. is the leading country, contributing the highest number of deals for sales. U.S. contributed 17% percent of the total, followed by the UK 10%, Germany 7%, and Canada and France 5% each. Further, we observe a similar order of rankings for purchases. For instance, individually the BRIC group’s contribution for sales and purchases were: Brazil 1.6% and 0.34%; Russia 1.63% and 0.66%; India 1.43% and 1.19%; and China (including Hong Kong) 4.3% and 2.6%, respectively.
Referring to CB-M&A sales in terms of number of deals as a percentage of the total for the world economy, Indian share has increased from 1% in 1998 to 2.45% in 2009, and 2.12% in 2010. Value of transactions share has also increased from 1.5% in 2008 to 2.42% in 2009, and then declined to 1.63% in 2010. On the other hand, CB-M&A purchases in terms of number of deals as a percentage of the total has increased from 1.66% in 2003 to 2.57% in 2010, and value of transactions share has boosted from 1% in 2006 to 7.8% in 2010. Indeed, India’s share represents more than one percent in six years for the number of deals and three years for the value in the last two decades. This phenomenal growth tells that the Indian economic, financial and banking reforms placed the local MNCs in the world map through internationalization process.
During 1990–2010, we notice that India’s number of deals for sales (1,208) was significantly lower than Chinese transactions (3,637), and value of transactions
report US$37,473 million and US$167,262 million, respectively. In the case of outbound deals, China accounted for the highest number of deals (2,217) compared to India (1,008) and value of transactions reported were US$222,011 million and US$83,071 million, respectively. As such, China’s average deal-value accounts were higher than India’s average deal value in both sales and purchases.
Furthermore, we searched for an Indian MNC ranked in the world’s top 100 non-financial transnational corporations (TNCs), ranked by foreign assets for the year 2010. Surprisingly, no Indian TNC ranked in the above list. To examine the outcome of internationalization, we also examined top 100 non-financial TNCs from developing and transition economies, ranked by foreign assets for the year 2009. We found nine TNCs each from China (excluding Hong Kong) and Russia, followed by India (7) and Brazil (3). Regrettably, no Indian TNC ranked in the top 10 list. While Tata Steels ranked 14, Tata Motors 25, public sector undertaking of ONGC 30, Hindalco Industries 33, Suzlon Industries 67, Tata Consultancy Services 69 and Reliance Communications 72. Overall, 28 TNCs were included from the BRIC group.
These TNCs represented productive industries such as diversified, metal and metal products, petroleum and natural gas, and telecommunications. In the top 10 list, we found two TNCs from China, and one each from Brazil and Russia. First rank was obtained by Hong Kong’s diversified firm- Hutchison Whampoa Limited, followed by China’s CITIC group. One would consider that MNCs from developed countries have had to gear up to exploit new opportunities in emerging markets, and MNCs from emerging markets have had to figure out how to take advantage of opportunities and resources in other parts of the world (Ramamurti, 2012, p. 41). A few scholars have suggested that Chinese government’s promotional measures and monetary policies have a significant impact on outward FDI performance (e.g., Luo, Xue, & Han, 2010).
According to the World Investment Report (UNCTAD, 2011), in the country rankings by inward FDI performance index, India ranked 80 in 2008, 67 in 2009 and then sharply tripped over to 97 in 2010. In case of inward FDI potential index, India ranked 86 in 2008 and 79 in 2009.
7.
Policy Implications and Conclusions
In this paper we have highlighted, first, a few issues on India’s economic, banking and financial policy regimes since 1991 and then offered recommendations for betterment of existing economic performance. Secondly, we have summarized the internationalization experience of Indian companies using cross-border M&A strategy over the past two decades. In fact, the purpose of this exploratory research was to examine the Indian market for cross-border M&A deals for the period 1991 through 2010. To accomplish our goals, we adopted an archival source method and thereby presented the Indian experience of cross-border M&A based on inductive and deductive logics. We found that India’s number of deals for CB-M&A sales was notably higher than purchases during 1991–2002; thereafter, both inbound and outbound deals were moving together until the year 2006, then a number of purchases outperformed the number of sales for the year 2007 to 2010. The year 2007 was the magnificent period for Indian MNCs, representing the highest number of deals and value of transactions. By and large, India’s share as a percentage of the
world economy accounted for more than one percent in six years for number of deals and in three years for value of deals. This radical change recognized that economic, financial and banking reforms had placed the local MNCs in the cosmos of internationalization process. Overall, India was next to China in BRIC group, Asia and developing countries segments.
One of our objectives in this research was to find out whether the Indian policy makers had made improvements in 1991’s economic policies. Our research showed they certainly did, but later changed the name of the act. For example, the MRTP Act, 1969 was replaced by the Competition Act, 2002. Similarly, FERA has been renamed as FEMA. Because of these distrustful amendments and changes in various acts by different regulatory bodies, a number of cross-border investment proposals have been delayed, or cancelled. For instance, Vodafone–Hutchison telecom deal has faced tax litigations with Indian tax authorities, and Vedanta acquisition of Cairn Energy stake in Cairn India Limited was completed only after prolonged delay (Reddy, 2015).
In the previous years, a few economic researchers had suggested a need for second-phase economic and financial reforms to strengthen the economy and financial system as well as to prepare a number of local firms for the internationalization (e.g., Dobbs et al., 2010; Farrell & Lund, 2006; Prasad & Rajan, 2008). We suggest that future reforms should be focused on foreign investment limits (both inward and outward), private equity laws, investment-banking for financing the merger proposals, rural banking for improving household savings rate, overseas investments in agriculture and cattle segment for food security, and so forth. In particular, offering direct incentives such as reduced tariff and quantitative restrictions, tax benefits and investment subsidies would attract high-tech MNCs for promoting R&D and innovation (Reddy, Xie, & Huang, 2016). Importantly, friendly relations with other Asian countries (for example, China) in terms of foreign trade via free trade agreements (FTAs) and other skill-based exchange programs are vital aspects of the regional trade. Conversely, country should remove the multiplicity of regulations governing product markets. If distortions in the market for land and widespread government ownership of businesses are properly addressed, India could grow as fast as China, at 10% per year (Di Lodovico, Lewis, Palmade, & Sankhe, 2001, p. 29). As such, savings is the key element in overall economic performance (Farrell & Lund, 2005: 105).
In addition, political leadership is the critical factor in implementing the second phase of Indian economic reforms (Wadhva, 2000). Therefore, we suggest that major efforts should be made to eliminate the culture of bribery and corruption by imposing a system of penalties and incentives (Cheng et al., 2007).
The crux of economic performance of a nation depends upon its policy administration and plan implementation. Hence countries like India must restructure and redefine the public administration and civil services (see Qureshi, Diaz-Sanchez, & Varoudakis, 2015). Our recommendations include providing administrative training in relevant areas, setting up economics and business research organizations with infrastructure and resources, looking closely into rural sectors as to promote more economic and financial savings, designing a comprehensive policy that motivates younger generation to become business entrepreneurs, controlling higher-education malpractices in universities and institutions by establishing a “fraud search committee”, and other related control measures and actions. Indeed, policy
makers should develop a strategic guideline in view of “financing choices in rural villages” and “developing minimum infrastructure facilities in backward districts or areas.” All of this would contribute towards a sustainable economy in India.
When designing policy strategies at the given time, there should be a great coordination and control among related ministries. Nevertheless, one should not freeze ‘public power and control’ for his/her own benefits because it damages social good and good governance. Therefore, banking and financial institutional products and services must reach every corner of the country that would bring more savings and investments. Furthermore, we support ‘The McKinsey’ opinions and arguments. “The consultants observe that India has well-developed equity market compare to the banking sector, but the barrier is that ‘excessive government intervention that distorts the allocation of capital and consequently holds back growth. In addition, the barriers like regulations governing product markets, land market distortions, licensing and quasi-licensing, counterproductive taxation, and the suggestions include rationalizing taxes and excise duties, establishing effective and individual regulators, removing restrictions on FDI, undertaking widespread privatization, and reforming property and tenancy laws. To promote competitive markets, developing countries must reduce restrictions on foreign investment, lower import tariffs, streamline the requirements for starting new business, and encourage new market entrants” (see Böhme et al., 2008; Di Lodovico et al., 2001; Farrell & Lund, 2006; Farrell, Remes, & Schulz, 2004).
One of the limitations associated with our study is that conclusions are restricted to India and the BRIC group. Dynamic statistical tools are not utilized to analyze macroeconomic factors influencing cross-border M&A market for various reasons. EMs research was conducted using a multidisciplinary approach (Kearney, 2012), which gives the opportunity to discuss various theories and models in diverse themes ranging from economies of scale to financial synergy, global trade to internationalization, cultural transformation to cultural adaptation and so forth but in an exploratory sense. Hence more research remains to be done in the Ems setting on deal mechanism, negotiation process, consequences in merger integration, factors affecting merger failure, and post-merger financial performance of MNCs participating in overseas acquisitions using rigorous theories and methodology.
Appendix
Table 5. Cross-border merger and acquisition deals declared by Indian companies, 2007–2012
Endnotes
1. One would certainly notice the growing amount of EM research in diverse aspects of international business, ranging from foreign market entry strategies to performance of subsidiaries of developing-country MNCs established in the developed countries (see Bhabra & Huang, 2013; Dakessian & Feldmann, 2013; Kohli, 2015; Meyer & Thaijongrak, 2013; Nagano, 2013; Ning, Kuo, Strange, & Wang, 2014; Rani, Yadav, & Jain, 2015; Tran & Rios–Morales, 2015; Tsai, Bernard, Plaisent, & Lin, 2014). Only a few scholars have suggested some theories/models pertaining to firms from EMs in international business (see Cuervo-Cazurra, 2012; Hennart, 2012; Peng, Wang, & Jiang, 2008; Peng, Sun, Pinkham, & Chen, 2009). 2. See for extensive literature review on cross-border M&A perspectives (Ferreira, Santos, de Almeida, & Reis, 2014; Martynova & Renneboog, 2008; Reddy, 2014; 2015; Shimizu, Hitt, Vaidyanath, & Pisano, 2004).
3. We consider Hong Kong share for M&A deals in BRIC group; and only Chinese CB-M&A market is considered when we compare “India and China” throughout the study, particularly in sections 5 and 6.
4. See the projected relative size of various countries for 2005–2050 (Cheng et al., 2007, p. 144). 5. Mishra and Sharma (2011) investigate India’s demand for international reserve with emphasis on the role of national monetary disequilibrium. The results reveal that the central bank holds substantial excess reserves, and the related opportunity cost (1.5% of GDP) appears to be quite considerable.
6. Mukherji (2002) describes that liberalization initiated by the Prime Minister Rajiv Gandhi in the mid-1980s proved to be a false dawn as opponents within his party, as well as outside, managed to stifle it. The reforms were confined to industry and services sectors, but ignored the agricultural sector.
7. See the extensive empirical research on 12 developing countries (Argentina, Brazil, Chile, India, Indonesia, Korea, Malaysia, Mexico, Pakistan, Philippines, Taiwan, and Thailand) in light of a new summary index of the efficiency of allocation of investment (Galindo et al., 2007). 8. Additional economic and financial policy reforms include creation of an efficient and profitable financial sector, providing operational and functional autonomy to institutions, etc. Some key measures include political reforms, re-engineering the role of the government, administrative and legal reforms, agricultural sector reforms, industrial restructuring, and financial sector reforms – a substantial deregulation of the stock market especially the new issues market in 1992, controls on the lending rates of banks and term-lending institutions etc. (see Ganesh-Kumar, Sen, & Vaidya, 2001; Mohan, 2006).
9. See Hope et al. (2011) for empirical validation of why firms from developing nations bid higher.
10. See top 25 foreign acquisitions by Indian firms during 2000–2007 (Nayyar, 2008, p. 121). 11. Preliminary results based on data from the companies' financial reporting; corresponds to the financial year from April 1, 2010 to March 31, 2011 (UNCTAD, 2011).
12. All the data is based on the companies’ annual reports; corresponds to the financial year from April 1, 2009 to March 31, 2010 (UNCTAD, 2011).
13. China TNCs ranked 2, 7, 23, 41, 47, 73, 77, 84 and 93; Brazil TNCs ranked 4, 17 and 21; and Russia TNCs ranked 10, 27, 31, 48, 57, 74, 79, 82 and 96.
14. See for BRICs, U.S., EU, and Japanese multinationals ranked in Global Fortune 500 (Peng, 2012, p. 98).
References
Afsharipour, A. 2010. Rising multinationals: Law and the evolution of outbound acquisitions by Indian companies. Available at:
http://lawreview.law.ucdavis.edu/issues/44/3/Lost%20in%20Translation/Afsha ripour.pdf
Ahluwalia, M. S. 1994. India’s quiet economic revolution. Columbia Journal of World Business, 29(1): 6–12.
Ahluwalia, M. S. 2002. Economic reforms in India since 1991: Has gradualism worked? Journal of Economic Perspectives, 16(3): 67–88.
Anandan, R., Kumar, A., Kumra, G., & Padhi, A. 1998. M&A in Asia. The McKinsey Quarterly, 2: 64–75.
Andersen, O. 1993. On the internationalization process of firms: A critical analysis. Journal of International Business Studies, 24(2): 209–231.
Anderson, J., Sutherland, D., & Severe, S. 2015. An event study of home and host country patent generation in Chinese MNEs undertaking strategic asset acquisitions in developed markets. International Business Review, 24(5): 758–771.
Banga, R. 2014. Has South Asia benefited from the growth of Asian emerging economies?. Global Journal of Emerging Market Economies, 6(3): 205–232. Barbopoulos, L., Paudyal, K., & Pescetto, G. 2012. Legal systems and gains from cross-border acquisitions. Journal of Business Research, 65(9): 1301–1312. Basuil, D. A., & Datta, D. K. 2015. Effects of industry-and region-specific
acquisition experience on value creation in cross-border acquisitions: The moderating role of cultural similarity. Journal of Management Studies, 52(6): 766–795.
Bertrand, O., & Betschinger, M.-A. 2012. Performance of domestic and cross-border acquisitions: Empirical evidence from Russian acquirers. Journal of
Comparative Economics, 40(3): 413–437.
Bhabra, H. S., & Huang, J. 2013. An empirical investigation of mergers and acquisitions by Chinese listed companies, 1997–2007. Journal of Multinational Financial Management, 23(3): 186–207.
Bhagat, S., Malhotra, S., & Zhu, P. 2011. Emerging country cross-border
acquisitions: Characteristics, acquirer returns and cross-sectional determinants. Emerging Markets Review, 12(3): 250–271.
Biswas, R. 2011. The M&A business in Indian corporations. Indian Management, February: 14–20.
Bloomberg 2011. Bloomberg – 2011 M&A Outlook. 1–31.
Boateng, A., Hua, X., Uddin, M., & Du, M. 2014. Home country macroeconomic factors on outward cross-border mergers and acquisitions: Evidence from the UK. Research in International Business and Finance, 30: 202–216.
Böhme, M., Chiarella, D., & Lemerle, M. 2008. The growing opportunity for investment banks in emerging markets. The McKinsey Quarterly, 7: 3–9.
Brecher, R. A., & Parker, I. C. 1977. Time structure of production and the theory of international trade. Journal of International Economics, 7(4): 385–402. Cheng, H. F., Gutierrez, M., Mahajan, A., Shachmurove, Y., & Shahrokhi, M.
2007. A future global economy to be built by BRICs. Global Finance Journal, 18(2): 143–156.
Choudhury, M. 2010. Bank funding and firm investment in underdeveloped financial markets: Evidence from India. Macroeconomics and Finance in Emerging Market Economies, 3(2): 227–244.
Collins, J. D., Holcomb, T. R., Certo, S. T., Hitt, M. A., & Lester, R. H. 2009. Learning by doing: Cross-border mergers and acquisitions. Journal of Business Research, 62(12): 1329–1334.
Conklin, D. W. 2005. Cross-border mergers and acquisitions: A response to environmental transformation. Journal of World Business, 40(1): 29–40. Corhay, A., & Rad, T. A. 2000. International acquisitions and shareholder wealth:
Evidence from the Netherlands. International Review of Financial Analysis, 9(2): 163–174.
Cuervo-Cazurra, A. 2012. Extending theory by analyzing developing country multinational companies: solving the goldilocks debate. Global Strategy Journal, 2(3): 153–167.
Dakessian, L. C., & Feldmann, P. R. 2013. Multilatinas and value creation from cross-border acquisitions: an event study approach. BAR-Brazilian Administration Review, 10(4): 462–489.
Das, A., & Kapil, S. 2012. Explaining M&A performance: a review of empirical research. Journal of Strategy and Management, 5(3): 284–330.
Deng, P. 2009. Why do Chinese firms tend to acquire strategic assets in international expansion? Journal of World Business, 44(1): 74–84.
Department of Disinvestment 2007. Disinvestment of central public sector
enterprises. White Paper, New Delhi: Ministry of Finance, Government of India. Di Lodovico, A. M., Lewis, W. W., Palmade, V., & Sankhe, S. 200. India- from
emerging to surging. The McKinsey Quarterly, 4: 28–50.
Dobbs, R., & Gupta, R. 2009. An Indian approach to global M&A: An interview with the CFO of Tata Steel. The McKinsey Quarterly, 33(October): 1–8. Dobbs, R., Lund, S., & Schreiner, A. 2010. How the growth of emerging markets
will strain global finance, The McKinsey Quarterly, December.
Dongre, A. P. 2012. Policy changes in the wake of globalization and its impact on Indian industries. Journal of Policy Modeling, 34(3): 476–496.
Drummond, A. 2012. Research on emerging economies: Challenges are always opportunities. Global Strategy Journal, 2(1): 48–50.
Dunning, J. H. 1988. Explaining International Production. London: Unwin Hyman. Elango, B., & Pattnaik, C. 2011. Learning before making the big leap: Acquisition
strategies of emerging market firms. Management International Review, 51(4): 461–481.
Erel, I., Liao, R. C., & Weisbach, M. S. 2012. Determinants of cross-border mergers and acquisitions. Journal of Finance, 67(3): 1045–1082.
Ernst & Young. 2010. Doing business in India – A report by E&Y. India: Ernst & Young Private Limited.
Evans, A. 2004. Forecasting India's potential. The Round Table, 93(376): 595–608. Farrell, D., & Lund, S. 2005. Reforming India’s financial system. The McKinsey
Quarterly, (special edition: fulfilling India’s promise), 103–111.
Farrell, D., & Lund, S. 2006. China’s and India’s financial systems: a barrier to growth. The McKinsey Quarterly, (November): 1–12.
Farrell, D., Remes, J. K., & Schulz, H. 2004. The truth about foreign direct investment in emerging markets. The McKinsey Quarterly, (No.1): 25–35. Fels, R. 1952. The theory of business cycles. The Quarterly Journal of Economics,
66(1): 25–42.
Ferreira, M. P., Santos, J. C., de Almeida, M. I. R., & Reis, N. R. 2014. Mergers & acquisitions research: A bibliometric study of top strategy and international business journals, 1980–2010. Journal of Business Research, 67(12): 2550–2558. Galindo, A., Schiantarelli, F., & Weiss, A. 2007. Does financial liberalization
improve the allocation of investment? Micro-evidence from developing countries. Journal of Development Economics, 83(2): 562–587.
Ganesh-Kumar, A. Sen, K., & Vaidya, R. R. 2001. Outward orientation, investment and finance constraints: a study of Indian Firms. Journal of Development Studies, 37(4): 133–149.
Geringer, J. M., Beamish, P. W., & Dacosta, R. S. 1989. Diversification strategy and internationalization: Implications for MNE performance. Strategic
Management Journal, 10(2): 109–119.
Ghosh, C., Harding, J., & Phani, B. V. 2008. Does liberalization reduce agency costs? Evidence from the Indian banking sector. Journal of Banking & Finance, 32(3): 405–419.
Hattari, R., & Rajan, R.S. 2010. India as a source of outward foreign direct investment. Oxford Development Studies, 38(4): 497–518.
Hennart, J.-F. 2012. Emerging market multinationals and the theory of the multinational enterprise. Global Strategy Journal, 2(3): 168–187.
Herd, R., Koen, V., Patnaik, I., & Shah, A. 2011. Financial sector reform in India: time for a second wave? OECD Economics Department Working Papers, No. 879, OECD Publishing. http://dx.doi.org/10.1787/5kg8ghvzr2jk-en (accessed February 21, 2012).
Holtbrügge, D., & Kreppel, H. 2012. Determinants of outward foreign direct investment from BRIC countries: An explorative study. International Journal of Emerging Markets, 7(1): 4–30.
Hope, O.-K., Thomas, W. & Vyas, D. 2011. The cost of pride: Why do firms from developing countries bid higher? Journal of International Business Studies, 42(1): 128–151.
Hoskisson, R., Wright, M., Filatotchev, I., & Peng, M. W. 2013. Emerging multinationals from mid-range economies: The influence of institutions and factor markets. Journal of Management Studies, 50(7): 1295–1321. Jaffry, S., Ghulam, Y., Pascoe, S., & Cox, J. 2007. Regulatory changes and
productivity of the banking sector in the Indian sub-continent. Journal of Asian Economics, 18(3): 415–438.
Johanson, J., & Vahlne, J.-E. 1977. The internationalization process of the firm - a model of knowledge development and increasing foreign market commitments. Journal of International Business Studies, 8(1): 23–32.
Kearney, C. 2012. Emerging markets research: Trends, issues and future directions. Emerging Markets Review, 13(2): 159–183.
Ketkar, S. 2012. Institutional development, economic liberalisation and firm internationalisation. International Journal of Business and Globalisation, 9(4): 412–430.
Khandwalla, P. N. 2002. Effective organizational response by corporates to India’s liberalization and globalization. Asia Pacific Journal of Management, 19(2/3): 423–448.
Kling, G., Ghobadian, A., Hitt, M. A., Weitzel, U., & O'Regan, N. 2014. The effects of cross-border and cross-industry mergers and acquisitions on home-region and global multinational enterprises. British Journal of Management, 25(S1): S116–S132.
Kohli, R. 2015. Financing strategies and shareholders’ risk in cross border acquisitions in India. International Journal of Commerce and Management, 25(3): 294–308.
KPMG 2010. M&A Year Book – 2010 Edition, 1–56. Switzerland: KPMG AG. KPMG 2012. M&A Year Book – 2012 Edition, 1–48. Switzerland: KPMG AG. Kumar, N. 2009. How emerging giants are rewriting the rules of M&A. Harvard
Business Review, 87(5): 115–121.
Kumar, S. 2013. Banking reforms and the evolution of cost efficiency in Indian public sector banks. Economic Change and Restructuring, 46(2): 143–182. Lebedev, S., Peng, M. W., Xie, E., & Stevens, C. E. 2015. Mergers and acquisitions
in and out of emerging economies. Journal of World Business, 50(4): 651–662. Liu, X., & Zou, H. 2008. The impact of greenfield FDI and mergers and acquisitions
on innovation in Chinese high-tech industries. Journal of World Business, 43(3): 352–364.
Luo, Y., Sun, J., & Wang, S. L. 2011. Comparative strategic management: An emergent field in international management. Journal of International Management, 17(3): 190–200.
Luo, Y., Xue, Q., & Han, B. 2010. How emerging market governments promote outward FDI: Experience from China. Journal of World Business, 45(1): 68–79.
Madhok, A., & Keyhani, M. 2012. Acquisitions as entrepreneurship: Asymmetries, opportunities, and the internationalization of multinationals from emerging economies. Global Strategy Journal, 2(1): 26–40.
Malhotra, S., Sivakumar, K., & Zhu, P. 2011. A comparative analysis of the role of national culture on foreign market acquisitions by U.S. firms and firms from emerging countries. Journal of Business Research, 64(7): 714–722. Martynova, M., & Renneboog, L. 2008. A century of corporate takeovers: What
have we learned and where do we stand? Journal of Banking & Finance, 32(10): 2148–2177.
Mehrotra, S. 2010. India and the global economic crises. Journal of Asian Public Policy, 3(2): 122–134.
Meyer, K. E., & Thaijongrak, O. 2013. The dynamics of emerging economy MNEs: How the internationalization process model can guide future research. Asia Pacific Journal of Management, 30(4): 1125–1153.
Mishra, R. K., & Sharma, C. 2011. India’s demand for international reserve and monetary disequilibrium: Reserve adequacy under floating regime. Journal of Policy Modeling, 33(6): 901–919.
Mohan, R. 2006. Financial sector reforms and monetary policy: The Indian experience. Conference on Economic Policy in Asia at Stanford, Stanford Center for International Development and Stanford Institute for Economic Policy Research, June 2, 2006.
Moore, T., Green, C. J., & Murinde, V. 2006. Financial sector reforms and stochastic policy simulations: A flow of funds model for India. Journal of Policy Modeling, 28(3): 319–333.
Mukherji, A., Mukherji, J., Dibrell, C., & Francis, J. D. 2013. Overbidding in cross-border acquisitions: Misperceptions in assessing and valuing knowledge. Journal of World Business, 48(1): 39–46.
Mukherji, J. 2002. India's long march to capitalism. India Review, 1(2): 29–60. Nagano, M. 2013. Similarities and differences among cross-border M&A and
greenfield FDI determinants: Evidence from Asia and Oceania. Emerging Markets Review, 16: 100–118.
Nagano, M., & Yuan, Y. 2013. Cross-border acquisitions in a transition economy: The recent experiences of China and India. Journal of Asian Economics, 24(1): 66–79.
Nayyar, D. 2008. The Internationalization of firms from India: Investment, mergers and acquisitions. Oxford Development Studies, 36(1): 111–131.
Nicholson, R. R., & Salaber, J. 2013. The motives and performance of cross-border acquirers from emerging economies: Comparison between Chinese and Indian firms. International Business Review, 22(6): 963–980.
Ning, L., Kuo, J. M., Strange, R., & Wang, B. 2014. International investors’ reactions to cross-border acquisitions by emerging market multinationals. International Business Review, 23(4): 811–823.
Norbäck, P.-J., & Persson, L. 2008. Globalization and profitability of cross-border mergers and acquisitions. Economic Theory, 35(2): 241–266.
Pablo, E. 2013. Cross-border diversification through M&As in Latin America. Journal of Business Research, 66(3): 425–430.
Paul, J., & Bhawsar, P. 2011. Japanese acquisition in India’s Ranbaxy.
Competitiveness Review: An International Business Journal, 21(5): 452–470. Peng, M. W. 2003. Institutional transitions and strategic choices. Academy of
Management Review, 28(2): 275–296.
Peng, M. W. 2012. The global strategy of emerging multinationals from China. Global Strategy Journal, 2(2): 97–107.
Peng, M. W., Wang, D., & Jiang, Y. 2008. An institution-based view of international business strategy: a focus on emerging economies. Journal of International Business Studies, 39(5): 920–936.
Peng, M.W., Sun, S.L., Pinkham, B., & Chen, H. 2009. The institution-based view as a third leg for a strategy tripod. Academy of Management Perspectives, 23(3): 63–81.
Penrose, E. T. 1959. The Theory of the Growth of the Firm. Oxford: Blackwell. Prasad, E. S., & Rajan, R. G. 2008. Next generation financial reforms for India.
Finance & Development, (September): 23–27.
Qureshi, Z., Diaz-Sanchez, J. L., & Varoudakis, A. 2015. The post-crisis growth slowdown in emerging economies and the role of structural reforms. Global Journal of Emerging Market Economies, 7(2): 179–200.
Ramakrishnan, K. 2008. Long-term post-merger performance of firms in India. Vikalpa, 33(2): 47–63.
Ramamurti, R. 2012. What is really different about emerging market multinationals? Global Strategy Journal, 2(1): 41–47.
Ramaswamy, K., & Renforth, W. 1996. Competitive intensity and technical efficiency in public sector firms: Evidence from India. International Journal of Public Sector Management, 9(3): 4–17.
Rani, N., Yadav, S. S., & Jain, P. K. 2015. Financial performance analysis of mergers and acquisitions: evidence from India. International Journal of Commerce and Management, 25(4): 402–423.
Rasedie, K., & Srinivasan, G. 2011. Investment bank market share and the performance of acquiring companies: Canadian evidence. Journal of Comparative International Management, 14(1).
Reddy, K. S., Nangia, V. K., & Agrawal, R. 2013. Indian economic-policy reforms, bank mergers, and lawful proposals: The ex-ante and ex-post ‘lookup’. Journal of Policy Modeling, 35(4): 601–622.
Reddy, K. S. 2014. Extant reviews on entry-mode/internationalization, mergers & acquisitions, and diversification: Understanding theories and establishing interdisciplinary research. Pacific Science Review, 16(4): 250–274.
Reddy, K. S. 2015. The state of case study approach in mergers and acquisitions literature: A bibliometric analysis. Future Business Journal (in press). Reddy, K. S., Xie, E., & Huang, Y. 2016. Contractual buyout -A legitimate growth
model in the enterprise development: Foundations and implications.
International Journal of Management and Enterprise Development (in press). Reed, A. M. 2002. Corporate governance reforms in India. Journal of Business
Ethics, 37(3): 249–268.
Reus, T. H. 2012. Culture’s consequences for emotional attending during cross-border acquisition implementation. Journal of World Business, 47(3): 342–351. Santangelo, G. D. & Meyer, K. E. 2011. Extending the internationalization process
model: Increases and decreases of MNE commitment in emerging economies. Journal of International Business Studies, 42(7): 894–909.
Sanyal, M. 2012. Rebuild brand India. Business Today, 21(15): 14–15.
Schumpeter, J. A. 1939. Business Cycles - A Theoretical, Historical and Statistical Analysis of the Capitalist Process. New York: McGraw-Hill.
Serdar Dinc, I., & Erel, I. 2013. Economic nationalism in mergers and acquisitions. Journal of Finance, 68(6): 2471–2514.
Shah, A. M. 2012: Business strategies in the emerging markets. Journal of Asia-Pacific Business, 13(1): 4–15.
Shimizu, K., Hitt, M. A., Vaidyanath, D., & Pisano, V. 2004. Theoretical foundations of cross-border mergers and acquisitions: A review of current research and recommendations for the future. Journal of International Management, 10(3): 307–353.
Sivertsen, C. B. 2012. A mixed year for M&A. The McKinsey Quarterly, January. Sood, A., & Szyf, Y. A. 2011. Productivity and technology for Asia’s growth.
Global Journal of Emerging Market Economies, 3(3): 313–334.
Srivastava, R., & Prakash, A. 2014. Value creation through cross-border mergers and acquisitions by the Indian pharmaceutical firms. Journal of Strategy and Management, 7(1): 49–63.
Stepanok, I. 2015. Cross-border mergers and greenfield foreign direct investment. Review of International Economics, 23(1): 111–136.
Stiglitz, J. E. 2003. Globalization and growth in emerging markets and the new economy. Journal of Policy Modeling, 25(5): 505–524.
Sun, S. L., Peng, M. W., Ren, B., & Yan, D. 2012. A comparative ownership advantage framework for cross-border M&As: The rise of Chinese and Indian MNEs. Journal of World Business, 47(1): 4–16.
Thomson Reuters. 2012. Emerging markets M&A review – Financial advisors. First Quarter Report, 1–16.
Tran, Q. V. K., & Rios–Morales, R. 2015. The influence of financial slack resources over cross–border acquisitions. Global Business and Economics Review, 17(1): 1–18.