UNF Digital Commons
UNF Digital Commons
UNF Graduate Theses and Dissertations Student Scholarship2020
A North Florida High School Attendance Program Evaluation
A North Florida High School Attendance Program Evaluation
Heather Bundshuh [email protected]
Follow this and additional works at: https://digitalcommons.unf.edu/etd
Part of the Secondary Education Commons
Suggested Citation Suggested Citation
Bundshuh, Heather, "A North Florida High School Attendance Program Evaluation" (2020). UNF Graduate Theses and Dissertations. 940.
https://digitalcommons.unf.edu/etd/940
This Doctoral Dissertation is brought to you for free and open access by the Student Scholarship at UNF Digital Commons. It has been accepted for inclusion in UNF Graduate Theses and Dissertations by an authorized administrator of UNF Digital Commons. For more information, please contact Digital Projects. © 2020 All Rights Reserved
A NORTH FLORIDA HIGH SCHOOL ATTENDANCE PROGRAM EVALUATION by
Heather Bundshuh
A dissertation submitted to the Department of Leadership, School Counseling & Sport Management in partial fulfillment of the requirements for the degree of Doctor of Educational
Leadership
UNIVERSITY OF NORTH FLORIDA
COLLEGE OF EDUCATION AND HUMAN SERVICES March 2020
The dissertation of Heather Bundshuh is approved:
______________________________________ ________________________
Dr. Anne Swanson Date
Committee Chair
______________________________________ ________________________
Dr. Matthew Ohlson Date
Committee Member
______________________________________ ________________________
Dr. Daniel Dinsmore Date
Committee Member
______________________________________ ________________________
Dr. DeArmas Graham Date
Dedication
I dedicate this accomplishment to my family. First, to my husband and son for all their help, love and support while I pursued my doctorate. Also, my mother, my sister, and my late father for all their love, support and encouragement throughout my entire life; you always made me feel like I could do anything. Through the late nights and busy days, my family continued to encourage, support, and love me as I embarked on this fruitful journey.
Acknowledgement
First, I give all the glory for this accomplishment to my Lord. It is through His endless mercies and blessings that I have been able to accomplish this. It is through Him that I was able to find relentless, supernatural strength when my own strength was not enough.
Secondly, I want to express my deepest appreciation and gratitude to my dissertation committee. Dr. Anne Swanson, thank you for all of hours you helped direct and refocus me as you encouraged me along the way. I would never have made it to this point without your help. Through your mentorship, you have equipped me with direction and confidence to accomplish this monumental task. Dr. Matthew Ohlson, thank you for all your words of encouragement and being my own personal cheerleader. Your selfless service to me has impacted me in several ways. Dr. Daniel Dinsmore, thank you for all your assistance with my methodology and your patience getting me through it. Due to your foundational concepts for research, I found clarity in my vision for this program evaluation. Dr. DeArmas Graham, thank you for your enthusiastic encouragement. On the days I encountered you, you always found a way to bring my spirits up and made me feel I could continue when I was discouraged.
Third, I would like to thank St. Johns County School District for allowing me to do this program evaluation. There are various members of the district leadership team that have assisted me in securing the approval for the application to conduct research in St. Johns County School District. Also, thank you to all my Creekside High School family for the gentle encouraging and faith in me to complete this momentous task.
Lastly, I want to thank my friends and family. Ala’a, thank you for all the days you helped me edit and format my paper. Also, thank you for all the meals, coffee, and treats. On the
days we spent together, you were my sounding board and place of refuge. Our fellowship together during the countless hours of writing and editing kept me in good spirits.
Finally, to my family, I want you to know how much you mean to me and I would never have made it to this point without your support. Not only did you encourage and support me, but you took on various household duties that freed up more time to complete my dissertation. I love you.
TABLE OF CONTENTS Dedication ... 3 Acknowledgement ... 4 List of Tables ... 10 List of Figures ... 11 Abstract ... 12 Chapter 1: Introduction ... 13
Philosophical Underpinnings of Pedagogical and Attendance Practices ... 13
What Drew Me to This Study ... 14
Problem Statement ... 14
Study Purpose Statement ... 15
Program Evaluation Questions ... 15
Significance of the Study ... 15
Compulsory Education... 15
Definition of Terms... 18
Chapter 2: Literature Review ... 20
Introduction ... 20
Compulsory Education Law ... 20
Importance of Attendance and Poor Attendance ... 20
Compulsory Education Laws ... 22
Strategies to Reduce Student Absenteeism ... 23
Identification of Contributors to Poor Attendance... 24
Strategies to increase attendance. ... 24
A Theoretical Framework of Servant Leadership ... 30
Summary ... 32
Chapter 3: Methodology ... 33
Chapter Overview ... 33
Rationale for the Program Evaluation... 33
Problem statement. ... 33
Purpose statement. ... 33
Program Evaluation Questions. ... 34
Context of the Program Evaluation... 34
Program evaluation. ... 34
Steps taken for the program evaluation. ... 34
Participant selection. ... 34
Program Evaluation Population. ... 35
Description of St. Johns County School District. ... 35
Creekside High School’s Vision Statement. ... 41
Summary of St. Johns County high schools’ demographic information. ... 42
Program Evaluation Methodology ... 48
St. Johns County School District attendance policy. ... 48
Creekside High School’s attendance procedures. ... 52
Data Analysis ... 54
Chapter 4: Results and Analysis of Data ... 55
The Change of Percentage of Students with 21 or More Absences at Creekside High School Over Time from 2013-2018 ... 56
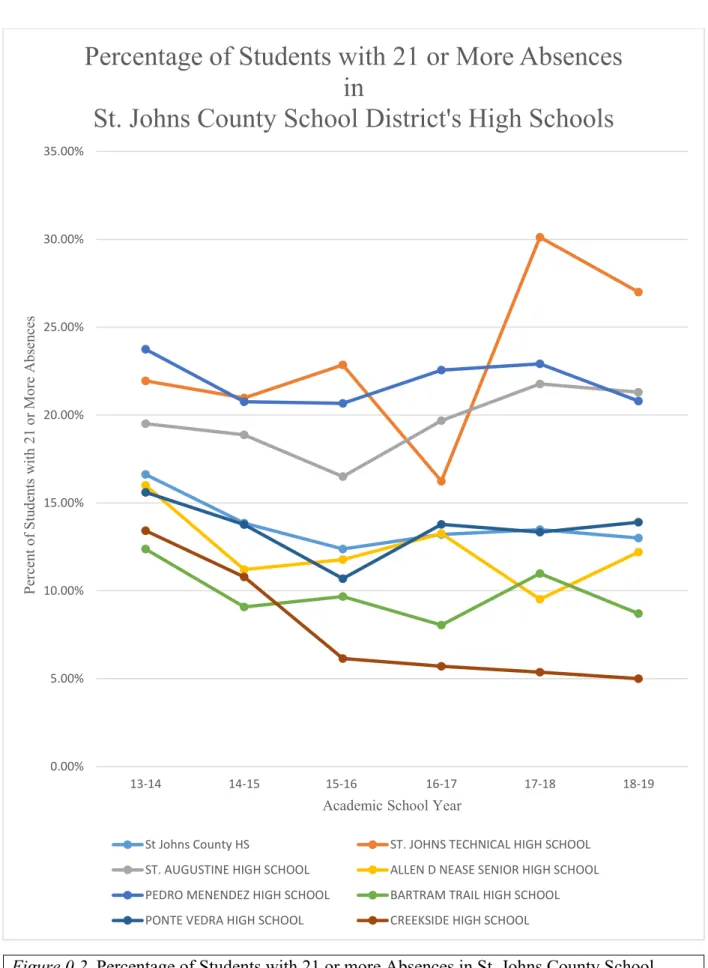
The Change Over Time at Creekside High School Compared to Other St. Johns County District High Schools in the Percentage of Students With 21 or More Absences ... 58
The Effect of Changes to Creekside High School’s Attendance Processes on the Percentage of Creekside High Schools’ Students with 21 or More Absences ... 66
Chapter 5: Conclusions and Recommendations ... 67
Discussion ... 68
Delimitations and Limitations ... 69
Implications for Practice ... 70
Recommendations for Future Research ... 71
Conclusion ... 71
References ... 73
Appendix 2- 15 Total Days Letters ... 80
Appendix 3- 5, 10, 15 Days Unexcused Letters (Summary) ... 81
Appendix 4- 5 or More Days Unexcused Absences Sample Letter... 82
Appendix 5- 10 or More Days Unexcused Absences Sample Letter... 83
Appendix 6- 15 or More Days Unexcused Absences Sample Letter... 84
Appendix 7- University of North Florida IRB Approval Letter ... 85
List of Tables
Table 3.1. St. John’s County School District Growth Over Time from 2014 to 2019 ... 37 Table 3.2. St. Johns School District Demographics Percentage by High School ... 38 Table 3.3. St. Johns School District Ethnicity Data by Percent ... 43 Table 3.4. Percentage of Students Below 90% by School Level during the 2018-2019 School Year ... 44 Table 3.5. Percentage of Students Below 90% Attendance by High School during the 2018-2019 School Year ... 45 Table 3.6. Percentage of Students Suspended by School Level in St. Johns County School District during the 2018-2019 School Year ... 46 Table 3.7. Percentage of Students Suspended by High School during the 2018-2019 School Year ... 47 Table 3.8. State, District and School Level Policy Comparison ... 49 Table 3.9. Attendance Practices Specific to Creekside High School ... 51 Table 4.1. Percentage of Students with 21 or More Absences by High School in St. Johns County School District from the 2013-2014 Academic Year to 2018-2019 Academic Year ... 60
List of Figures
Figure 4.1. Percentage of Students with 21 or more Absences at Creekside High School From 2013-2014 to 2018-2019 Academic School Years ... 57 Figure 4.2. Percentage of Students with 21 or more Absences in St. Johns County School District High Schools From 2013-2019 ... 62 Figure 4.3. Percentage of Students Below 90% Attendance by St. Johns County District High Schools ... 63 Figure 4.4. Percentage of Students Suspended one or more times by St. Johns County School District High School ... 64 Figure 4.5. Ethnic Majorities and Minorities in St. Johns County School District High Schools 65 Figure 4.6. Enrollment by St. Johns County School District High Schools ... 66
Abstract
The purpose of this program evaluation was to evaluate the attendance program at Creekside High School. Creekside High School is a large suburban high school in St. Johns County School District in Northeastern Florida. This program evaluation used longitudinal data over six years, retrieved from the Florida Department of Education’s website, to show the impact of Creekside High School’s attendance program on rates of absenteeism, specifically the
percentage of students that were absent 21 or more days. This program evaluation compared Creekside High School with the other high schools in St. Johns County School District. This program evaluation is not generalizable.
Creekside High School’s attendance program was successful as it lowered the percentage of students that were absent 21 or more days from 13.42% in the 2013-2014 academic school year to 5.00% in the 2018-2019 academic school year. Potential reasons for this drop in absenteeism are strategies identified in the review of literature that are practiced at Creekside High School. Those strategies were identifying contributors to an individual student’s poor attendance; develop a strong student teacher rapport; creating a caring presence; monitoring attendance on a regular basis; developing accountability systems for students; educate students and parents about the benefits of regular attendance; enlisting the support of mentors in the larger community; and evaluating school policy and practices.
Keywords: Attendance, absenteeism, servant leadership, relationships, rapport, accountability, caring
Chapter 1: Introduction
One of the primary purposes of education is for students to learn and to learn to think in such a way that they can solve critical problems (Enciso, Enciso & Daza, 2017; Heider, 2009). As an educator, I attempted to support students as they construct knowledge based on their prior knowledge and experiences. In my work as an attendance dean this approach extended beyond academic subjects to include student engagement and attendance at school.
Philosophical Underpinnings of Pedagogical and Attendance Practices
The basis for the attendance practices that I initiated and continue to practice are housed in my philosophy of leadership and my philosophy of education.
My philosophy of leadership is servant leadership. Servant leadership in schools includes a commitment to listening and forming deeper relationships, empathy, and a commitment to the empowerment and growth of others. It also includes building trust, community and building relationships to better students (Greenleaf, 1977).
As an educator, my experiences have convinced me that children learn best by being active participants in their own learning and by addressing any misconceptions that they may hold. The philosophy of education that I most strongly identify with is constructivism.
Constructivism is the theory that knowledge is constructed in the mind of the learner (Bodner, 1986; Piaget, 2006). As both a chemistry teacher and dean, and as the author of this program evaluation, my practice has encouraged students to take an active role in their learning. My interactions with students supported student participation and students confronting their own behaviors and ideas. Students learn if they can identify that an occurrence or idea does not line up with what they previously thought. As a classroom teacher, I operationalized this philosophy of education by having students predict what they expected to happen prior to an experiment,
based on what they currently thought. Then they would perform a guided experiment and then write about how their predictions matched or conflicted with what they expected. I believe that simply telling students what will happen does not change what they think. They must experience it and confront their misconceptions.
What Drew Me to This Study
I have been in education for 14 years. I taught chemistry for eight years, three in Duval County at Robert E. Lee High School and five years in St. Johns County School District at Creekside High School. I have been a dean of students for the last six years at Creekside High School. As a classroom teacher, I realized very quickly that students who were frequently absent struggled with the material in chemistry much more than students that were regularly in class. Additionally, it was much harder for absent students to do labs and thus get a more
comprehensive understanding of chemistry concepts. When I transitioned into the dean of students’ role, I also took over as the school attendance dean. It was at this time I realized that most students who had excessive absences also tended to struggle in some or most of their classes. In realizing this it became my mission to help students decrease their absences. Problem Statement
A fundamental concern with poor attendance is that students cannot learn the intended curriculum if they are not in school. The impact of chronic absenteeism is devastating because it can lead to poor academic achievement, increased dropout rates, and the school-to-prison
pipeline (Balfanz & Cornfeld, 2016). Educators and policymakers cannot truly understand achievement gaps or efforts to close them without considering factors of chronic absenteeism (Balfanz & Byrnes, 2012).
Study Purpose Statement
The purpose of this program evaluation was to evaluate the effectiveness of an attendance program at Creekside High School, a large suburban high school in St. Johns County School District in Northeast Florida.
Program Evaluation Questions
PEQ1: What was the change over time from 2013-2019 of the percentage of students with 21 or more absences at Creekside High School?
PEQ2: How did the change over time at Creekside High School compare to other public high schools in St. Johns County School District in the percentage of students with 21 or more absences?
PEQ3: What was the effect of changes to Creekside High School’s attendance processes on the percentage of Creekside High Schools’ students with 21 or more absences?
Significance of the Study
Compulsory Education. Florida public high schools operate under several statutory regulations. The section of the 2019 Florida Statutes title XLVIII, K-20 Education Code, includes chapters 1000-1013. The attendance piece is housed in chapter 1003 (Public K-12 Education), part II (School Attendance). The attendance requirements are outlined in the following according to the 2019 Florida Statutes 1003.21 (2020):
(1)(a)1. All children who have attained the age of 6 years or who will have attained the age of 6 years by February 1 of any school year or who are older than 6 years of age but who have not attained the age of 16 years, except as otherwise provided, are required to attend school regularly during the entire school term.
2. Children who will have attained the age of 5 years on or before September 1 of the school year are eligible for admission to public kindergartens during that school year under rules adopted by the district school board.
(b) Any child who has attained the age of 6 years on or before
September 1 of the school year and who has been enrolled in a public school or who has attained the age of 6 years on or before September 1 and has
satisfactorily completed the requirements for kindergarten in a private school from which the district school board accepts transfer of academic credit, or who otherwise meets the criteria for admission or transfer in a manner similar to that applicable to other grades, shall progress according to the district’s student progression plan. However, nothing in this section shall authorize the state or any school district to oversee or exercise control over the curricula or academic programs of private schools or home education programs.
(c) A student who attains the age of 16 years during the school year is not subject to compulsory school attendance beyond the date upon which he or she attains that age if the student files a formal declaration of intent to terminate school enrollment with the district school board. Public school students who have attained the age of 16 years and who have not graduated are subject to
compulsory school attendance until the formal declaration of intent is filed with the district school board. The declaration must acknowledge that terminating school enrollment is likely to reduce the student’s earning potential and must be signed by the student and the student’s parent. The school district shall notify the student’s parent of receipt of the student’s declaration of intent to terminate
school enrollment. The student’s certified school counselor or other school personnel shall conduct an exit interview with the student to determine the reasons for the student’s decision to terminate school enrollment and actions that could be taken to keep the student in school. The student’s certified school counselor or other school personnel shall inform the student of opportunities to continue his or her education in a different environment, including, but not limited to, adult education and high school equivalency examination preparation.
Additionally, the student shall complete a survey in a format prescribed by the Department of Education to provide data on student reasons for terminating enrollment and actions taken by schools to keep students enrolled. (para.1-2)
What this meant to me is that Florida’s compulsory education laws require that everyone between the ages of six and sixteen must attend school for the entire school term. It is the state’s duty to both educate children living in the state and its prerogative to prescribe attendance requirements. Furthermore, according to the Florida Department of Education, (personal
communication, July 8, 2019), “the department has produced a report, Absent 21+ Days, tracking students who are absent 21 or more days in a school year for nearly a decade, with the
understanding that students who miss that many days have missed more than a month (20 days) of school. The more school a student misses, the greater the challenge they face keeping up with the pace of the material their classmates are being taught and the more likely they are to fall behind.”
Definition of Terms
The following definition of terms and phrases is to provide a common understanding for this program evaluation.
1. Average daily attendance
“Average Daily Attendance (ADA) "is the average number of students actually present each day school was in session (aggregate days attendance divided by total days school was in session)” (Florida Department of Education, 2020b).
2. Average Daily Membership
“Average Daily Membership (ADM) is the average number of students on the current roll of the school each day school was in session (aggregate days membership divided by total days school was in session)” (Florida Department of Education, 2020b). 3. Chronic absenteeism
When a student misses ten percent or more of the school year regardless of whether the student’s absences are excused or unexcused (Antworth, 2008; Balfanz & Byrnes, 2012; Faria, et al., 2017 & My Brother’s Keeper 2016 Progress Report, 2016). 4. Cohort-based dropout rate
The “percentage of students who drop out of school within four years of their first enrollment in ninth grade” (Florida Department of Education, 2020c).
5. Dropout
“A student who withdraws from school for any of several reasons without transferring to another school, home education program or adult education program” (Florida Department of Education, 2020c).
The student is eligible for free/ reduced-price lunch (Florida Department of Education, 2020b).
7. Graduation Rate
“Florida’s high school graduation rate is based on the percentage of students who graduated with a standard diploma within four years of their first-full year of enrollment in ninth grade in the state. However, adjustments are made to this cohort over time to add incoming transfer students based on their grade level and year of entry; deceased
students; and students who withdrew to attend school in another state, private school, or home-education program” (Florida Department of Education, 2020b).
8. Truant
“Florida law defines "habitual truant" as a student who has 15 or more unexcused absences within 90 calendar days with or without the knowledge or consent of the
student's parent or guardian, and who is subject to compulsory school attendance” (Florida Department of Education, 2020b).
9. Twenty-one or more total absences
“Percentage of students that were absent twenty-one or more total days for the school year” (Florida Department of Education, 2020b).
Chapter 2: Literature Review Introduction
The following literature review will outline previously published literature that
establishes why attendance is important, strategies to reduce absenteeism, and servant leadership. Compulsory Education Law
Compulsory education laws require that children and adolescents must attend school in order to receive an education. According to the 2019 Florida Statute 1003.21, students between the ages of six and sixteen must attend school for the entire school term (The 2019 Florida Statutes, 2020). It is the state’s duty to both educate children living in the state and its prerogative to prescribe attendance requirements. Nonetheless, the nation has a severe absenteeism issue (Reardon, 2008; Skinner, 2014) which will be discussed in this literature review.
Importance of Attendance and Poor Attendance
Chronic absenteeism is defined as a student missing ten percent or more of the school year regardless of whether the student’s absences are excused or unexcused (Antworth, 2008; Balfanz & Byrnes, 2012; Faria, et al., 2017 & My Brother’s Keeper 2016 Progress Report, 2016). According to the U.S. Department of Education Office for Civil Rights, “eighteen percent of all high school students are chronically absent” (2016, p. 7). Students who are chronically absent could ultimately face more obstacles including lower academic achievement which may eventually lead to dropping out of school (Allensworth, Easton, & Consortium on Chicago School Research, 2007; Balfanz, 2016; Balkıs, Arslan, & Duru, 2016; My Brother’s Keeper 2016 Progress Report, 2016). Poor attendance can be confounded when race and
socioeconomic status are considered (Balfanz, 2016; My Brother’s Keeper 2016 Progress Report, 2016; Ready, 2010).
Students cannot learn the intended curriculum if they are not in school. The impact of chronic absenteeism is devastating because it can lead to poor academic achievement, increased dropout rates, and the school-to-prison pipeline (Balfanz & Cornfeld, 2016; Smerillo, Reynolds, Tempe, & Ou, 2017). When individuals have multiple intersections of marginalization, their academic performance can suffer even more. Educators and policymakers cannot truly
understand achievement gaps or efforts to close them without considering chronic absenteeism (Balfanz & Byrnes, 2012). “The National High School Center indicates that attendance in the first 20 days of an academic period serves as high yield indicator for students who are likely to drop out [sic] or fail to graduate; they further indicate that students who miss 10% of
instructional time in their first year of high school are more likely to drop out [sic]” (Indiana Department of Education, 2015, para. 3). This highlights the need to detect excessive absences as quickly as possible and incorporate strategies to increase attendance.
The cohort-based dropout rate is the “percentage of students who drop out of school within four years of their first enrollment in ninth grade” (Florida Department of Education, 2020c). According to the Florida Department of Education, a dropout is defined as “a student who withdraws from school for any of several reasons without transferring to another school, home education program or adult education program” (2020c). In Florida, during the 2016-17 school year, the cohort-based dropout rate was 4.0% (Florida Department of Education, 2020c). There is a strong correlation between freshmen who have poor attendance and those who ultimately drop out (Allensworth, Easton, & Consortium on Chicago School Research, 2007;
Indiana Department of Education, 2015). It is therefore imperative that we identify attendance issues early in order to remedy the situation prior to irreparable damage.
Measurement of Absences in Florida Public Schools
Although Florida does not track or report the number of students who are chronically absent, districts monitor and report to the Florida Department of Education the number of students who have 21 or more absences. The Florida Department of Education reports this data as the percentage of students who have 21 or more absences. This indicates the percentage of students who were absent 21 or more total days for the school year (Florida Department of Education, 2020b). The Florida Department of Education then posts those numbers for both the district and schools. During the 2017-2018 school year, 11.3% of Florida’s students were absent 21 or more total days, according to the Florida Department of Education (2020b). That same year the graduation rate was 86.1% (Florida Department of Education, 2020b). Additionally, the cohort-based dropout rate for the 2017-2018 school year was 3.5%, which is the “percentage of students who drop out of school within four years of their first enrollment in ninth grade”
(Florida Department of Education, 2020c). The cohort-based dropout rate takes in consideration students who transfer in or out of the school. Deceased students are not counted in the cohort-based dropout rate.
Compulsory Education Laws
Compulsory education laws have a long history in the United States. The first were passed in Massachusetts in 1852 (Bandiera, Mohnen, Rasul & Viarengo, 2019). Florida
implemented compulsory education laws which required school attendance in 1915 (Rauscher, 2016). The last state to adopt compulsory education laws was Mississippi in 1918 (Bandiera, Mohnen, Rasul & Viarengo, 2019).
Strategies to Reduce Student Absenteeism
The research identifies multiple strategies to reduce student absenteeism. The following is a list of several key strategies highlighted in literature to decrease the number of students’ absences.
• Identify contributors to an individual student’s poor attendance.
• Develop a strong student teacher rapport
• Develop a caring presence
• Monitor attendance on a regular basis
• Develop accountability systems for student
• Educate students and parents about the benefits of regular attendance
• Enlist the support of mentors in the larger community
• Evaluate school policy and practices
Each of the above is discussed in greater detail in the pages that follow.
The ultimate goal in monitoring absences is to intervene and reduce the number of student absences. Some strategies explored in this program evaluation are building rapport, talking to students to understand underlying issues, offer support, and issue any consequences needed to reduce absences. “Strategies to reduce student absenteeism generally involve some form of monitoring, prevention, and intervention; it is likely that a combination of strategies must be leveraged to fully address student attendance issues” (Indiana Department of Education, 2015). If there is an issue that the school needs to be aware of, the process of monitoring helps to illuminate it.
This literature review reveals some common reasons for poor attendance, the problems associated with poor attendance, multiple strategies to combat excessive absences, and an
attempt to determine factors of absences. Furthermore, the relationship between absences, discipline, dropout rates, and graduation rates will be explored. Ideally, research will lead to enforcing best practices in identifying attendance issues early and then strategically intervening before students fall too far behind.
Identification of Contributors to Poor Attendance
There are many reasons for poor attendance or chronic absenteeism (Balfanz, 2016; Balfanz & Byrnes, 2012). Some students have physical health issues such as asthma, migraines or issues that are more serious. Recently, there has been an increase in depression or anxiety related absences (Balfanz, 2016). Some parents keep their older children home to watch younger sick children, because the parent/s must work to support the family (Balfanz, 2016; Balfanz & Byrnes, 2012). Additionally, there are students who just do not like school and either the parent/s do not force the child to go or the child pretends to go to school but never gets there (Balfanz, 2016; Duckworth, deJung, & Oregon University, 1986). United States Department of Education (2016) states that:
chronic absenteeism is an equity issue, and it is particularly prevalent among students who are low-income, students of color, students with disabilities, students who are highly mobile, and/or juvenile justice-involved youth—in other words, those who already tend to face significant challenges and for whom school is particularly beneficial (para. 5).
Furthermore, poor attendance can be confounded when race and socioeconomic status are considered (Balfanz, 2016; My Brother’s Keeper 2016 Progress Report, 2016; Ready, 2010).
Strategies to increase attendance. There is an obvious attendance issue in this country and there are several remedies that organizations and individuals have found that combat the
problem. In Florida, according to the Florida Department of Education (2020b) there was 11.3 percent of the student population absent 21 or more days during the 2017-2018 school year. Some of the solutions discussed here are relationships with school staff, weekly reports (monitoring), timely interventions, mentoring and holding students accountable.
Teacher/ student rapport. Mentoring is another strategy that helps combat chronic absenteeism. The National Mentoring Partnership has partnered with the U.S. Department of Education and Everyone Graduates Center to support My Brother’s Keeper (MBK), according to the U.S. Department of Education Office for Civil Rights (2016). MBK is a mentoring initiative to help some students have someone that cares about them. “A core component of the effort is the MBK Success Mentor Initiative — a partnership between the Department and key
institutions to match chronically absent students with school-linked mentors in 30 communities to improve their school attendance and achievement” (U.S. Department of Education Office for Civil Rights, 2019). One of the biggest catalysts to increasing attendance is creating a positive school climate and building rapport with the students. It is incredible advantageous for I to be highly visible on school campus. When possible, it is best to be out around the school while talking to students in the hallways and at lunch. The more ‘face time’ a teacher or administrator gets with the students the more they get to know one another, which strongly aides in keeping students accountable. Additionally, it helps to attend many of the after-school events. There should be an administrator present anyways, so if I can make a concerted effort to attend the events and talk to students about their extra-curricular endeavors, they come to know that I really does care about what they do and how they are doing.
A caring presence.Another strategy to increase attendance is for practitioners to visit as many classrooms throughout the day as possible. It is beneficial to know what is going on, it
helps students know I can show up at any time, and it increases visibility. Students with good relationships with caring adults have fewer absences and better academic achievement
(Allensworth, Easton, & Consortium on Chicago School Research (2007). It is also a good idea for practitioners to know about what specific students are learning in class. It also helps to know what is due, if there is a project coming up, or if there is an upcoming quiz or test. This gives practitioners something to talk with the student about in the hallway or at lunch. It takes a lot of work and practitioners must be conscientious about how to strategize their time.
Monitoring/ Weekly reports. Faria, et al. found that monitoring attendance by running regular absence reports, followed up with discussions with both the student and a parent can dramatically reduce the number of students with absenteeism (2017). Additionally, Balfanz & Byrnes (2012) convey that both chronic absences and regular attendance needs to be tracked so that interventions may occur in a timely fashion. According to Sinclair, Christenson, & Thurlow (2005) described a weekly monitoring program to improve student engagement called ‘Check & Connect’. According to the authors, “high school students with emotional or behavioral
disabilities who participated in ‘Check & Connect’ where significantly less likely to drop out” and “attended school with greater consistency relative to their peers” (p.10).
Reports should be run weekly from the start of the school year. This allows excessive absences to be caught as quickly as possible. As the number of accumulated absences increases throughout the year, reports should be run even more frequently. “Monitoring activities should provide schools with accurate and timely information to effectively identify students who are most at-risk of becoming chronically absent” (Indiana Department of Education, 2015, para. 2). This may take a lot of work, but it will ultimately save time in the end. More importantly, by catching issues early, it allows time to help the student rectify the situation prior to irreparable
harm being done to the students’ academics and helps to prevent the student from becoming chronically absent.
Accountability. Freeman, et al. (2016) found that implementing intervention systems like multi-tiered systems of support (MTSS) could help improve student attendance and
discipline outcomes. MTSS is a three-tier system that offers increasing support to students based on individual student needs. Tier 1 is universally applied to all students. Tier 2 is applied to small groups of students who need greater support. Whereas tier 3 is offered to students needing the greatest and most intensive amount of targeted support (Freeman, et al., 2016). This system must be implemented with fidelity and schools should intend to see better student outcomes with time (two or more years) (Freeman, et al., 2016; Sugai, O'Keeffe, & Fallon, 2012). This is just one example and not the only program that can help minimize chronic absenteeism. Effective administrators might consider perusing new studies and find what works for their school and students.
Educating students and parents. Although there are many reasons for frequent absences, informing students and parents of school board and school policies can help reduce unexcused absences. By being diligent about running weekly attendance reports, this may be an effective mechanism to help identify students who have excessive absences. This allows for a timely discussion with any students who have excessive absences with the students and their families. By engaging parents, schools can form a positive relationship with the family to help combat poor attendance (Florida Department of Education, 2020b; Sheldon & Epstein, 2004). It is imperative to clearly communicate attendance policies to both students and their parents (Sheldon & Epstein, 2004; Skinner, 2014).
A discussion with the student can then occur to determine the issues that are causing the excessive absences and to determine the best course of action to rectify the situation if possible. The parent or guardian should also be called to first let them know that their student has
excessive absences and to convey the importance of their student being in school (McConnell & Kubina, 2014). “Prevention measures should include efforts to provide education and
information to students [and parents] so that they develop an understanding of the importance of regular school attendance” (Indiana Department of Education, 2015, para. 2). If there is a medical issue, resources can be fitted for the student or the student can be given an application for a medical waiver. The parent/s and district can decide the best course of action if it is an ongoing medical issue.
Most importantly, a systematic procedure opens dialogue with the student so that if there is a need or concern, they may find it easier to discuss it. The student and parent/ guardian should be reminded of the attendance policies and if warranted the student should be given a consequence. Otherwise, the issues or concerns may not have been addressed. An administrator or attendance dean should check up on the student. The student should know that someone would be checking up on them. It is equally important to encourage and praise for any progress made (Head & Jamieson, 2006). “Students who reported receiving greater encouragement and supportive feedback from their teachers were more likely to report stronger self-efficacy” according to Won, Lee and Bong (2017, p.12). It will take two to three years to get an effective system in place.
Mentors and other community involvement. Besides having increased rapport with teachers, it has been found that community mentors can also increase attendance and thus decrease dropouts (Cabus & Witte, 2015). Having a caring adult outside of the classroom that
spends time with a potentially truant student allows time to understand the student’s issue and may feel more genuine to the student (Zalaznick, 2015). A mentoring program can connect volunteers with students that have excessive absences to help determine the root of the students’ absenteeism and help students get the needed resources to stay in school (Skola & Williamson, 2012; Zalaznick, 2015).
Although there is a rise of chronic absences, schools can employ several strategies to combat the issue. Ultimately if schools want to truly make a difference in the number of students that have excessive absences, they should incorporate several strategies. Some of the common themes found in this review of literature are to monitor student absences regularly, build positive supportive relationships with both students and their parents, clearly communicate attendance policies, help families receive necessary resources, assign students mentors, and finally issue consequences when needed to students that do not comply with the attendance policies.
Changing school policy and practices. If state, district, and school administrators could impress on their teachers how important it is to address excessive absences or at least report them to the attendance dean so that students who are struggling could be helped even sooner.
Additionally, if all teachers, coaches, club sponsors would take the time to build rapport with students, the students may find that they are making a more concerted effort to attend school. It makes a difference when one person cares, but a much larger difference when several people care.
Additionally, administrators should be conscientious about creating a positive, warm and inviting school climate. This can be nourished by modeling the desired behavior with staff that the administrative team would want modeled with students. By establishing positive school climate as a high priority, administrators can create a school environment that students want to
be a part of, increase attendance, decrease discipline problems, and increase student
achievement. It is a win-win situation for everyone. Consequently, making positive progress motivates greater future efforts. The conceptual framework used for this program evaluation is of servant leadership.
In summary, the strategies explored above form the basis for the practices being evaluated at Creekside High School. Those strategies were:
• Identify contributors to an individual student’s poor attendance.
• Develop a strong student teacher rapport
• Develop a caring presence
• Monitor attendance on a regular basis
• Develop accountability systems for student
• Educate students and parents about the benefits of regular attendance
• Enlist the support of mentors in the larger community
• Evaluate school policy and practices A Theoretical Framework of Servant Leadership
The theoretical framework for this program evaluation is focused on servant leadership. Servant leadership is relevant when interacting with students who may be absent due to a wide range of issues from extenuating health problems to truancy issues. Servant leadership is appropriate because the primary responsibility of an educational leader is to help students succeed. Servant Leadership Theory focuses on integrity, follower needs, and empowering others (Washington, Sutton, & Sauser. 2014). Servant leadership focuses on helping others succeed by meeting their needs and helping them grow. Additionally, servant leadership supports individuals and their growth (Allen, Moore, Moser, Neill, Sambamoorthi, & Bell, 2016).
Servant leadership is “a philosophy and set of practices that enriches the lives of individuals, builds better organizations and ultimately creates a more just and caring world” (Greenleaf Center, Inc., n.d.). In a journey to empower others, I have endeavored to hone qualities of a servant leader, especially listening, empathy, the commitment to the growth of people, and building community. Robert K. Greenleaf describes his innovative theory about servant leadership in his original essay, The Servant as Leader (1970):
It begins with the natural feeling one wants to serve, to serve first. Then conscious choice brings one to aspire to lead. That person is sharply different from one who is leader first.
… The difference manifests itself in the care taken by the servant-first to make sure that other people’s highest priority needs are being served. The best test, and difficult to administer, is this: Do those served grow as persons? Do they, while being served, become healthier, wiser, freer, more autonomous, more likely themselves to become servants? And, what is the effect on the least privileged in society? Will they benefit or at least not be further deprived? (Greenleaf 1970 as cited in Greenleaf 1977, p. 27).
Ten characteristics of servant leadership (Northouse, 2013) are listening, empathy, healing, awareness, persuasion, conceptualization, foresight, stewardship, commitment to the growth of people, and building community. Four of these characteristics are especially relevant to discussions with students. Student discussion is needed to determine the reasons for absences and for building trust. In caring for others, a servant leader’s commitment to the growth of others is characterized through building empathy by listening to their stories. As individuals
build trust between one another, they are more open to sharing, which helps to develop deeper understandings of each other. Guajardo and Guajardo (2013), show how plática,
multi-dimensional conversation, incorporates most, if not all, servant leadership qualities. Listening is a characteristic that is especially applicable to the use of plática, a form of interactive dialogue that can effectively be used as pedagogy that includes authentic cultural and historical inclusion of frequently marginalized groups (Guajardo & Guajardo, 2013). This can help determine the cause of excessive unexcused absences and can effectively be used to obtain other pertinent information from students.
As a servant leader, one needs to learn to listen to know others’ background to empathize better with them. Servant leadership places the good of the students above the leader’s own self-interest and emphasizes student development to decrease inequality (Northouse, 2013). It offers some control to the student by using listening and empathy skills.
Summary
The review of literature included information on compulsory education law, why attendance is important, strategies to reduce absenteeism, and servant leadership.
This program evaluation was based upon servant leadership and explored the following program evaluation questions:
PEQ1: What was the change over time from 2013-2019 of the percentage of students with 21 or more absences at Creekside High School?
PEQ2: How did the change over time at Creekside High School compare to other high schools in the district in the percentage of students with 21 or more absences?
PEQ3: What was the effect of changes to Creekside High School’s attendance processes on the percentage of Creekside High Schools’ students with 21 or more absences?
Chapter 3: Methodology Chapter Overview
This program evaluation assessed the effectiveness of an attendance program at
Creekside High School, a large suburban high school in Northeast Florida in St. Johns County School District. The chapter begins with a brief restating of the program evaluation problem, purpose, and the program evaluation questions. It also provides a description of St. Johns School District including schools’ demographics information and state, district and school level policy comparison. Finally, St. Johns County School District’s attendance policy along with Creekside High School’s attendance procedures is discussed.
Rationale for the Program Evaluation
Problem statement. Chronic absenteeism leads to poor academic achievement, increased dropout rates, and the school-to-prison pipeline (Balfanz & Cornfeld, 2016). Educators and policymakers cannot effectively address achievement gaps or efforts to close those gaps without considering consequences of chronic absenteeism (Balfanz & Byrnes, 2012).
Purpose statement. The purpose of this program evaluation was to assess the
effectiveness of an attendance program at Creekside High School, a large suburban high school in Northeast Florida in St. Johns County School District.
The evaluation included three steps. The first was to identify the attendance trends at Creekside High School. The second step was to identify the trends of the other high schools in the district and compare them to Creekside High School. The third step was to identify the attendance processes required by the state of Florida’s Department of Education, by St. Johns County School District’s public schools and to identify those additional processes in place at Creekside High School.
Program Evaluation Questions. The following three questions guided this program evaluation.
PEQ1: What was the change over time from 2013-2019 of the percentage of students with 21 or more absences at Creekside High School?
PEQ2: How did the change over time at Creekside High School compare to other high schools in the district in the percentage of students with 21 or more absences?
PEQ3: What was the effect of changes to Creekside High School’s attendance processes on the percentage of Creekside high Schools’ students with 21 or more absences?
Context of the Program Evaluation
Program evaluation. The purpose of this program evaluation was to evaluate the attendance program at Creekside High School. Creekside High School is a large high school in St. Johns County School District in Northeastern Florida. This program evaluation used publicly available longitudinal data over six years, retrieved from the Florida Department of Education’s website, to show the impact of Creekside High School’s attendance program on rates of
absenteeism, specifically the percentage of students that were absent 21 or more days. This program evaluation is not generalizable.
Steps taken for the program evaluation. Data were collected from the Florida
Department of Education’s database and included students’ grade levels, percentage of students that were absent 21 or more days by district, gender, race, number of discipline referrals, and eligibility for free or reduced lunch status as well as many other data.
Participant selection. The participants of this program evaluation were the students of St. Johns County School District high schools. Creekside High School’s attendance data is compared to other public high schools in the district from 2013-2014 school year through the
2018-2019 school year. The proposed number of participants is appropriate for this program evaluation because all the data is available, therefore there is no need for a sample.
Program Evaluation Population. This program evaluation’s population was drawn from the population of all 67 Florida school districts’ publicly accessible data from 2013-2019 school years. For 2018-2019 school year, there were 3,187,437 total students in Florida schools. In St. Johns County School District there were 44,866 total students and 13,289 high school students (Florida Department of Education, 2020b).
Description of St. Johns County School District. St. Johns County School District is in Northeast Florida just south of Jacksonville Florida. It has been rated the “first in the state out of 67 districts in total school accountability points for the past nine years and is one of only two districts in Florida with a grade of A each year since 2010” (St. Johns County School District, n. d., District Facts, Awards, para 1). The graduation rate in 2018 was 93.3 percent “based on the federal graduation rate compared to the state average of 86.1 percent” and “the dropout rate was 2.9 percent, less than the state average of 4.0 percent” (St. Johns County School District, n. d., District Facts, Test Scores, para 6 and 7).
In the following paragraphs is the St. Johns County School District mission, vision, and demographics. Additionally, the growth of the district is shown in Table 3.1 and then the demographics of each of the seven high schools compared in this program evaluation are discussed.
St. Johns County School District mission. “St. Johns County School District will inspire good character and a passion for lifelong learning in all students, creating educated and caring contributors to the world” (St. Johns County School District, n. d., 2016-2020 Strategic Plan, para 8).
St. Johns County School District vision. “All students will choose a learning path that leads to a well-rounded graduate who demonstrates good character and leadership” (St. Johns County School District, n. d., 2016-2020 Strategic Plan, para. 9).
St. Johns County School District demographics. In St. Johns County School District (SJCSD) there are 42,222 total students including 12,320 high school students in the 2019-2020 school year. SJCSD was reported as the student population being 23.87% minority students with 76.13% White, 6.92% Black or African American, 8.97% Hispanic or Latino, 4.95% Asian, and 3.03% two or more races. There were 15.44% students with disabilities. There were 20.53% that are Exceptional Student Education. In SJCSD 51% of the students were male and 49% were female. There were 25% of the students on free/ reduced lunch. The graduation rate was 93.3% in the 2019-2020 school year. The number of students that were suspended one or more times is 5.91% and the number of students that were below 90% attendance was 10.03% that school year.
St. Johns County School District growth over time. St. Johns County School District grew over the five-year period from 2014 to 2019. Table 3.1 shows the number of students enrolled and the percent increase over time from 2014 to 2019.
Table 0.1.
St. John’s County School District Growth Over Time from 2014 to 2019
Year Enrollment Percent Increase
2014 31,671 --- 2015 33,056 4.37% 2016 34,906 5.60% 2017 36,253 3.86% 2018 36,919 1.84% 2019 39,159 6.07%
St. Johns County School District high schools’ demographics
This program evaluation focused on the following seven St. Johns School District high schools:
1. Allen D. Nease High School (NHS) 2. Bartram Trail High School (BTHS) 3. Creekside High School (CHS)
4. Pedro Menendez High School (PMHS) 5. Ponte Vedra High School (PVHS) 6. St. Augustine High School (SAHS) 7. St. Johns Technical High School (SJTHS)
Tables 3.2-3.7 detail demographic data for each of the high schools. Tables 3.2 and 3.3 includes gender percentages, the percentage of students with disabilities, the percentage of
English Language Learners, the percentage of economically disadvantaged students, the
percentage of students on free/ reduced lunch, the graduation rate, and ethnicity data. Tables 3.4-3.7 details the percentage of students that were suspended one or more times and the percentage of students that were below 90% attendance for the district and for each of the seven high schools in St. Johns County School District.
Table 0.2.
St. Johns School District Demographics Percentage by High School High School Male: Female Economically Disadvantage Free/ Reduced Lunch Graduation Rate Students with Disabilities English Language Learners NHS 52:48 8% 13% 93% 2% 2% BTHS 50:50 6% 7% 96% 2% - CHS 52:48 7% 8% 98% 3% 3% PMHS 50:50 40% 38% 84% 3% - PVHS 49:51 3% 6% 96% 3% - SAHS 51:49 40% 41% 80% 2% - SJTHS 63:37 71% 71% 80-89% 24% -
Note. Allen D. Nease (NHS), Bartram Trail (BTHS), Creekside High School (CHS), Pedro Menendez High School (PMHS), Ponte Vedra High School (PVHS), St. Augustine High School (SAHS), St. Johns Technical (SJTHS). The percent English Language learners was too low and therefore not reported for several of the high schools.
Allen D. Nease High School population. At Allen D. Nease High School (NHS) there were 2,586 students according to Allen D. Nease High School’s 2019-2020 School Improvement Plan (Florida Department of Education, 2020a). NHS was reported as the student population
being 25% minority students with 75% White, 4% Black or African American, 12% Hispanic or Latino, 7% Asian, and 2% two or more races. There were 2% students with disabilities and 2% that were English Language Learners. At NHS 52% of the students were male and 48% were female. There were 8% economically disadvantaged students and 13% of the students were on free/ reduced lunch. The graduation rate was 93%. The number of students that were suspended one or more times is 13% and the number of students that were below 90% attendance was 19%.
Bartram Trail High School population. At Bartram Trail High School (BTHS) there were 2,651 students according to Bartram Trail High School’s 2019-2020 School Improvement Plan (Florida Department of Education, 2020a). BTHS was reported as the student population being 18% minority students with 82% White, 6% Black or African American, 8% Hispanic or Latino, 3% Asian, and 1% two or more races. There were 2% students with disabilities and the number of English Language Learners was not reported. At BTHS 50% of the students were male and 50% were female. There were 6% economically disadvantaged students and 7% of the students were on free/ reduced lunch. The graduation rate was 96%. The number of students that were suspended one or more times was 6% and the number of students that were below 90% attendance was 12%.
Pedro Menendez High School population. At Pedro Menendez High School (PMHS) there were 1299 students according to Pedro Menendez High School’s 2019-2020 School
Improvement Plan (Florida Department of Education, 2020a). PMHS was reported as the student population being 21% minority students with 79% White, 10% Black or African American, 7% Hispanic or Latino, 1% Asian, and 3% two or more races. There were 3% students with
disabilities and the number of English Language Learners was not reported. At PMHS 50% of the students were male and 50% were female. There were 40% economically disadvantaged
students and 38% of the students were on free/ reduced lunch. The graduation rate was 84%. The number of students that were suspended one or more times is 18% and the number of students that were below 90% attendance were 28%.
Ponte Vedra High School population. At Ponte Vedra High School (PVHS) there were 1819 students according to Ponte Vedra High School’s 2019-2020 School Improvement Plan (Florida Department of Education, 2020a). PVHS was reported as the student population being 11% minority students with 89% White, 1% Black or African American, 6% Hispanic or Latino, 4% Asian, and 0% two or more races. There were 3% students with disabilities and the number of English Language Learners was not reported. At PVHS 49% of the students were male and 51% were female. There were 3% economically disadvantaged students and 6% of the students were on free/ reduced lunch. The graduation rate was 96%. The number of students that were suspended one or more times is 3% and the number of students that were below 90% attendance were 21%.
St. Augustine High School population. At St Augustine High School (SAHS) there were 1969 students according to St Augustine High School’s 2019-2020 School Improvement Plan (Florida Department of Education, 2020a). SAHS was reported as the student population being 27% minority students with 73% White, 15% Black or African American, 9% Hispanic or Latino, 1% Asian, and 2% two or more races. There were 2% students with disabilities and the number of English Language Learners was not reported. At SAHS 51% of the students were male and 49% were female. There were 40% economically disadvantaged students and 41% of the students were on free/ reduced lunch. The graduation rate was 80%. The number of students that were suspended one or more times is 17% and the number of students that were below 90% attendance were 26%.
St. Johns Technical High School Population. At St Johns Technical High School (SJTHS) there were 168 students according to St Johns Technical High School’s 2019-2020 School Improvement Plan (Florida Department of Education, 2020a). SJTHS was reported as the student population being 39% minority students with 61% White, 31% Black or African
American, 4% Hispanic or Latino, 0% Asian, and 2% two or more races. There were 24% students with disabilities and the number of English Language Learners was not reported. At SJTHS 63% of the students were male and 37% were female. There were 71% economically disadvantaged students and 71% of the students were on free/ reduced lunch. The graduation rate was 89%. The number of students that were suspended one or more times is 21% and the number of students that were below 90% attendance were 37%.
Creekside High School population.At Creekside High School (CHS) there were 2,291 students according to Creekside High School’s 2019-2020 School Improvement Plan (Florida Department of Education, 2020a). Creekside was reported as the student population being 21% minority students with 82% White, 9% Black or African American, 4% Hispanic or Latino, 4% Asian, and 1% two or more races. There were 3% students with disabilities and 3% that are English Language Learners. At CHS 52% of the students were male and 48% were female. There were 7% economically disadvantaged students and 8% of the students were on free/
reduced lunch. The graduation rate was 98%. The number of students that were suspended one or more times is 7% and the number of students that were below 90% attendance were 7%.
Creekside High School’s Vision Statement. “The vision of Creekside High School is to inspire good character and a passion for lifelong learning in all students, creating educated and caring contributors to the world” (Creekside High School, 2020, para. 2).
Creekside High School’s Mission Statement. “The mission of Creekside High School is to provide students with an opportunity to achieve academic, athletic, fine arts and
extra-curricular excellence, within a safe and secure learning environment. Creekside High School staff and students will strive to model and support the six pillars of character counts. The six pillars of character are Trustworthiness, Respect, Responsibility, Fairness, Caring and Citizenship” (Creekside High School, 2020, para. 3).
Summary of St. Johns County high schools’ demographic information. Table 3.3 summarizes St. Johns County School District’s ethnicity data for the district and by the seven high schools included in this program evaluation.
Table 0.3.
St. Johns School District Ethnicity Data by Percent Name Enrollment High
School Enrollment Minority Percent White Percent Black Percent Hispanic Percent Asian Percent Multi Percent District 42,222 12,320 23.87% 76.13% 6.92% 8.97% 4.95% 3.03% NHS 2,586 2,586 25% 75% 4% 12% 7% 2% BTHS 2,651 2,651 18% 82% 6% 8% 3% 1% CHS 2,291 2,291 18% 82% 9% 4% 4% 1% PMHS 1,299 1,299 21% 79% 10% 7% 1% 3% PVHS 1,819 1,819 11% 89% 1% 6% 4% 0% SAHS 1,696 1,696 27% 73% 15% 9% 1% 2% SJTHS 168 168 39% 61% 31% 4% 0% 2%
Note. Allen D. Nease (NHS), Bartram Trail (BTHS), Creekside High School (CHS), Pedro Menendez High School (PMHS), Ponte Vedra High School (PVHS), St. Augustine High School (SAHS), St. Johns Technical (SJTHS)
Table 3.3 summarizes the ethnicity data and enrollment of St. Johns County public high schools. As you can see Creekside High School was the third largest high school in the district. It was tied as the fourth largest high school by minority population.
In addition to providing descriptive data about the schools found in Table 3.3, Table 3.4 highlights attendance data for the district. Table 3.4 compares the percentage of students below 90% attendance by school level in St. Johns County School District during the 2018-2019 school year (Florida Department of Education, 2020a).
Table 0.4.
Percentage of Students Below 90% by School Level during the 2018-2019 School Year
Total Number of Students’
Enrolled
Percent of Students Below 90% attendance
District 39,724 10.03%
Elementary School 17,358 5.89%
Middle School 9,703 7.72%
High School 12,510 17.69%
Table 3.4 shows that 10.03% of students in St. Johns County School District were below 90% attendance during the 2019-2020 school year (Florida Department of Education, 2020a). Also, it shows that high schools have the highest rate of absenteeism as measured by the percent of students below 90% attendance. “Chronic absenteeism rates are highest in high school, according to data in the 2015-16 Civil Rights Data Collection” (U.S. Department of Education Office for Civil Rights, 2016).
Table 0.5.
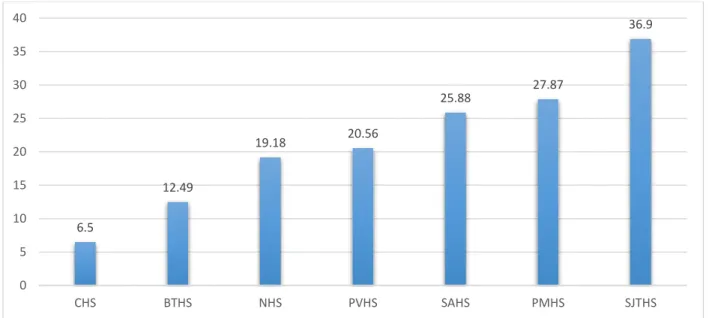
Percentage of Students Below 90% Attendance by High School during the 2018-2019 School Year
School Below 90%
Allen D. Nease High School 19.18%
Bartram Trail High School 12.49%
Creekside High School 6.50%
Pedro Menendez High School 27.87%
Ponte Vedra High School 20.56%
St. Augustine High School 25.88%
St. Johns Technical High School 36.90%
Table 3.5 identifies the percent of students that were below 90% attendance by high school in St. Johns County School District. It is evident that attendance rates vary widely by school from 6.50% to 36.90% with the median suspension rate 20.56%. Creekside had the lowest rate of absenteeism. Potential strategies that led to lower absenteeism at Creekside High School are highlighted in chapter five.
Table 3.6 compares the percentage of students suspended one or more times by school level in St. Johns County School District in the 2018-2019 school year.
Table 0.6.
Percentage of Students Suspended by School Level in St. Johns County School District during the 2018-2019 School Year
Total Number of Students
Enrolled
Percentage of Students Suspended one or more times
District 39,724 5.91%
Elementary School 17,358 1.73%
Middle School 9,703 8.41%
High School 12,510 9.85%
Table 3.6 shows that 5.91% of students in St. Johns County School District had been suspended one or more times during the 2018-2019 school year. Also, it shows that high schools had the highest percentage of students that had been suspended one or more times during the same year.
Table 0.7.
Percentage of Students Suspended by High School during the 2018-2019 School Year
High School Total Number of Students
Enrolled
Percentage of Students’ Suspended one or more times
Allen D. Nease High School 2586 12.53%
Bartram Trail High School 2651 6.15%
Creekside High School 2291 6.59%
Pedro Menendez High School 1299 17.55%
Ponte Vedra High School 1819 2.58%
St Augustine High School 1696 16.75%
St Johns Technical High School 168 20.83%
Table 3.7 identifies suspension rates in St. Johns County School District high schools during the 2018-2019 school year. It is evident that suspension rates varied widely by school from 2.58% to 20.83% with the median suspension rate 12.53%. Although Creekside has the lowest rate of absenteeism in St. Johns County School District, it only has the third lowest suspension rate. Hence, it is important to note that days students are suspended does not count as days absent for 5,10, and 15 unexcused absences reports. Nor does suspension days count
towards absence days on 15 total absences reports. In chapter five, implication for practices will address potential reasons for the lower absenteeism and relatively low suspension rates.
Program Evaluation Methodology
The following outlines the attendance policies for St. Johns County School District and for Florida Department of Education. It then shows the additional practices and policies that Creekside High School used to ensure that their students attend school.
St. Johns County School District attendance policy. St. Johns County School District attendance policy reflects the value of attendance to support student learning. The St. Johns County School District Attendance policy (n. d., para 2) states that “regular school attendance is a necessary part of a student’s education. Excessive absences impair a student’s educational progress, impacts whether the student passes or fails a grade, and may result in court proceedings and/or the loss of driving privileges.” St. Johns County School District outlines what constitutes excused and unexcused absences on the district website as well as in the student code of conduct.
Table 3.8 shows the state of Florida’s, St. Johns County School District’s and Creekside High School’s attendance policies and procedures.
Table 0.8.
State, District and School Level Policy Comparison Florida Department of
Education Requirements St. Johns County School District Creekside High School attendance requirements and practices
Track excused and unexcused absences (Florida Statute 1003.26).
Ibid. Ibid.
Parent must justify every
absence. Ibid. Ibid.
Schools must respond in a timely manner to include contacting the home for every unexcused absence and every absence for which the reasons are unknown.
Ibid. Ibid.
Identify potential patterns of non-attendance.
*Student has 5 unexcused absences or absences for which the reasons are unknown.
*Within a calendar month the student has 10 unexcused absences or absences for which the reasons are unknown.
Ibid. Ibid.
If there is a pattern of nonattendance the child is referred to a child study team and a parent meeting is scheduled. If the parent meeting is not successful, an attendance contract is made.
Ibid. Ibid.
Generate letters and send home after 7 days of the trigger dates.
Table 3.8 includes evidence that Creekside High School adhered to all state and district attendance policy and procedure practices.
Table 3.9 includes those attendance practices specific to Creekside High School. Creekside followed all the state and district attendance policies listed above as well as the following:
Table 0.9.
Attendance Practices Specific to Creekside High School
Steps Action Materials
Step 1 Generated attendance letters for 5, 10, and
15unexcused absences and 15 total absences daily Absence letters (appendix a-d) Step 2 Printed 15 total absences letters every day as soon as
the generate 15 total absences letter (appendix a)
Step 3 Mailed home the letters Step 3.1 Called or emailed home
Step 3.2 Called the student to my office to let them know that they are required to have doctor notes for all future absences.
Step 3.3 Used this face to face time to discern the reason or reasons for the excessive absences
Step 4 Identified if the student needs additional resources to help them be in attendance.
Step 5 For 5, 10, and 15 total absences printed letters after two days (in order to give students two days to turn in absence notes),
Unexcused absence letters (appendix b-d)
Step 5.1 Mailed the letters home
Step 5.2 Called the students down to see if they have the most recent absence letter
Step 5.3 Called or emailed home
Step 6 Offered assistance or resources if the student has a need that the school can help with.
Step 7 Issued consequences as needed for having unexcused absences