POLICY RESEARCH WORKING
PAPER
1720
The geographical distribution
The Distribution of Foreign
-
offoreigndirectinvestment
l l T * S 1 * - : f~~~~~~~~~~~~~FIDI) within China is
Direct Investment in China
FIwihnhnasdetermined mostly by GNP, infrastructure development. level of general education.
Harry C. Broadman and coastal location. In the
Ha?7y G. Broadman
Xi.o,un Sun past, FDI has been biased
Xiaolun
Sun---toward speculative
investment, especially the real estate sector: recenty this bias has become less pronounced.
The World Bank
China and Mongolia Department
Country Operations Division
Public Disclosure Authorized
Public Disclosure Authorized
Public Disclosure Authorized
POLICY RESEARCH WORKING PAPER 1720
Summary findings
Foreign direct investment (FDI) has played a major role For one thing, FDI in China is highly concentrated in China's push toward a market-oriented economy. geographical]y, and its sectoral distribution is highly
As part of the first phase of reforms that began in uneven. Broadman and Sun empirically analyze the 1978, the Chinese government experimented with geographic determinants of FDI in China.
preferential policies to attract foreign capital. Between They find that FDI's geographical distribution in 1978 and 1995, China received $128 billion in FDI. China is determined mostly by GNP, infrastructure Recent inflows account for 40 percent of combined flows development, level of general education, and coastal of FDI to all developing countries, making China the location.
biggest developing country FDI recipient. Although the sectoral distribution of FDI is coming This record is impressive, but certain problems must be into line with the rest of the world - indeed, moving overcome if FDI is to continue to help sustain the toward the pattern in more developed countries - in the country's record growth rate and further its economic past, FDI has been biased toward speculative types of
development. investment, especially the real estate sector.
This paper is a product of the Country Operations Division, China & Mongolia Department. Copies of this paper are available free from the World Bank, 1818 H Street NW, Washington DC 20433-0001. Please contact Ms. Joan Grigsby, room MC8-238, telephone 202-458-2423, fax 202-522-1556, internet address jgrigsby@worldbank.org. February 1997. (20 pages)
The Policy Research Working Paper Series disseminates the findings of work in progress to encourage the excange of ideas about
developmnent issues. An objective of the series is to get the findings out quickly, even if the presentations are less than fully polished. The
papers carry the names of the authors and should be cited accordingly. The findings, intetpretations, and conclusions expressed in this paper are entirely those of the authors. They do not necessarily represent the view of the World Bank, its Executive Directors, or the countries they represent.
Policy Research Working Paper
THE DISTRIBUTION OF FOREIGN DIRECT INVESTMENT IN CHNA
Harry G. Broadman
Xiaolun Sun
The World Bank
China & Mongolia Department
Country Operations Division
Harry G. Broadman is Senior Economist in the World Bank's China and Mongolia
Department, East Asia and Pacific Regional Office.
At the time this paper was written, Xiaolun Sun was an intern in the World Bank's China and
Mongolia Department, East Asia and Pacific Regional Office.
I. INTRODUCTION
Foreign direct investment (FDI) has played a major role in China's push towards a
market-oriented economy. From the advent of reform in 1978 to 1995 China has received $128.1 billion in FDI.
Recent FDI inflows to China account for 40 percent of such flows to all developing countries combined.
Indeed, today China is the largest developing country recipient of FDI. But while China's record in
attracting foreign capital in the past decade has been impressive, potential problems exist. These present
the Chinese authorities with challenges to overcome if FDI is to continue to help sustain the country's
record growth rate and further its economic development.
First, the pattern of FDI in China is highly geographically
concentrated. Of the total amount of
FDI that China has received since 1989, the coastal areas' share has been over 90 percent. In contrast,
the inland provinces, which are considerably less developed and poorer, and in greater need of capital
investment, have not played host to FDI to any significant degree. In part, this outcome is probably the
result of an absence of incentives offered by the government to foreign investors outside certain areas.
Within the context of opening the economy, the earliest reform experiments focused on developing four
initial Special Economic Zones (SEZs)', which have embodied preferential tax policies to attract foreign
capital and technology and promote exports. Subsequently, the government designated fourteen open
coastal cities
2and development zones.' But as international experience shows, such incentives only
marginally affect FDI decisions.
4More important, the geographic concentration of FDI is likely due to
the fact that the inland regions have inadequate or undeveloped infrastructure networks and facilities,
which, among other factors, tend to play an important role in foreign investors' location decisions
worldwide. It is apparent that the unevenness in the geographical distribution of FDI is contributing to
the skewed pattern of the country's regional growth as well as other discrepancies between regions.
Equally important is that the sectoral composition of FDI within China is uneven. The lion's
share of FDI has been concentrated in the real estate sector, especially hotels and other tourism-related
projects. The accumulation of FDI has been smaller in manufacturing. There has also been a relatively
low level of FDI in the high value-added services sectors, many of which, such as telecommunications
and informatics, banking and insurance, accounting
and auditing, legal services, and computer processing
and software design, are critical building blocks for the development of a modem industrial Chinese
economy. These services sectors are also increasingly
important in their own right for China's continued
economic development, particularly as international trade in services flourishes under the WTO.
5Like
many countries, China has sectoral limitations regarding FDI, with some sectors being wholly "negatively
listed"; in other cases where FDI is allowed, there are restrictions as to the level or nature of FDI. Such
limitations and restrictions play a role in explaining the uneven sectoral pattern of Chinese FDI, and the
government recognizes that they contribute to the country's already severe interior bottleneck problems.
I
Shenzhen, Zhuhai, Shantou, and Xiamen.2 From north to south: Dalian, Qinhuangdao, Tianjin, Yantai, Qingdao, Lianyungang, Nantong, Shanghai, Ningbo, Wenzhou, Fuzhou, Guangzhou, Zhanjiang, and Beihai.
3 Hainan Special Economic Zone and the Pudong New Area in Shanghai.
4 See, for example, Caves (1982); Wells (1986); Mintz (1990)
Although much has been written describing China's overall achievement in attracting foreign investment and the general pattern of Chinese FDI, little work has been done analyzing quantitatively the geographical and sectoral attributes of such investment. This paper thus attempts to assess empirically the locational and sectoral determinants of FDI within China. Shedding light on these determinants is an important policy issue for the Chinese authorities. Within the past year they have begun to rationalize the regime governing FDI flows, with an eye towards reducing various distortions, especially the system of FDI tax preferences.6
In Section II, we present an overview of the recent trend in the flow and stock of Chinese FDI, placing it in the worldwide and regional contexts. Section III focuses on the geographical distribution
of FDI within China and develops a simple econometric model of its locational determinants. In Section
IV the sectoral pattern of Chinese FDI is analyzed and compared with that of other countries. Conclusions and policy observations are contained in the last section.
II. CURRENT TRENDS IN FDI World and Regional Trends
Following rapid increases since the early 1980s, global FDI flows have increased more moderately in recent years. As shown in Tables I and 2, average annual total world inflows and outflows of FDI rose about 3.5 % and 0.4%, respectively, between 1989-94. This general increase has not been shared by all countries. Flows into and out of industrial economies have either declined or increased slightly, primarily due to recession. But both inflows and outflows of FDI in developing economies rose steadily. These countries now command an increasing portion of world FDI flows.
Table 1: Global FDI Inflows
$US
Millions1989 1990 1991 1992 1993 1994
Value (%) Value (So) Value (%) Value (%) Value (%) Value (%) World Total 192,361 (100.0) 203,969 (100.0) 158,350 (100.0) 170,398 (100.0) 208,388 (100.0) 225,692 (100.0) Industrial 166,557 (86.6) 172,524 (84.6) 118,726 (75.0) 111,223 (66.4) 129,073 (62.0) 134,984 (60.0) Economies Europe 87,985 109,348 81,345 81,655 76,387 73,660 United States 67,870 45,140 23,972 17,600 41,108 49,448 Japan 1,060 1,760 1,370 2,720 86 888 Developing 25,804 (13.4) 31,445 (15.4) 39,624 (25.0) 50,388 (33.6) 73,350 (35.2) 84,441 (37.4) Economies Africa 2,972 1,121 2,343 2,702 3,000 3,080 Latin America 6,191 6,937 11,508 13,973 14,980 15,930 Asia 13,702 18,299 20,373 27,637 49,984 60,664
East Asia (sum 7,461 (3.9) 11,662 (5.7) 12,508 (7.9) 13,871 (9.3) 16,517 (7.9) 19,600 (8.7)
of below) Indonesia 682 1,093 1,482 1,774 2,004 3,000 Malaysia 1,668 2,332 4,073 4,118 5,206 4,500 Philippines 563 530 544 228 763 1,500 Singapore 2,773 5,263 4,395 5,635 6,829 7,900 Thailand 1,775 2,444 2,014 2,116 1,715 2,700 China 3,393 (1.8) 3,487 (1.7) 4,366 (2.8) 11,156 (7.4) 27,515 (13.2) 33,800 (15.0)
Source: IMF BOP Yearbook and UN World Investment Report
Table 2: Global FDI Outflows
$US Millions
1989 1990 1991 1992 1993 1994
Value (%) Value (%) Value (%) Value (%) Value (%) Value (%)
World Total 217,584 (100.0) 238,448 (100.0) 189,175 (100.0) 180,949 (100.0) 222,171 (100.0) 222,254 (100.0) Industrial 207,164 (95.2) 228,685 (95.9) 181,896 (96.2) 161,130 (89.0) 192,959 (86.9) 189,280 (85.2) Economies Europe 123,717 141,700 113,112 103,009 103,693 113,921 United States 29,000 32,690 29,130 34,790 68,978 45,640 Japan 44,160 48,050 30,740 17,240 13,714 17,938 Developing 10,420 (4.8) 9,763 (4.1) 7,279 (3.8) 19,819 (11.0) 29,136 (13.1) 32,907 (14.8) Economies Africa 892 1412 897 319 843 686 Latin America 950 4,508 1,834 2,259 0 1,900 Asia 8,967 8,363 5,425 16,736 28,315 30,306
East Asia (sum of 932 (0.5) 1,492 (0.7) 611 (0.3) 884 (1.0) 988 (1.1) 831 (0.4)
below)
Singapore 882 1,352 444 748 767 653
Thailand 50 140 167 136 221 178
China 780 (0.4) 830 (0.3) 913 (0.5) 4,000 (2.3) 4,400 (2.0) 2,000 (0.9)
Source: IMF BOP Yearbook, UN World Investment Report
Asian developing countries have consistently received the largest percentage of FDI, and they are rapidly becoming a new source of FDI. More than 50 percent of developing country FDI inflows have been to Asia, and about 80 percent of the developing country FDI outflows originates in Asia, especially the newly industrialized economies in the region. Within Asia, some East Asian developing countries are attracting significant amounts of FDI. In particular, China and Vietnam are emerging as major FDI destinations. In recent years, most incremental increases in FDI in East Asia went to China.
The Trend of FDI in China
Foreign direct investment started modestly in China after the passage of the 1979 Law on Joint Ventures. The Law permitted foreign investment and defined equity joint ventures. Still, the legal environment for FDI was not well-defined, and little attention was directed to attracting foreign investors. In 1986 and 1987 more serious attention was given to providing investment incentives. The Provisions for the Encouragement of Foreign Investment were promulgated in October 1986 and their implementing regulations announced over the next year. Partly as a result, FDI flows into China have been growing continuously ever since (Table 3). By 1992 China was receiving almost a quarter of total FDI inflows to developing countries, and today the share is 40 percent. Foreign investment has expanded to become by far the single most important source of external capital for China, surpassing the combination of bilateral development assistance and borrowing commercially and from international organizations.
Table 3: FDI Inflows to China
$US Milios
,
Contracted Utilized -1982 6,010 1,166 1983 1,732 636 1984 2,651 1,258 1985 5,932 1,661 1986 2,834 1,874 1987 3,709 2,314 1988 5,297 3,194 1989 5,600 3,392 1990 6,596 3,487 1991 11,977 4,366 1992 58,124 11,007 1993 111,436 27,515 1994 82,680 33,767 1995 91,282 37,521Source: China Statistical Yearbook, 1996
Chinese statistical authorities categorize FDI projects into five different groups: (i) "equity joint
ventures"; (ii) "wholly foreign-owned enterprises"; (iii) "cooperative operations"; (iv) "joint
development"; and (v) "other foreign investment" (including imported inputs for processing and
assembly). Recent values of the first four categories are in Table 4. Although the equity joint venture
has been the most popular form since the mid-1980s, constituting
about half of the foreign capital directly
invested, growth of wholly foreign-owned
enterprises has been the most rapid form in recent years. Joint
development ventures pertain mainly to off-shore petroleum exploration. This form of FDI was
extremely popular in the early 1980s, but its use has been declining in recent years.
Table 4: Types of FDI in China
$US Millions
1989 1990 1991 1992 1993 1994 1995
Value' Value Value Value Value Value Value
Equity Joint Ventures 2.659 2,704 6,080 29,129 55,174 40,194 39,741
Cooperative Operations 1,083 1,254 2,138 13,256 25,500 20,300 17,825
Wholly Foreign-owned Enterprises 1,654 2,444 3,667 15,696 30.457 21,949 33,657
Joint Development 204 194 | 92 43 30 24 8
It is widely acknowledged that the actual magnitude of China's reported FDI flows is subject to uncertainty. Reported flows are thought to be dver-estimated due to over-valuation of capital equipment contributed to joint ventures by foreign investors (the value of which is translated into equity investment and recorded as FDI) and because of "roundtripping" through Hong Kong (and Taiwan, China, to a lesser extent) in part to benefit from preferential tax treatment accorded to foreigners. The World Bank has estimated such factors inflated China's 1994 FDI inflows by about 37 percent.' With recent
improvements in Chinese FDI statistical methodologies and reforms of FDI tax preferences (see below),
the magnitude of this problem should be reduced. Inasmuch as this study is concerned with the distribution of FDI within China, this problem should not materially affect our analysis.
m.
THE GEOGRAPHICAL DISTRIBUTION OF FDI IN CHINAVirtually no study on FDI in China has failed to point out the uneven geographical distribution of foreign capital within the country. The concentration of FDI flows in the east and southeast regions is seen clearly from Table 5. The twelve coastal provinces attracted between 87 and 93 percent of total FDI inflows to China during the 1985-92 period, and their share of FDI has remained above 90 percent since 1989. Among coastal regions, Fujian, Shanghai, Jiangsu and Guangdong have all been hosts to significant amounts of FDI. Guangdong has consistently been the leading coastal destination, and in recent years, the gap between FDI flows into Guangdong and all other provinces has been enlarging.
Table 5: Chinese FDI Inflows by Region
$US Millions 1985 1987 1989 1990 1991 1992 Coastal 1.181.42 1,578.44 3,107.03 3,201.33 4,092.21 10,046.50 Ouangdong 651.31 736.87 1,252.06 1,582.31 1,942.88 3,701.11 Fujian 118.60 55.35 348.03 348.89 471.16 1,423.64 Jiangsu 33.47 86.35 126.93 133.97 219.22 1,463.24 Beijing 88.82 105.79 320.16 278.95 244.95 349.85 Shanghai 107.54 214.01 422.12 174.01 145.19 493.61 Shandong 35.63 64.97 163.33 185.70 216.39 1,003.42 Liaoning 24.58 90.84 126.14 257.31 362.39 516.42 Hainan 94.97 103.02 176.72 452.55 Tianjin 55.87 133.13 31.42 36.93 132.61 107.78 Zhejiang 26.63 35.76 53.96 49.14 92.29 239.78 Guangxi 30.73 45.05 53.00 35.63 31.85 182.01 Hebei 8.24 10.32 43.73 44.47 56.56 113.09 Inland 136.09 203.75 330.30 234.82 333.71 957.52 Shaanxi 15.55 72.88 97.19 47.31 31.76 45.53 Hubei 8.00 25.99 28.61 31.76 46.64 203.13 Sichuan 28.72 24.27 13.11 24.37 80.91 112.14 Heilongjiang 3.95 14.04 57.36 28.36 20.85 72.17 Hunan 27.28 2.86 23.28 14.15 25.43 132.71 Henan 8.27 13.53 46.06 11.36 37.99 53.16 Jilin 4.87 7.37 9.93 17.60 31.64 75.34 Jiangxi 10.49 5.35 9.23 7.51 19.49 99.72 Anhui 3.03 3.23 8.75 13.54 10.67 54.66 Guizhou 9.87 12.76 10.58 14.09 19.79 Shanxi 0.52 4.90 9.81 3.40 3.80 53.84 Yunnan 1.63 6.33 7.87 7.38 3.51 28.75 Xinjiang 10.91 17.70 0.88 5.37 0.22 Inner Mongolia 2.00 5.06 4.35 10.64 1.66 5.20 Gansu 0.57 0.21 1.11 1.24 4.87 0.35 Qinghai 0.15 0.68 Ningxia 0.28 0.03 0.25 0.18 0.35 Tibet Total 1,317.51 1,782.19 3,437.33 3,436.15 4,425.92 11,004.02
Sourc: China Statistical Yearbook
Table 6 presents the provincial distribution of Chinese FDI on an accumulated, or stock, basis. The FDI gap between the coastal and inland regions becomes even more apparent when accumulated FDI is adjusted for population or geographical size. While the coastal regions attracted over 9 times as much FDI as the inland regions in aggregate terms, they attracted over 12 times as much FDI on a per capita basis, and over 70 times as much FDI per 1000 square meters of land area.
Table 6: Cumulative FDI in China by Region, Year-end 1992
$US Millions
Total Per Per 1000
l____________ Capita Sq Km Coastal 27,455.99 54.35 25.01 Guangdong 12,051.49 184.70 66.95 Fujian 2,944.64 75.25 24.54 Jiangsu 2,222.45 32.16 22.22 Beijing 2,041.41 185.25 121.51 Shanghai 1,938.55 144.13 323.09 Shandong 1,824.82 21.19 12.17 Liaoning 1,556.41 38.76 10.38 Hainan 944.70 137.71 27.79 Tianjin 610.24 66.33 55.48 Zhejiang 566.12 9.70 5.66 Guangxi 448.38 10.24 1.95 Hebei 306.78 4.89 1.61 Inland 2,838.51 4.30 0.35 Shaanxi 459.11 13.48 2.42 Hubei 378.85 6.79 2.10 Sichuan 355.60 3.23 0.64 Heilongjiang 290.57 8.05 0.63 Hunan 248.30 3.96 1.18 Henan 245.28 2.77 1.53 Jilin 180.66 7.14 1.00 Jiangxi 169.79 5.45 1.06 Anhui 156.94 3.70 1.21 Guizhou 89.08 2.65 0.52 Shanxi 82.94 2.78 0.55 Yunnan 67.53 1.76 0.18 Xinjiang 54.12 3.42 0.03 Inner Mongolia 42.75 1.94 0.04 Gansu 11.97 0.52 0.03 Qinghai 3.53 0.77 Ningxia 1.46 0.30 0.02 Tibet 0.03 0.01 Total 30,294.50 25.99 3.33
Source: Chzina Statistical Yearbook
Hypothesis Development
Observers have cited various factors to explain the skewed geographical pattern of FDI within China. Among them, the government's incrementalist approach in implementing the "open-door" policy is reflected in the impressive amount of FDI in the coastal areas as compared to other regions. The autonomy given to certain coastal areas with regard to investment, production and other economic policies is surely another reason why these regions have been particularly attractive to foreign investors. The close geographical proximity and tight cultural and linguistic links between southern China and the overseas Chinese communities in Taiwan, China, Hong Kong and Macao have also directly contributed
to the observed geographical pattern of China's FDI. Still, as abundant as the literature on the geographical distribution of FDI in China is, there lacks a robust empirical analysis of the local determinants of such investment. In short, the relative importance of the various factors that influence the level of FDI in each province has yet to be established.
Our approach to shed light on this issue derives from estimation of an internal norm to assess the determinants of the provincial distribution of FDI in China using a standard location choice model. Against this norm, provincial FDI stocks are compared to determine the past performance and future potential of the provinces.
The Dependent Variable
The dependent variable employed in our model is the accumulated stock of FDI in each province
at year-end 1992.8
The Explanatory Variables
A large volume of theoretical and empirical literature is devoted to the determinants of the spatial distribution of FDI, usually in the inter-country context. This includes, among other approaches, the early Hechsher-Ohlin model, which emphasizes the endowments of capital and labor between countries; the product life cycle model, which regards FDI as a way to capture remaining profits by expanding overseas; and the industrial organization theory of FDI, which focuses on international oligopolistic competition. In the main, the empirical studies, using either cross-country regression analysis or interviews of foreign investors in host countries, generally show that various economic development characteristics (market size, labor costs, etc.) and FDI policy factors (tax incentives, free trade zones, etc.) directly influence the destination of flows of capital across national borders.9
In the simple locational decision model used here, we posit that five "locational advantage" factors are important determinants of the attractiveness of a Chinese province as a potential location for FDI. Taken together, these variables represent a province's level of economic development and its overall foreign investment policy environment.
Gross National Product. GNP generally reflects the economic development of a country
-- or in our case a province. It reflects a province's potential demand, and thus gives a good estimate of the province's market size. In this regard, GNP usually is an especially important factor for foreign investors seeking to sell as well as produce in a local market. The variable used here is provincial GNP for 1992. Our expectation is that it is positively related to a province's stock of FDI.
Labor costs. Foreign investors generally aim to take advantage of host countries' cheaper factor
inputs (relative to their home countries), and the cost of labor is often considered important in this regard. In other words, foreign investors' display sensitivity to inter-country variations in labor costs in making their location decisions. However, the sensitivity of FDI location decisions to intra-country labor cost differentials is unlikely to be as pronounced. Indeed, even though the decision to invest in China is no doubt heavily influenced by the country's prevailing low wage rate, once the choice is made to locate an investment in China, finding the cheapest possible labor within China may not be an important consideration as wage differentials may not be significant. In fact, it is likely to be the case that observed wage rates (including bonuses and in-kind benefits) do not vary as much between regions within China as within other countries because of China's legacy of central planning, which has tended to homogenize
8 Although data on cumulative stocks of FDI are available for more recent years, data constraints on the other
variables force us to focus on end-year 1992.
wage rates.'" Thus, while the provinces with higher labor costs can be expected to compete less favorably in their efforts to attract foreign investment, our expectation is that this variable is not likely to yield a strong negative relationship with provincial FDI accumulation. The measure of labor cost we use is the average annual provincial wage of staff and workers in 1992.
Human capital. A host region's labor supply influences foreign investors' location decisions not
only in terms of input costs, but also through the quality of the skills of the laborforce--especially if the price mechanism is repressed, as is the case in China's labor markets. All other things equal, locales with highly skilled workers--most easily measured by education levels--would be expected to compete more favorably than others in their FDI attractiveness. In this study, adult illiteracy is taken to represent the extent of basic education of a province's workers. The data are taken from China's Fourth National Population Census in 1990, where the population is classified as illiterate and semi-illiterate. These two classifications are divided by provincial population "up to age 6" and "over age 6" to obtain an illiteracy ratio.
Infrastructure. There is no dispute that the extent of an area's infrastructure development is
important in an investor's location choice. Infrastructure of course covers many dimensions, ranging
from highways to railroads to telecommunication systems to even institutional development (e.g.,
extensiveness of business-related services, such as accounting, legal services, etc.). Owing to the difficulty of capturing all these various dimensions in an easily calculable variable, for this study we settled on using as a measure of a province's infrastructure development the total length of transportation routes within the province, calculated as the sum of the length of the (i) railways in operation, (ii) the navigable inland waterways and (iii) the constructed highways in 1992, normalized by provincial geographical size. In effect this variable measures provincial transportation route density. It is expected to be positively related to the level of FDI stock.
Geographical location. As in other countries, another factor that is likely to be an important
determinant of the geographical distribution of FDI in China is whether a province has a coastal location and thus in close proximity to major shipping ports. In China, coastal location may also be important because of the government's FDI policy regime--namely that fiscal incentives for foreign investors, such as lower income tax rates and reduced tariffs for imports used in the production of exports, have been heavily slanted in favor of cities along the coast. Although as the empirical literature shows (as noted above) such incentives only marginally affect FDI decisions in other countries, it would be helpful to assess their effects in the Chinese context. But this is impossible in our case given the unavailability of data on the other explanatory variables: SEZs (or other similar tax preference units) are not jurisdictions on which GNP, illiteracy, labor costs and infrastructure development are measured; hence our unit of analysis is the province. We thus use a dummy variable to reflect coastal location; for this variable the twelve coastal provinces take on the value 1, while others 0. This variable is expected to be positively
related to a province's FDI accumulation.
The above discussion regarding the determinants of FDI within China on a provincial basis can be summarized by the following equation, with the expected signs under each explanatory variable:
FDI = f ( GNP, Wage, Infrastructure, Illiteracy, Coastal Location)
+ -+ -+
10 To be sure, regional wage differentials within China have become somewhat pronounced with reform,
which began in 1978 and has intensified in recent years. Indeed, the "iron rice bowl" or "small society" regimes embodied in Chinese state owned enterprises, which provide cradle-to-grave jobs and a complete package of social benefits for workers, their spouses and other family members, have acted as barriers to labor migration among provinces and allowed the modest (but growing) provincial wage differences to persist. See Hu in Broadman (1996).
tmpirical Results
About the Explanatory Variables
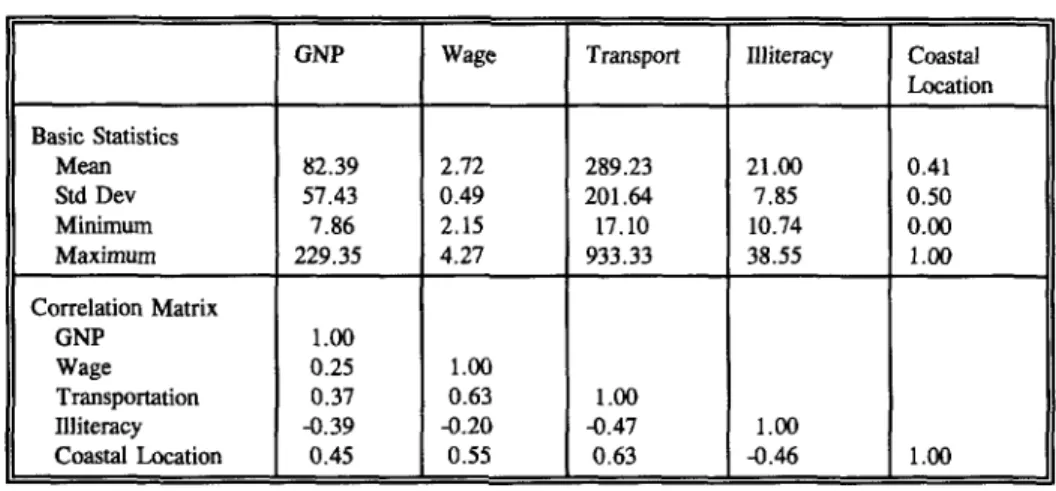
Table 7 summarizes the basic statistics of all the explanatory variables, and the correlation between them. Comparing the mean and the standard deviations of these variables, we see that total GNP and transportation route density fluctuate greatly from province to province. Such variation suggests that these factors may be the deciding elements to foreign investors when choosing a destination for projects in China. On the other hand, wage rates and illiteracy ratios are relatively uniform among the various regions. Thus, they are expected to exert less influence in foreign
investors' internal location choice.
Table 7: The Explanatory Variables
GNP Wage Transport Illiteracy Coastal Location Basic Statistics Mean 82.39 2.72 289.23 21.00 0.41 Std Dev 57.43 0.49 201.64 7.85 0.50 Minimum 7.86 2.15 17.10 10.74 0.00 Maximum 229.35 4.27 933.33 38.55 1.00 Correlation Matrix GNP 1.00 Wage 0.25 1.00 Transportation 0.37 0.63 1.00 Illiteracy -0.39 -0.20 -0.47 1.00 Coastal Location 0.45 0.55 0.63 -0.46 1.00
Results from the Regression Model
Table 8 reports the basic OLS estimation results. A log-linear relationship is assumed between total FDI stock and its determinants; therefore, the coefficient estimates reported here are
elasticity measurements. Two sets of regression results are reported. The first model--Model I--includes labor cost as an explanatory variable. The coefficient estimate for this variable shows that it is both of the wrong sign and statistically insignificant. The exclusion of this variable--in Model II--lowers the standard error of regression and brings more explanatory power.
Table 8: Estimation Results
Coefficient t-statistics Coefficient t-statistics
Constant -1.335 -0.131 -0.432 -0.273 GNP 0.987 3.942 0.984 4.060 Wage 0.114 0.090 Transportation 0.457 1.831 0.456 1.870 Illiteracy -0.051 -1.944 -0.051 -1.984 Coastal Dummy 1.315 2.647 1.339 3.258 Standard Error 0.867 0.849 Adiusted R2 0.808 0.816
All the reported coefficient estimates in Model II bear the expected sign and are statistically significant at the 10 percent or above confidence level (except the intercept). More than 80 percent of the variation in provincial FDI stocks in China can be explained linearly by the variations in the four independent variables. For a cross-section analysis such as this one, an adjusted R-square of 82 percent is considered high.
The total GNP level is one of the most important factors in foreign investors' location choice in China. The coefficient estimate for this variable results in the highest statistical significance among our explanatory variables. A one percent increase in the market size of a host province brings about nearly one percentage point more FDI into the region. This outcome is consistent with previous cross-country studies on FDI destination.
The results also confirm our expectation that FDI in China goes to where there is greater development of basic infrastructure; the extensiveness of transportation facilities is shown to have a significantly positive effect on the location of FDI. A one percent increase in transportation route density is associated with a 0.46 percent increase in provincial FDI accumulation.
Adult literacy has a small, nonetheless significant, positive effect on the destination of FDI in China. As we noted above, when the cost of labor is relatively insignificant (as is the case in China, where wage rates vary little from region to region), the quality of the labor force is expected to have an impact on foreign investor's FDI location decision. A one percent decrease in the adult illiteracy ratio is shown to be associated with a 0.05 percentage point increase in FDI.
As expected, a province's geographical location makes a significant difference in its FDI
accumulation potential. The coastal regions have shown a clear advantage over inland provinces in
their ability to attract FDI. The dummy variable that puts the twenty-nine provinces and autonomous regions into two broad categories is shown to be highly sensitive to the pattern of Chinese FDI distribution. Our results imply that coastal provinces have a 1.3 percentage point edge over their inland counterparts. It is the combined effects of being close to major shipping ports and being granted special investment incentives that set the coastal regions apart from others.
We thus conclude that to a large extent the destination of FDI within China is determined by market size, the extent of infrastructure development, the basic education level among adults, vicinity to import and export markets as well as capital sources and special investment policies.
The Relative Performances of the Provinces
On the basis of the statistical relationships established above, the predicted values for the dependent variable can be computed and compared with the actual FDI levels for each province. An examination of the difference between each pair of actual versus predicted FDI values--"the residual" --permits evaluation of the relative performances of the various provinces in China. Table 9
summarizes the findings of this analysis (using Model II). The results are reported in terms of the (i) ratio of the residual to the actual value and (ii) the absolute value of the residual itself. The provinces marked with a star (*) are those located along the coast.
The results show that just under half of the provinces attract more FDI than their potential (i.e., have ratios greater than 1.0), as captured by our explanatory variables. In relative terms, the 29 provinces can be categorized into three groups: the two extreme groups consist of those whose FDI accumulation at year-end 1992 either exceeded their potentials by more than 50 percent--the "Over-Investors"--(5 provinces), or fell below their potentials by more than 50 percent--the "Under-Investors"--(6 provinces); and the group in between--"Middle-Investors"--(18 provinces).
For most provinces, the actual values of FDI are more or less consistent with their predicted values on the basis of our model determinants. The residuals for these provinces range from 39.7
percent higher to 44.3 percent lower than the real FDI stock. Especially in the cases of Qinghai, Sichuan and Inner Mongolia, the absolute values of residuals are less than 10 percent of total FDI stocks, or $10 million in real terms. Our analysis suggests that many of the coastal provinces, which have been important destinations for FDI," still have a long way to go before reaching the
saturation point.
Table 9: Comparing Actual and Predicted Values of FDI
-Over-Investors'" F| "Under-Investors" I
Ratio Value Ratio Value
Hainan * 80.83 763.63 Ningxia -547.53 -7.99 Shaanxi 76.05 349.13 Hebei * -311.65 -956.08 Fujian * 71.03 2,091.66 Zhejiang * -163.27 -924.29 Guangdong * 69.94 8,428.90 Shanxi -121.67 -100.91 Guizhou 55.02 49.01 Gansu -91.75 -10.98 l ___________________ __________ |_______ Shanghai * -51.14 -991.27 "Middle-Investors
Ratio Value Ratio Value
Xinjiang 39.65 21.46 Liaoning * -44.34 -690.11 Heilongjiang 25.99 75.53 Hunan -44.20 -109.74 Anhui 22.82 35.81 Henan -43.48 -106.64 Yunnan 20.31 13.71 Guangxi * -39.10 -175.30 Hubei 19.27 72.99 Tianjin * -36.48 -222.61 Jiangxi 18.86 32.02 Jiangsu * -22.75 -505.66 Jilin 9,88 17.85 Shandong * -17.23 -314.49
Qinghai 9.43 0.33 Inner Mongolia -8.87 -3.79
Beijing * 7.32 149.40 Sichuan -1.82 -6.46
The "Over-Investors". Among the five Over Investors, the three coastal provinces come as
little surprise. With an average annual FDI growth rate at 40 percent since 1988, Hainan's actual FDI accumulation is over 80 percent higher than its predicted level. The main reason for such an outcome lies more in the small predicted value of FDI for Hainan (the 11th smallest among all provinces) rather than its high actual FDI accumulation (the 8th highest). Despite a relatively
extensive transportation system (the 6th highest transportation route density in China), Hainan has a very small economy (the 4th lowest in total GNP) and is poor in the quality of its labor force (the
11th highest illiteracy ratio in the nation). Its ability to attract such a large amount of FDI is mostly attributed to its unique geographical location and the favorable investment policies implemented there: the island's initial transformation to an SEZ was especially responsible for an upsurge in interest from the international investment community.
Fujian and Guangdong were also locales for the initial four SEZs. As seen from Table 6,
these two provinces' FDI accumulations between 1985-92 were far ahead of all other provinces in
China. Especially in the case of Guangdong, the amount of "excess" FDI it attracted was more than three times the total amount of FDI any other province ever accumulated in these eight years.
11 Recently, investment has been flooding into Jiangsu and Shandong provinces, where there are many rural enterprises. This trend has been taken as an indication that rural enterprises may fast become partners for joint ventures and joint enterprises; see China Newsletter (1993)
Different as they are in terms of absolute economic size (Guangdong's GNP is more than three times that of Fujian) and the general quality of the labor force (Guangdong has the 8th lowest illiteracy ratio in China, while Fujian has the 8th highest), their relative performance in attracting FDI is similar (about 70 percent more than their respective potentials). Apart the government's free-handed approach toward these two provinces and the preferential policies implemented there since reform began, the special advantages of being geographically and/or culturally connected to the homes of China's two major foreign investors (Hong Kong and Taiwan) are among the major factors for their outstanding performance.
Shaanxi is the most important destination of FDI among China's inland provinces (see Table 6). It attracted over 75 percent more FDI in the eight years between 1985-92 than what our model predicts for the province. This amounts to $349 million of "excess" foreign capital in value. Shaanxi's achievement in absorbing FDI may find its explanation in the province's rich natural resources and cultural/tourist attractions. Despite the fact that the province has one of the smallest economies in the country and one of the country's most illiterate population, Shaanxi has the highest
average per-project FDI value among all provinces in China.12 The massive investment in the late
1980s in real estate in Xi'an no doubt also helps to explain Shaanxi's strong FDI performance. Inland Guizhou is among the most backward provinces in China. It has a very small
economy, the lowest per capita income level, and one of the least educated populations in the country. Yet Guizhou was able to attract a steady inflow of FDI since the early 1980s and its cumulative FDI
stock by year-end 1992 was 55 percent more than its potential as predicted by our model. Guizhou's rich mineral resources, cheap labor, and nascent environmental regulatory framework may have helped the province absorb labor-intensive and high-polluting industries. The absolute value of its residual is just below $50 million, less than that of Beijing, Heilongjiang, or Hubei, although the latter three provinces' performances were less impressive in relative terms.
The "Under-Investors". Northwestern Ningxia and Gansu have the lowest per capita FDI
accumulations in China (Table 6). Our model shows that the differences between the two provinces' actual and predicted FDI stocks are among the lowest in the country. Their poor achievement in attracting FDI lies in the fact that they are at a clear disadvantage in almost every aspect of FDI. Perhaps most important is that their inconvenient geographical location and extremely low development levels provide little incentive to foreign investors.
Shanxi's large negative residual to actual FDI ratio suggests that the province's potential for attracting FDI has not been explored to its fullness. Although Shanxi is rich in coal and iron, and has a relatively well educated labor force (the 5th lowest illiteracy ratio), its small economic size and underdeveloped transportation system no doubt contribute to the province's overall inability to absorb more FDI than it could.
Coastal provinces Hebei and Zhejiang are also among the group of poor underperformers. In spite of the fact that they contain important "open cities" (such as Tangshan and Ningbo,
respectively), which enjoy special tax and other privileges, these two provinces did not benefit from their location as much as their neighboring provinces did. The gaps between their actual and predicted FDI levels reached over $900 million in absolute value. Part of the reason is that both provinces are sandwiched between two more developed and/or more accessible provinces. This kind of immediate competition helps to obscure some of the potentials that Hebei and Zhejiang possess and puts them in an unfavorable position when competing for foreign investment.
Shanghai's under-performance in absorbing FDI is rather surprising. It is the biggest industrial and commercial center in China with the highest per capita income, the most densely
12 The average cumulative FDI per project was $9,356 thousand (pledged value) for Shaanxi, compared with $6,331 thousand for Shanghai, $1,318 thousand for Guangdong; (Pomfret 1991).
developed infrastructure system, and a very well educated population. Pudong New Development Area also gives Shanghai an added advantage in attracting foreign investors. Part of Shanghai's close
to one billion dollar under-performance is explained by the stricter FDI screening process enforced
there. Shanghai's effort in selecting only those FDI projects that bring advanced technologies but little environmental impact, has deterred potential foreign investors; but it also makes Shanghai second only to Guangdong in the number of large foreign investment industrial companies.
Observations
A few conclusions can be drawn from our empirical results. First, the geographical distribution of FDI in China is mostly determined by GNP, infrastructure development, extent of general education, and coastal location. To increase the attractiveness of China's interior provinces as destinations for foreign capital, it is important for the government to develop inland infrastructure networks. Our simulation results suggest that, despite their close proximity and the special cultural links to Hong Kong and Taiwan, China, Guangdong and Fujian, as well as Hainan, may be
exhausting their potential as hosts for significant amounts of FDI in the future. Although the coastal provinces are already the destination of 90 percent of all the FDI in China, our model suggests that these provinces, especially Shanghai, Zhejiang, and Hebei, will continue to be the more attractive locations for foreign investment than the inland regions in general. However, along with the moves by China to further open its domestic market and to encourage more domestic investment in the
inland areas, the weight of FDI is now gradually shifting from the establishment of export processing
production centers to investment with a local market orientation that is more suitable to locate in the inland provinces. Hunan and Henan stand out in particular as promising investment locations.
IV.
SECTORAL DISTRIBUTION OF FDIAkin to the geographic distribution of FDI in China, the distribution of FDI across the country's industrial sectors is also skewed. This phenomenon became pronounced during the first half of the 1980s, when there was a concentration of FDI in the tourist industries, such as hotel and catering services, and more recently in real estate. Surprisingly, little effort has been made toward a rigorous quantitative analysis as to the determinants and impacts of the sectoral distribution of Chinese FDI or to put them into international perspective.
We base our analysis on data compiled by the United Nations in its World Investment Directory series. Table 10 displays the current landscape of FDI distribution by sector. The mean of the share of FDI flows into each industry is calculated for (i) the global economy as a whole, and for (ii) the developed countries, (iii) the Asian and Pacific countries, and (iv) the Latin American and Caribbean countries separately.
The Global Trend
The sectoral distribution of FDI varies greatly from country to country, and from year to year. Many factors that are unique to a particular region during a particular period of time work together in determining how FDI flows into the various sectors of an economy. Table 10 shows that the sectoral distribution of FDI is quite different between the three regions. The sector that has the most uniformity is the manufacturing sector, which attracts about 42 percent of global FDI on the average. In Asia, almost half of the FDI flowing into the region is concentrated in this sector. The proportion of FDI attracted to manufacturing in Latin America and the Caribbean is the smallest among the three, although it is still the largest sectoral share of FDI in that region.
Within the manufacturing sector, data on FDI stocks are disaggregated into twelve categories. Food, beverages, tobacco, chemicals and mechanical and electrical equipment industries are those that attract the most foreign capital. The chemicals industry, in particular, has consistently commanded the most FDI in all countries, attracting around 9 percent of total national FDI accumulation. For
the developed economies, this share is slightly lower, and is closely followed by mechanical
equipment and metals productions."3 In Asia, on the other hand, the chemicals industry hosts more
than 10 percent of the total FDI flowing into the region, although its share still lags behind that of the
electrical equipment industry.
Table 10: Global FDI Stock Distribution by Sector, 1993; China, 1984, 1988, 1993 Value (Number of Observations)
Overall Developed Asia Latin China
Economies America 1984 1988 1993 Primary 22.09 (44) 8.32 (14) 33.37 (14) 24.26 (16) 40.88 12.30 3.1 Agriculture 5.03 (44) 1.05 (14) 11.81 (14) 2.58 (16) 1.69 2.69 1.50 Mining 8.64 (44) 5.58 (14) 7.90 (14) 11.98 (16) 1.37 Petroleum 8.39 (44) 1.77 (14) 13.53 (14) 9.69 (16) 31.18 6.41 1.60 Secondary 42.42 (44) 43.04 (20) 46.06 (11) 38.40 (13) 26.97 47.60 51.20 Food 6.30 (41) 5.29 (17) 5.40 (11) 8.38 (13) 2.90 Textiles 2.93 (36) 1.43 (13) 3.07 (11) 4.45 (12) 1.69 Paper 2.02 (33) 2.76 (14) 0.57 (9) 2.30 (10) 5.79 Chemicals 9.16 (43) 8.46 (19) 10.57 (11) 9.01 (13) 1.31 Coal products 4.06 (18) 9.10 (5) 1.90 (7) 2.39 (6) Rubber 1.43 (21) 0.98 (7) 1.65 (7) 1.67 (7) Minerals 2.73 (31) 3.36 (11) 3.21 (9) 1.70 (11) 0.11 Metals 5.16 (39) 7.09 (18) 4.66 (10) 2.47 (11) 0.30 Mech equipment 6.18 (36) 7.94 (15) 4.09 (10) 5.69 (11) 7.62 Elec equipment 6.81 (23) 4.87 (9) 12.58 (7) 3.54 (7) Motor vehicle 3.61 (20) 2.14 (9) 5.95 (6) 3.88 (6) Other transport 0.87 (18) 1.66 (5) 2.32 (11) 0.13 (7) Tertiary 38.20 (53) 47.51 (20) 28.58 (15) 35.89 (18) 32.14 40.10 47.30 Construction 3.38 (40) 0.71 (14) 2.49 (13) 7.15 (13) 1.56 3.00 Distr trade 11.13 (50) 17.03 (19) 6.10 (14) 8.67 (17) 2.79 3.31 3.60 Transport 3.66 (41) 3.21 (17) 1.51 (11) 6.06 (13) 3.04 1.68' 1.60 Communication 0.71 (11) 0.39 (5) 0.99 (6) Finance 14.52 (46) 17.68 (20) 9.59 (11) 13.92 (15) 0.29 0.07 Real estate 4.79 (18) 10.09 (7) 1.99 (3) 1.21 (8) 15.36 28.34 32.60
Sources: UN World Investment Directory; China Economic News, No 28, 25th July, 1994. Data on Chinese transportation and communication are combined.
The variations in FDI shares in both the primary and the tertiary sectors are more noticeable.
While the world average for FDI stocks in the primary sector (which comprises agriculture, mining
and quarrying, and petroleum) is 22 percent, only a little more than 8 percent of the FDI in
developed countries goes to this sector; yet more than a third of Asian FDI accumulation is here. On
the average, the mining industries attract the most FDI in the primary sector, while agricultural
production the least. This trend is especially reflected in the developed economies and the Latin
American and the Caribbean countries, where the share of FDI in mining and quarrying is 5.3 and
4.6 times, respectively, that of agriculture, fishery, and forestry.
13 The 9.1 percent FDI share estimated for coal and petroleum products is based on the figures of 5 countries, too small a sample size to be the basis of general conclusions.
In Asia, however, the sectoral distribution of FDI in the primary sector has a very different
pattern. The offshore oil extracting industry dominates. It attracts more FDI than any other sector.
Moreover, unlike elsewhere in the world, a large percentage of FDI in Asia flows into agricultural,
forestry, and fishery industries.
International experience demonstrates that the services sector is the area that becomes more
attractive to foreign investment as an economy matures. This conclusion is corroborated by a
comparison of the share of FDI going into the services sector in the developed economies (47.5
percent) and the world average (38.2 percent). For the Asian and Pacific countries, however, the
tertiary sector attracts the least attention from foreign investors. Their FDI accumulation in this
sector is about 25 percent less than the world average.
Within the services sector, distribution as well as finance and banking are the leading
recipients of FDI. This is true for all country groups. For both the developed and the Latin
American and Caribbean countries, the finance and banking sector is the area that receives the most
FDI. However, for the fifteen Asian and Pacific countries in our sample, the financial sector, though
attracting more FDI than any other industries within the services sector in the region, lags behind four
other primary and manufacturing industries in terms of total FDI accumulation.
Comparing China
The last column of Table 10 reports the FDI sectoral distribution in China in three
representative years. The figures suggest that in the decade 1984-93, the sectoral composition of FDI
in China has changed substantially. The share of FDI in the primary sector dropped to 3.1 percent in
1993, from 40.9 percent in 1988, when offshore petroleum exploration alone hosted as much FDI as
the whole services sector accumulated between 1979-84. With the decline in the popularity of joint
development as a form of FDI in China (see Table 4), the primary sector's role in attracting FDI is
likely to stay small in the coming years.
At the same time, the Chinese manufacturing sector is fast becoming the most important field
to foreign investors. By 1991, this sector absorbed more than half of Chinese FDI, and the share of
FDI accumulation in this sector almost doubled between 1988-93. In addition, the investment focus
has begun to move from the textile processing, chemical, and mechanical and electronics industries to
technically advanced enterprises.
The Chinese services sector is another area foreign investors are making commnitments
with
increasing interest. During the ten years 1988-93, the services sector's FDI accumulation rose from
32 percent of total FDI stock in China to more than 47 percent, the level maintained by the developed
economies in the late 1980s. Within the services sector, however, the distribution of foreign capital
is skewed. Unlike the rest of the world, the financial sector in China absorbed less than 1 percent of
FDI, and its share has been decreasing since 1988. The distributive trade sector, although increasing
in importance between 1984-93, still accommodates only 3.6 percent FDI in China, compared with 17
percent in the developed economies and 6.1 percent in Asia. Instead, an overwhelming proportion of
Chinese service sector FDI has been concentrated in real estate. Despite the government's effort to
curb new fixed asset investment and a recent decline in the flow of FDI into hotel businesses, the
share of approved FDI accumulation in real estate more than doubled between 1984-93.
Table 11 displays FDI agreements contracted in 1995 by sector; these data thus signal the
future sectoral distribution of FDI flows into China (assuming the contracts are implemented). The
table shows that FDI in industry constitutes about two-thirds of total contracts. Real estate is the next
largest sectoral FDI recipient, with about one-fifth of contracted FDI.
Table 11: Contracted FDI Flows in China in 1995, by Sector
$US millions 1995 Value Share Total 91,282 100.0% Agriculture 1,736 1.9% Industry 61,648 67.5% Construction 1,918 2.1% Commerce 3,427 3.7% Transportation/Communication 1,700 1.9% Real estate 17,835 19.5% Other 3,018 3.4%
Source: China Statistical Yearbook, 1996.
Observations
In the main, China's sectoral distribution of FDI is coming in line with the rest of the world,
moving toward the pattern in the developed countries. But the FDI landscape across China's sectors
has been highly skewed.
In the services sector, concerted efforts are being made to attract FDI away from the real
estate sector and into financial services and telecommunications--pillar
sectors for mature economic
development. Within the financial services sector, although recent years have seen an increase in the
number of licenses granted to foreign banks to conduct foreign exchange transactions in China, these
institutions' activities are limited to the domestic securities markets.
As for telecommunications,
foreign firms have been banned from entering the industry. Their
current activity has primarily been limited to technology licensing and the manufacturing of digital
switching equipment. As China moves closer to a modern, market economy, there will be the need
for foreign investment to finance the development of this vital infrastructure component.
IV. CONCLUSION
This paper has analyzed the geographical and sectoral distribution that China has evidenced in
FDI inflows since reform began in 1978. It shows that despite the impressive overall achievement in
attracting an increasing amount of foreign investment, the pattern of FDI within China has been
skewed. To be sure, the authorities in China have begun to recognize the importance of distributing
FDI more equally. They are focusing on developing infrastructure facilities to previously
disadvantaged inland regions to make them more inviting to foreign capital, and are fashioning polices
to provide equal footing for FDI flows to certain manufacturing industries and underdeveloped
services sectors.
In terms of China's regional development policy, the Ninth Five Year Plan (1996-2000) gives
special attention to reducing regional disparities. Within that context, strides are being made to create
some degree of FDI policy neutrality across locales. To achieve better balance between inland areas
and the SEZs, announcements
have been made to begin a phase out of some of the tax preferences
given to foreign investors in the SEZs (although at the same time various inland cities are being
declared as having the same "open" status as the SEZs). These "better-than-national-treatment"
concessions are estimated to have an opportunity cost (of forgone tax revenue) of 1.2 percent of
China's GDP, while yielding few real incentives to foreign investors.
'4In fact, as noted above, there is little doubt that some, perhaps a significant share, of the
recorded FDI in China is due to "round-tripping"--actually
originating from domestic sources but
returning as "foreign"--simply
to take advantage of the tax incentives provided to foreign-invested
firms. Evidence that "round-tripping" takes place may be found in the "errors and omissions" of the
balance of payments, whose movements parallel those of FDI inflows. On this basis, perhaps as
much as 25 percent of China's FDI inflows are the result of "round-tripping." Other evidence may
be found in China's FDI outflows, especially to Hong Kong, which rose sharply in 1992 at the same
time that Hong Kong capital inflows to China increased. In April 1996, China eliminated exemptions
from the value added tax (VAT) and from customs duties on imported capital equipment for foreign
funded firms, thus enhancing its national-treatment
policy stance toward FDI.
Liberalization is also being introduced in stages with regard to FDI in certain sectors, as
articulated in a set of new FDI guidelines issued in late 1995. They provide for easing FDI
restrictions in transportation and communications,
banking, management consulting, insurance, and
other services industries, which were previous banned or allowed on an experimental basis in certain
coastal regions. Business establishments
belonging to banking, insurance, and other foreign-owned
financial institutions have begun to spread to the major cities around the country. In addition,
approvals have been given to the establishment of foreign-funded
accounting offices, law offices, and
consulting offices.
Still, despite these improvements and China's sizeable share of foreign direct investment, the
country's FDI policy regime is insufficiently
transparent, involves excessive levels of governmental
approval, and in many dimensions--such
as screening provisions, performance requirements,
expropriation rights and investor-state
dispute settlement--is
below international standards. As other
developing countries continue to improve the policy climate for FDI, without commensurate
improvements in its own FDI regime, China's relative attractiveness as a host country may suffer.
As part of its bid to join the WTO, China will be faced with an incentive to comply with the WTO's
investment provisions, which will help improve the country's FDI policy regime.
Using the prism of FDI as a case study, our basic message is like many other observers of the
eighteen year old Chinese "economic miracle." While China has made remarkable strides in moving
towards a market-oriented economy, greater attention is now required on the internal structure of the
country's development and on the inequities that have come to exist as a result of the reform
process. 5
15 An analysis of the prospects and problems of China's enterprise reform program is contained in Broadman (1995a).
REFERENCES
Atlas of the People's Republic of China. 1989. Foreign Languages Press, China Cartographic
Publishing House. Beijing, China.
Broadman, Harry G. 1994. "The Uruguay Round Accord on Trade in Services." The World
Economy, Vol. 17, No.3, May.
Broadman, Harry G. 1995a. Meeting the Challenge of Chinese Enterprise Reform. World Bank
Discussion Paper. No. 283. April. The World Bank.
Broadman, Harry G. 1995b. "Tax Policy Toward Foreign Direct Investment." Economic Policy
Note. August. The World Bank.
Broadman, Harry G. 1996. Policy Options
for Reform of Chinese State Owned Enterprises. World
Bank Discussion Paper. No. 335. June. The World Bank.
Caves, Richard. 1982 Multinational Enterprises and Economic Analysis, Cambridge University Press.
China Industrial Companies, 1993/94. State Statistical Bureau. 1993. China Statistical Information
and Consultancy Service Center.
China Statistical Yearbook, Various years. China Statistical Publishing House. Beijing.
"Foreign Investment in the PRC, 199192." 1993. China Newsletter (Japan), 102:1619, January
-February. China-North Asia Section. JETRO.
Huang, Dongpei and Sayuri Shirai. 1994. "Information Externalities Affecting the Dynamic Pattern of
Foreign Direct Investment: The Case of China." IMF Working Paper. Research Department.
International Monetary Fund.
Kawaguchi, Osamu. 1994. "Foreign Direct Investment in East Asia: Trends, Determinants and Policy
hnplications." World Bank Internal Discussion Paper, East Asia and Pacific Regional Series. The
World Bank.
Khan, Zafar Shah. 1991. "Patterns of Direct Foreign Investment in China." World Bank Discussion
Paper. No. 130. China and Mongolia Department Series. The World Bank.
Kumar, Nagesh. 1993. "Determinants of Export Orientation of Foreign Production by U.S.
Multinationals: An Inter-Country Analysis." Journal of International Business Studies, First Quarter:
141-156.
Lardy, Nicholas R. 1994. China in the World Economy. Institute for International Economics,
Washington DC.
Mintz, Jack. 1990. "Corporate Tax Holidays and Investment," World Bank Economic Review.
Pomfret, Richard. 1991. Investing in China: Ten Years of the Open Door Policy. Iowa State
University Press, Ames.
Wei, Shangiin. 1994. "Foreign Direct Investment in China: Sources and Consequences." Mimeo.
Harvard University and NBER.
Wells, Louis. 1986 "Investment Incentives: An Unnecessary Debate," The Center on Transnational
Corporations Reporter, United Nations.Woodward, D.P. and R. J. Rolfe. 1993. "The Location of Export-Oriented
Foreign Direct Investment
in the Caribbean Basin." Journal of International Business Studies, First Quarter: 121-144.
World Debt Tables. The World Bank, March 1996.
World Development Report. The World Bank. Various issues.
World Investment Report, 1995: "Transnational Corporations and Competitiveness".
United Nations.
World Investment Directory. United Nations. Various issues.Policy Research Working Paper Series
Contact
Title Author Date for paper
WPS1705 The Polish Experience with Bank Fernando Montes-Negret January 1997 T. Ishibe
and Enterprise Restructuring Luca Papi 38968
WPS1706 Monetary Policy during Transition: Martha de Melo January 1997 C. Bernardo
An Overview Cevdet Denizer 37699
WPS1707 Trade Reorientation and Productivity Simeon Djankov January 1997 J. Ngaine
Growth in Bulgarian Enterprises Bernard Hoekman 37947
WPS1708 Has Latin America's Post-Reform William Easterly January 1997 R. Martin
Growth Been Disappointing? Norman Loayza 31320
Peter Montiel
WPS1709 Poverty Comparisons with Jean Olson Lanjouw January 1997 A. Ramirez
Noncompatible Data: Theory and Peter Lanjouw 85734
Illustrations
WPS1710 Why Paper Mills Clean Up: Raymond S. Hartman January 1997 D. Wheeler
Determinants of Pollution Abatement Mainul Huq 33401
in Four Asian Countries
WPS1711 Issues in Comparing Poverty Trends Christine Jones January 1997 R. Martin
Over Time in Cote d'lvoire Xiao Ye 31320
WPS1712 Demand Elasticities in International Arvind Panagariya December 1996 J. Badami
Trade: Are They Really Low? Shekhar Shah 80425
Deepak Mishra
WPS1713 Why Did Colombian Private Savings Alejandro Lopez January 1997 E. Khine
Decline in the Early 1990s? 37471
WPS1714 Fiscal Federalism in Bosnia- William Fox January 1997 Y. Jiwa
Herzegovina: The Dayton Challenge Christine Wallich 34848
WPS1 715 The Evolution of Poverty and Welfare Sudharshan Canagarajan January 1997 B. Casely-Hayford
in Nigeria, 1985-92 John Ngwafon 34672
Saji Thomas
WPS1716 Reforming Pensions in Zambia: An Monika Queisser January 1997 H. Arbi
Analysis of Existing Schemes and Clive Bailey 34663
Options for Reform John Woodall
WPS1717 Fiscal Federalism in Bosnia- William Fox January 1997 Y. Jiwa
Herzegovina: The Dayton Challenge Christine Wallich 34848
WPS1718 Does Environmental Regulation Muthukumara Mani, February 1997 E. de Castro
Matter? Determinants of the Location Sheoli Pargal, and 89121
of New Manufacturing Plants in India Mainul Huq in 1994
Policy Research Working Paper Series
Contact
Title Author Date for paper
WPS1719 Shifting Responsibility for Social David Sewell February 1997 C. Lawrence
Services As Enterprises Privatize in 32216
Belarus
WPS1720 The Distribution of Foreign Direct Harry G. Broadman February 1997 J. Grigsby