1
Greenhouse Gas and Noxious Emissions from Dual Fuel Diesel and Natural Gas
1
Heavy Goods Vehicles
2
Marc E.J. Stettler1,2*, William J.B. Midgley1, Jacob J. Swanson3, David Cebon1, Adam M. 3
Boies1 4
1Centre for Sustainable Road Freight, Department of Engineering, University of Cambridge, 5
Cambridge, CB2 1PZ, UK. 6
2Centre for Transport Studies, Department of Civil and Environmental Engineering, Imperial 7
College London, London SW7 2AZ, UK. 8
3Minnesota State University, Mankato, Mankato, Minnesota, 56001, USA. 9
*Corresponding author: Centre for Transport Studies, Department of Civil and 10
Environmental Engineering, Imperial College London, London SW7 2AZ, UK. Tel: +44 (0) 11
207 594 2094. Fax: +44 (0) 207 594 6102. Email: m.stettler@imperial.ac.uk 12
Abstract
13
Dual fuel diesel and natural gas heavy goods vehicles (HGVs) operate on a combination of 14
the two fuels simultaneously. By substituting diesel for natural gas, vehicle operators can 15
benefit from reduced fuel costs and as natural gas has a lower CO2 intensity compared to 16
diesel, dual fuel HGVs have the potential to reduce greenhouse gas (GHG) emissions from 17
the freight sector. In this study, energy consumption, greenhouse gas and noxious emissions 18
for five after-market dual fuel configurations of two vehicle platforms are compared relative 19
to their diesel-only baseline values over transient and steady state testing. Over a transient 20
cycle, CO2 emissions are reduced by up to 9% however methane (CH4) emissions due to 21
incomplete combustion lead to CO2e emissions that are 50-127% higher than the equivalent 22
diesel vehicle. Oxidation catalysts evaluated on the vehicles at steady state reduced CH4 23
emissions by at most 15% at exhaust gas temperatures representative of transient conditions. 24
This study highlights that control of CH4 emissions and improved control of in-cylinder CH4 25
combustion are required to reduce total GHG emissions of dual fuel HGVs relative to diesel 26 vehicles. 27 1 Introduction 28 1.1 Context 29
2
Globally, road freight transport is responsible for around a quarter of transport energy use1. In 30
the UK, heavy goods vehicles (HGVs) involved in freight movements account for 22% and 31
23% of road transport energy use2 and greenhouse gas (GHG) emissions3 respectively. Long 32
haul and regional duty cycles account for approximately 70% of UK HGV CO2 emissions 33
and the substitution of natural gas (NG) for diesel has the potential to reduce HGV CO2 34
emissions due to the lower CO2 intensity of methane compared to diesel4. In 2012, the UK 35
Technology Strategy Board and the Office for Low Emission Vehicles provided £11.3m 36
(~$17.5m) to trials of 362 diesel-NG dual fuel trucks, using five different dual fuel systems. 37
Four out of five of these systems are aftermarket conversions, while one is supplied by an 38
original equipment manufacturer (OEM)5. In 2013, the European Commission provided 39
€14.3m (~$15.6m) to the trial of 100 LNG HGVs, including dual fuel vehicles6. In the US, 40
the Environmental Protection Agency has certified one diesel-NG conversion system for new 41
engines, which grants exemption from the Clean Air Act tampering prohibition, and a 42
number of other dual fuel systems for intermediate age engines7. 43
The use of NG as a transport fuel is at least partially motivated by the potential to reduce CO2 44
emissions. The primary component of NG is methane (CH4). As CH4 has a higher ratio of 45
hydrogen to carbon atoms (4:1) than diesel (~2:1), less CO2 is emitted per unit of chemical 46
energy released by combustion. A dual fuel engine is a conventional compression ignition 47
diesel engine in which a significant proportion of the energy released by combustion is 48
derived from the combustion of a gaseous fuel, such as NG8. All of the dual fuel systems 49
installed on vehicles residing the UK operate by injecting NG into the intake air prior to the 50
intake valves so that a NG-air mixture is drawn into the combustion chamber5,9–12. This NG-51
air charge is then ignited by an injection of diesel at the end of the compression stroke, which 52
has a shorter ignition delay than the NG8. This dual fuel concept differs from systems that 53
employ high-pressure direct injection (HPDI) of NG into the combustion chamber13. 54
Dual fuel engines offer an attractive alternative to other engine technologies due to the (i) 55
higher thermal efficiency relative to spark-ignited engines, (ii) flexible fuel capability with 56
the option to operate solely on diesel when gaseous fuel is not available, (iii) reduced fuel 57
costs, and (iv) reductions in emissions of CO2 and other engine exhaust components4,14. 58
Previous studies of dual fuel engine emissions have focussed on engine dynamometer testing, 59
rather than full vehicle emissions testing. These studies have shown significant changes to 60
emissions when compared to conventional diesel engines8,14–21. Dual fuel engine emissions 61
depend on a number of parameters including the engine speed, engine load, the composition 62
3
and quantity of primary gaseous fuel, the quantity of pilot diesel, the temperature of the 63
intake primary fuel and air mixture, the pilot injection timing and stratification of the gaseous 64
fuel and air mixture16,21–23. In previous studies, dual fuel combustion with NG as the primary 65
fuel led to reduced emissions of oxides of nitrogen (NOx) but increased emissions of carbon 66
monoxide (CO) and unburnt hydrocarbons (HC)14–21. The majority of the unburnt 67
hydrocarbon emissions from a NG dual fuel engines is CH4 and the magnitude of these 68
emissions depended strongly on the concentration of the gaseous fuel in the cylinder14,18. 69
Using a global warming potential (GWP) of 25 for CH4, Besch et al.18 showed that while CO2 70
emissions were reduced by 3-8% for three dual fuel engines relative to diesel operation over 71
the heavy duty engine Federal Test Procedure, emissions of CH4 led to 18-129% increases in 72
CO2e emissions. 73
Previous smoke opacity measurements have shown that diesel and NG dual fuel combustion 74
has the potential to reduce smoke emissions19,20,24. Graves et al.25 characterised the 75
morphology and volatility of particles emitted by an HPDI dual fuel engine, however this is a 76
distinctly different dual fuel concept from that employed by the systems currently in use and 77
evaluated in this study. 78
1.2 Overview 79
This paper presents an evaluation of transient and steady state energy use, greenhouse gas, 80
nitrous oxides, carbon monoxide and particulate matter (PM) emissions of five vehicle 81
configurations of two dual fuel aftermarket conversion systems that account for the majority 82
(~60%) of the 362 trialled dual fuel vehicles in the UK5. In contrast to previous studies that 83
have tested engines installed on engine dynamometers21, this study tests in-use vehicles with 84
emissions control devices on a chassis dynamometer to quantify dual fuel HGV emissions 85
factors for subsequent use in environmental impact assessments and provide emissions 86
metrics that are relevant to policy makers and logistics fleet operators. Furthermore, this 87
paper highlights areas for technology development. Due to commercial sensitivities, the 88
vehicle owners and the dual fuel conversion suppliers have not been disclosed. 89
2 Materials and methods
90
2.1 Outline of study 91
The vehicle configurations and specifications of the original vehicle platforms are 92
summarised in Table 1. This study’s authors did not modify or attempt to control the 93
performance of the dual fuel systems or fuelling strategies. On both vehicles where methane 94
4
oxidation catalysts are present, these were installed upstream of the OEM selective catalytic 95
reduction (SCR) unit by the dual fuel conversion suppliers. The dosing of aqueous urea 96
solution in the SCR systems on both vehicles was not altered and neither vehicle was fitted 97
with a diesel particulate filter. Configurations A0 (4×2 tractor) and B0 (6×2 tractor) are taken 98
as baseline tests, while A1 and B1 are the most common diesel-NG dual fuel vehicle 99
configurations for suppliers A and B respectively. The configuration in A2 and A4 is unique 100
for this study and is not a standard option offered by supplier A; it was tested to evaluate the 101
impact of an oxidation catalyst on performance and emissions. This oxidation catalyst was a 102
prototype design that was installed immediately before these emissions tests were conducted. 103
In contrast, the oxidation catalyst on vehicle B had been installed on the vehicle for 104
approximately 500,000 km and is therefore is representative of catalysts in operation. 105
Transient cycle and steady state vehicle emissions testing was conducted on a 1.22 m (42 in.) 106
single roll chassis dynamometer capable of simulating 20 tonnes of inertia (Millbrook 107
Proving Ground Ltd, Bedford, MK45 2JQ, UK). Further experimental details including fuel 108
properties and uncertainty analyses are shown in the Supporting Information. 109
5
Table 1: Test vehicle specifications and list of transient test parameters.
110
Base vehicle Ref. After-treatment Fuel Hot/cold start
EURO V 4×2 tractor Max power: 228 kW Max torque: 1275 Nm Engine displacement: 9.2 L Compression ratio: 17.4 Bore/ Stroke: 118/140 mm Wheelbase: 3.6 m A0 SCR Diesel Hot
A1 SCR Dual fuel Hot
A2 SCR & Oxi cat Dual fuel Hot
A3 SCR Dual fuel Cold
A4 SCR & Oxi cat Dual fuel Cold
EURO V 6×2 tractor Max power: 295 kW Max torque: 2000 Nm Engine displacement: 11.97 L Compression ratio: 18.5 Bore/ Stroke: 128/155 mm Wheelbase: 3.9 m
B0 SCR & Oxi cat Diesel Hot
B1 SCR & Oxi cat Dual fuel Hot
B2 SCR & Oxi cat Dual fuel Cold
2.2 Test cycles 111
Transient cycle emissions were obtained over the vehicle version of the European Transient 112
Cycle, developed by the FIGE Institute26. The FIGE cycle has three distinct phases, 113
representing urban (U), rural (R) and motorway (M) driving. Hot start tests followed a 114
consistent engine warm up procedure, while cold start tests were conducted at 0°C after the 115
vehicle had been soaked overnight. Steady state emissions testing on the chassis 116
dynamometer was conducted to develop a map of engine emissions as a function of engine 117
torque and speed (revolutions per minute, rpm) that would also be of further use in vehicle 118
emissions models27. Engine speed and torque were systematically varied in ~200 rpm and 119
~200 Nm steps respectively. Each test point was held for at least two minutes, consistent with 120
regulatory engine test cycles28,29. 121
2.3 Instrumentation 122
The net flow rate of diesel supplied to the engines was measured using an FMS MK10 fuel 123
flowmeter (JPS Engineering, UK), which recorded flow in 5 mL increments. The mass flow 124
rate of NG delivered to the engines was measured by a Rotamass RCCS34 Coriolis flow 125
meter (Yokogawa Electric Corporation, Japan) placed in line between the low pressure 126
regulator and gas injectors of the dual fuel systems. This Coriolis flow meter was sized to 127
minimise interference with dual fuel system by minimising pressure drop while maintaining 128
accuracy; at a nominal flow rate of 22.5 kg/hour at 5 bar and 20°C, the pressure drop and 129
accuracy were calculated to be 17 mbar and 1.1% respectively. The energy substitution ratio 130
(ESR) is defined as the proportion of total energy supplied to the engine in the form of NG, 131
6
ESR [%] = 𝑚̇NG,inLCVNG
𝑚̇NG,inLCVNG+ 𝑚̇diesel,inLCVdiesel × 100 ,
(1)
where 𝑚̇NG,in and 𝑚̇diesel,in are the mass flow rates of NG and diesel supplied to the engine 132
respectively, and LCV is the lower calorific value of the fuel. 133
Engine emissions and exhaust gas temperatures were measured at two locations in the 134
exhaust; (i) post-turbo (PT), equivalent to an engine-out measurement, and (ii) at the tailpipe. 135
A complete list of the emissions analysers and emissions species is included in the SI. 136
Reported emissions factors have been calculated based on the modal 1 Hz data for transient 137
and steady state testing. For CO2, NOx and CO, these emissions factors were within 1%, 1% 138
and 7% of emissions factors calculated based on averaged bag measurements over the entire 139
transient test cycle. 140
CH4 emissions were measured at the post-turbo and tailpipe locations using Fourier 141
Transform Infra-Red (FTIR) spectrometers (Multigas 2030 and 2030 HS respectively, MKS 142
Instruments, MA, USA). CH4 slip is reported as the ratio of the mass flow rate of exhausted 143
CH4, 𝑚̇CH4,tailpipe, to the mass flow rate of CH4 supplied to the engine in the NG, 𝑚̇CH4,in, 144 CH4 slip [%] = 𝑚̇CH4,tailpipe 𝑚̇CH4,in × 100% . (2)
The effectiveness of oxidation catalysts in the vehicles’ exhaust after-treatment systems was 145
evaluated by comparing CH4 concentrations at the post-turbo and tailpipe sampling points 146
measured by the two FTIR instruments. 147
A DMS500 (Cambustion Ltd, UK) measured real-time particle size distributions at the 148
tailpipe. PM and black carbon (BC) mass emissions were estimated using the integrated 149
particle size distribution (IPSD) method30,31. The aggregate effective density, 𝜌
eff, as a 150
function of mobility diameter, 𝑑p, was calculated as 151 𝜌eff = 𝜌0(𝑑p 𝑑pp) 𝐷m , (3)
where 𝜌0 is the material density, 𝑑pp is the primary particle diameter and 𝐷m is the mass-152
mobility exponent with assumed values of 2 g/cm3, 16 nm and 2.35 respectively32. For 𝑑p
153
less than 30 nm, an effective density of 1.46 g/cm3 is assumed32. Total PM mass was 154
7
calculated by integrating over the entire size distribution (5-1000 nm), while for BC, a 155
lognormal distribution was fitted to the accumulation mode. Reported particle number (PN) 156
emissions factors are calculated by summing the product of the particle size distribution and a 157
detection efficiency curve33 fitted to data for condensation particle counters with detection 158
efficiencies of 50% at 23 nm34. This enables comparison to measurements following the solid 159
particle number measurement protocol developed through the Particle Measurement 160
Programme (PMP)35. 161
Total GHG emissions, as CO2e were calculated by summing CO2, CH4, N2O, NOx, CO and 162
BC emissions multiplied by their GWPs for a time horizon of 100 years. GWPs for CH4 (34) 163
and N2O (298) are taken from the IPCC’s Fifth Assessment Report (AR5) and include 164
climate-carbon feedbacks 36. All GWPs are included in the SI and we note that choosing a 165
shorter time horizon (e.g. 20 years) would increase the importance of short-lived species (e.g. 166
CH4). 167
3 Results
168
3.1 Transient cycle energy consumption and emissions 169
Distance specific energy consumption and emissions factors over different phases of the 170
FIGE cycle (U = urban, R = rural, M = motorway, C = combined) for the different vehicle 171
configurations are shown in Table 2 and Table 3. This data is shown graphically in the SI. 172
Distance specific energy consumption is generally highest during the urban phase, followed 173
by the motorway and rural phases for all vehicle configurations. In general, dual fuel 174
operation reduces energy efficiency and results in higher total energy consumption compared 175
to the baseline diesel only tests (A0 and B0). For A1 and B1, combined energy consumption 176
is 12% and 10% higher than the equivalent diesel tests. Previous studies have also shown that 177
energy efficiency of dual fuel engines are reduced compared to diesel at low and intermediate 178
engine loads, which is attributed to lower combustion efficiency of the lean NG-air charge 179
mixture and higher rates of heat loss during combustion21. Over the four dual fuel tests with 180
vehicle A, higher ESR during A1 and A3 compared to A2 and A4, indicate that the dual fuel 181
system supplier may have updated their control software. Comparing A1 to A2, higher ESR 182
is correlated with higher energy consumption yet lower CO2 emissions. For vehicles A and B, 183
the highest ESR is observed during the motorway phase and during this phase, the CO2 184
emissions factor is lowest and the relative reduction compared to diesel is greatest at up to 185
11% and 13% for A1 and B1 respectively. For context, the fuel properties (shown in the SI) 186
8
indicate that complete combustion of NG would emit approximately 21% less CO2 per unit of 187
energy than diesel used in this study, assuming no change in energy efficiency. For the cold 188
start tests, (A3, A4 and B2), distance specific energy consumption and emissions of CO2 are 189
generally greater than the equivalent hot start test. Both dual fuel conversion suppliers 190
account for engine temperature in their control of the ESR; during the urban phase, when 191
engine temperatures are cold, the ESR is significantly reduced relative to the same phase in 192
hot start tests. 193
Table 2: Energy consumption, energy substitution ratio, CO2 and CO2e emissions
194
factors from transient testing. U = urban, R = rural, M = motorway, C = combined
195
phases of the FIGE cycle.
196 Energy (MJ/km) ESR (%) CO2 (g/km) CO2e (g/km) Ref. U R M C U R M C U R M C U R M C A0 12.8 10.2 10.5 10.7 0 0 0 0 957 753 747 777 954 751 740 772 A1 13.7 11.1 12.3 12.0 37.6 45.9 58.3 50.9 923 686 662 705 1264 931 1055 1036 A2 12.5 10.4 11.6 11.3 31.0 37.1 51.4 43.4 920 708 663 714 1344 1013 1239 1168 A3 16.7 11.5 12.3 12.6 16.5 46.8 59.3 49.1 1175 711 676 753 1305 952 1083 1062 A4 13.1 12.1 12.6 12.5 5.4 37.3 48.7 40.0 1184 724 673 744 1269 1089 1352 1242 B0 14.6 10.1 11.0 11.2 0 0 0 0 1135 754 742 798 1129 758 748 801 B1 20.4 9.9 11.9 12.2 32.7 53.6 73.5 60.7 1156 692 649 730 2522 1408 1945 1817 B2 15.7 13.3 14.3 14.1 0.9 54.0 71.1 57.4 1443 703 650 751 1380 1550 2418 1977
CO2 and CH4 (shown in Table 3) dominated total CO2e emissions and capture the first-order 197
climate impacts of dual fuel relative to diesel. The combined cycle relative contribution of 198
CH4 normalised to the CO2 contribution was between 40% for A3 and 150% for B2. CH4 199
emissions factors are typically highest during the motorway phase, which is also the phase 200
with highest ESR. For all dual fuel tests on both vehicles, CH4 emissions led to increased 201
CO2e emissions relative to the diesel baseline tests. Comparing A1 to A0 and B1 to B0, dual 202
fuel operation increased CO2e emissions factors by 32%, 24%, 42% and 123%, 86%, 160% 203
for the urban, rural and motorway phases respectively. Therefore, it is clear that CH4 204
emissions outweigh potential reductions in CO2 emissions that result from substituting diesel 205
for NG. For A1, 8.4%, 6.5% and 8.1%, and for B1, 30.1%, 18.4% and 21.0% of CH4 that is 206
delivered to the engine is emitted to the atmosphere during the urban, rural and motorway 207
phases respectively. These findings are in agreement with previous engine dynamometer 208
testing of dual fuel retrofit systems, which also measured significant increases in CO2e 209
emissions due to CH4 emissions18. The addition of an oxidation catalyst to A2 compared to 210
A1 did not significantly reduce CH4 emissions; indeed distance specific CH4 emissions are 211
9
increased, which could be indicative of an altered fuelling strategy or that backpressure due 212
to the oxidation catalyst may have had an adverse effect on in-cylinder combustion and 213
therefore engine emissions performance. Oxidation catalyst effectiveness is discussed further 214
in Section 3.3. 215
Table 3: NOx, CH4, PM and PN emissions from transient testing. U = urban, R = rural,
216
M = motorway, C = combined phases of the FIGE cycle.
217 NOx (g/km) CH4 (g/km) PM mass (mg/km) PN (×1014 #/km) Ref. U R M C U R M C U R M C U R M C A0 7.8 4.4 4.0 4.6 0.0 0.0 0.0 0.0 54.5 26.8 19.5 26.8 1.66 0.84 0.72 0.89 A1 7.4 3.6 1.9 3.3 8.5 6.5 11.4 9.2 77.8 48.3 13.8 35.1 1.89 1.10 0.43 0.87 A2 10.2 4.4 2.0 4.0 11.5 8.3 16.5 12.8 89.0 54.5 24.6 44.2 2.31 1.47 0.79 1.24 A3 12.3 4.4 2.1 4.2 3.9 6.6 11.8 8.8 29.4 36.3 12.7 23.7 0.61 0.85 0.37 0.58 A4 14.3 5.3 2.6 4.8 2.3 10.5 19.8 14.4 76.2 33.6 13.8 27.7 2.12 0.93 0.51 0.83 B0 7.3 1.0 0.3 1.5 0.0 0.0 0.0 0.0 28.7 10.7 6.9 11.2 0.99 0.28 0.22 0.34 B1 2.4 0.9 2.3 1.8 38.9 18.9 35.6 29.7 40.4 13.9 8.5 14.7 1.38 0.31 0.25 0.42 B2 19.7 2.8 2.6 4.4 0.1 24.7 45.8 33.0 13.0 6.3 5.1 6.3 0.38 0.14 0.15 0.17
The combined cycle relative contributions of all species to CO2e emissions are shown in the 218
SI. For the dual fuel tests on vehicle B, the next largest contributor was N2O emissions with 219
10% and 16% of the CO2 contribution for tests B1 and B2 respectively. Measured N2O 220
emissions for these tests were significantly higher than for B0 or for any of the tests with 221
vehicle A Tailpipe NOx emissions during the motorway phase of B1 were significantly 222
increased compared to B0. This is despite post-turbo NOx emissions being approximately 223
halved in B1 compared to B0 over the same phase (shown in the SI). For vehicle A dual fuel 224
tests, post-turbo NOx emissions were reduced by ~40% and tailpipe NOx by ~50% during the 225
motorway phase compared to the baseline A0. For A1, post-turbo and tailpipe NOx emissions 226
were reduced by 30% compared to diesel over the combined cycle. Post-turbo NO2/NOx 227
ratios were also different for dual fuel compared to diesel; for A1 this ratio was 0.34 over the 228
combined cycle compared to 0.06 for A0 (shown in the SI). After the SCR, NO2/NOx ratios 229
decreased to 0.15 for A1 and increased to 0.22 for A0. Indeed at the tailpipe, dual fuel 230
NO2/NOx ratios are generally lower than for the diesel tests for both vehicles A and B. 231
Performance of the SCR systems over the combined cycle reduced from 43% to 34-41% 232
comparing A0 to A1 and A2, and 83% to 67% comparing B0 to B1. These results indicate 233
that duel fuel operation affects the efficacy of the OEM SCR systems. 234
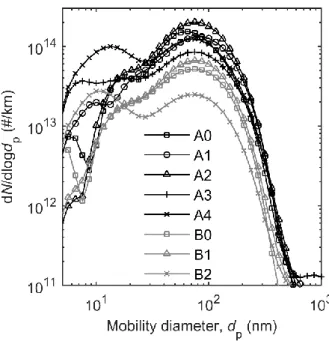
Particle mass and particle number emissions in warm start dual fuel tests were higher than the 235
baseline diesel tests. The distance averaged particle size distributions (i.e. weighted by 236
10
exhaust volumetric flow and divided by cycle distance) are shown in Figure 1. Bimodal 237
distributions are present for all tests. Comparing A1 to A0, the PM mass emissions factor is 238
increased by ~30% due to a shift in the accumulation mode peak diameter from ~65 nm to 239
~85 nm with total particle number emissions approximately equivalent. The peak of the 240
accumulation mode for vehicle B is not shifted significantly between B0 and B1, however the 241
PN emissions are increased by ~20% leading to a ~30% increase in total PM mass. Cold start 242
tests led to a more significant nucleation mode peaks and reduced accumulation mode peaks 243
relative to equivalent hot start tests. The contribution of BC mass to CO2e emissions as a 244
percentage of the CO2 contribution is between 1.8-4.3% for vehicle A and 0.5-1.3% for 245
vehicle B relative to CO2. BC mass contributed between 60-80% of total PM mass, across all 246
transient tests, as shown in the SI along with uncertainties on the particle size distributions. 247
Steady state PM mass emissions for vehicle A are discussed further in the following section. 248
Engine power specific emissions factors for vehicle A over the combined FIGE/ETC cycle 249
are shown in the SI and compared to EURO V regulatory values for engine dynamometer 250
tests over the equivalent cycle28. The baseline A0 configuration is compliant with CO and 251
PM mass standards, however NOx emissions are ~2.5 times higher than the standard (2.0 252
g/kWh). Indeed, NOx emissions were higher than the EURO V standard for all vehicle A 253
configurations. Dual fuel operation led to increased CO emissions for A1, however the 254
oxidation catalyst on configuration A2 meant CO emissions were equal to those of A0. CH4 255
emissions, which are only regulated for NG engines at type-approval28, were 8.9 times higher 256
than the regulatory limit value (1.1 g/kWh) for the A1 configuration of this aftermarket dual 257
fuel system. 258
11
Figure 1: Distance specific particle size distributions over the combined FIGE cycle.
3.2 Steady state emissions 259
Steady state maps of ESR and CH4 slip for A1, and the ratio of dual fuel to diesel (A1:A0) 260
CO2 and CO2e emissions as a function of engine speed and torque are shown in Figure 2. For 261
A1, the ESR reaches ~70% for engine speeds between 1200 and 1600 rpm and relatively low 262
engine torque around ~300 Nm. At higher engine torque output and engine speeds, the ESR 263
is reduced (as controlled by the system supplier’s own proprietary software); at 600 Nm, the 264
ESR is between 50-60% for the 1200-1600 rpm range. This can be cross referenced to the 265
average ESR over the motorway phase of the transient cycle measured to be 58% for A1, 266
during which the average engine torque and speed were approximately 600 Nm and 1400 rpm 267
respectively. CH4 slip is greatest at higher engine speeds, indicating that incomplete 268
combustion of CH4 is most significant when the in-cylinder residence time is lowest. The 269
ratio of CO2 emissions for A1 versus A0 indicates that the greatest reduction in CO2 270
emissions is around 15% and that this occurs for engine speeds between 1000-1600 rpm and 271
engine torque between 300-500 Nm. This corresponds to areas of high ESR (50-70%) and 272
lower engine speeds. However, as shown for the transient cycle emissions, CH4 emissions for 273
A1 lead to higher total CO2e emissions over almost the entire map compared to A0; this ratio 274
is highest at low engine torques and higher engine speeds. 275
12
Figure 2: (a) Energy substitution ratio (ESR) of A1, (b) CH4 slip of A1, (c) ratio of
CO2 emissions for A1:A0, and (d) ratio of CO2e emissions for A1:A0 all as a function
13
Further evidence of incomplete combustion of CH4 at higher engine speeds is provided in 276
Figure 3, which shows the dual fuel to diesel (A1:A0) ratio of post-turbo NOx and CO 277
emissions and exhaust temperature. Dual fuel NOx emissions are lower than diesel over most 278
of the map, however the greatest reductions are observed for engine speeds greater than 279
~1800 rpm indicating lower average in-cylinder temperatures. This is further supported by 280
the map of post-turbo exhaust temperatures which are generally lower for A1 than A0 for 281
engine speeds greater than ~1800 rpm and engine torque greater than ~400 Nm. Post-turbo 282
CO emissions, a product of incomplete combustion, are greater across the entire map for A1 283
compared to A0, and at high engine speeds they are increased by an order of magnitude. 284
Steady state PM mass emissions are shown in Figure 3 as a ratio of those measured for 285
configurations A1 and A0. In the previous section, we showed that PM mass emissions 286
increased for the dual fuel transient cycle tests compared to diesel. In Figure 3, it is evident 287
that PM mass emissions are up to 50% lower for A1 compared to A0 at engine loads below 288
600 Nm and engine speeds below 2000 rpm. However at engine loads greater than 600 Nm 289
and engine speeds less than 1500 rpm, PM mass emissions are increased for A1 compared to 290
A0 by up to a factor of 3. 291
14
Figure 3: Ratios of (a) tailpipe PM mass emissions, (b) post-turbo (PT) NOx emissions, (c) PT CO emissions, and (d) PT exhaust temperature as a function of engine speed and torque measured during steady state testing of vehicles A1 and A0.
15 3.3 Oxidation catalyst effectiveness
292
The effectiveness of the oxidation catalysts fitted to vehicles A2 and B1 during steady state 293
testing is shown in Figure 4. The catalysed oxidation of CH4 is a function of both residence 294
time within the catalyst and exhaust gas temperature37. The measured catalyst effectiveness 295
was greatest at high temperatures and residence times, i.e. low exhaust flow rates. For A2, the 296
highest observed catalyst efficiency was 27% for a post-turbo exhaust temperature of 470°C 297
and exhaust volumetric flow rate of 0.07 m3/s. For B1, the highest observed catalyst 298
efficiency was 30% for a post-turbo exhaust temperature of 505°C and exhaust volumetric 299
flow rate of 0.10 m3/s. For context, the average post-turbo exhaust temperatures and exhaust 300
gas flow rates during the motorway phase of the transient cycle test were 396°C and 0.14 301
m3/s for A2 and 370°C and 0.16 m3/s for B1. These flow rates correspond to gas hourly space 302
velocities of approximately 190,000 h-1 and 76,000 h-1 for the oxidation catalysts on A and B 303
respectively. Below 400°C, the maximum performance of these catalysts were 15% and 10% 304
for A2 and B1 respectively and therefore these results support the transient emissions results 305
presented above that highlighted the significant contribution of tailpipe CH4 to CO2e 306
emissions. 307
A benefit of the oxidation catalysts is to oxidise increased CO emissions during dual fuel 308
operation to CO2. Post-turbo and tailpipe CO emissions factors are shown in the SI. Even 309
without the CH4 oxidation catalyst, CO emissions are reduced by 72%, 81% and 76% by the 310
SCR system for vehicles A0, A1 and A3 respectively. However, with the CH4 oxidation 311
catalyst, CO emissions are reduced by 94% and 92% for A2 and A4 respectively. Similarly, 312
CO emissions were reduced by 95%, 93% and 97% for tests B0, B1 and B2 respectively. 313
16
Figure 4: CH4 oxidation efficiency of the catalyst present on (a) vehicle A2 and (b) B1
as a function of exhaust flow rate and post-turbo exhaust temperature as measured during steady state testing.
4 Discussion
314
This study evaluated the emissions performance of two vehicle platforms with five 315
aftermarket dual fuel system configurations via chassis dynamometer testing of in-use 316
vehicles that are part of trials of low-carbon trucks in the UK. All dual fuel systems evaluated 317
in this study increased tailpipe total GHG (CO2e) emissions compared to their equivalent 318
diesel vehicles by 50% and 127% over the combined FIGE cycle for configurations A1 and 319
B1 respectively. This is despite CO2 emissions being reduced by up to ~9% and is primarily a 320
result of incomplete combustion of CH4 and subsequent CH4 emissions, termed CH4 slip. The 321
three main mechanisms of CH4 slip are (i) valve overlap which causes a proportion of the 322
NG-air charge to be directly exhausted, (ii) incomplete combustion due to crevices and flame 323
17
quenching at the walls of the cylinder, and (iii) incomplete combustion due to lean NG-air 324
mixtures and in-cylinder temperatures which prevent the flame from propagating throughout 325
the charge.21,38Evidence for incomplete combustion and lower in-cylinder temperatures was 326
provided by post-turbo emissions measurements showing higher CO and lower NOx 327
respectively at steady state conditions, especially at higher engine speeds when in-cylinder 328
residence times are reduced. The results of this in-use vehicle emissions study are consistent 329
with and supplement a large number of engine emissions studies showing that NOx emissions 330
decrease and CO emissions increase with dual fuel combustion relative to diesel. Thus, 331
refinement of dual fuel systems to reduce CH4 slip by addressing these three mechanisms and 332
to improve CH4 combustion efficiency are required. Our results suggests that reducing ESR 333
at high engine speeds could have a beneficial effect on total CO2e emissions and the 334
magnitude of this effect over a transient drive cycle should be the topic of further modelling 335
or experimental studies. Another example is to increase the diesel pilot quantity and advance 336
the pilot injection timing23, however trade-offs are increased NOx emissions and lower ESR 337
and therefore a reduced CO2 benefit compared to diesel combustion. Direct CH4 injection and 338
stratification of the NG within the cylinder may also have the potential to reduce dual fuel 339
CH4 emissions. 340
CH4 slip can also be controlled by exhaust after-treatment, however the oxidation catalysts 341
tested in this study reduced CH4 emissions by at most 15% at exhaust gas temperatures 342
representative of transient conditions (~400°C). Thus, the commercial development of 343
effective catalysts (e.g. Cargnello et al.39) that successfully oxidise CH4 below 400°C are 344
critical to the exploitation of NG as a transport fuel to reduce GHG emissions. 345
Both dual fuel platforms had higher PM mass emissions than their equivalent diesel 346
configurations in transient testing. Steady state testing revealed that PM mass emissions were 347
up to three times higher for dual fuel compared to diesel at high engine loads. While the 348
majority of previous studies report decreases in PM mass emissions for dual fuel compared to 349
diesel combustion21, Papagiannakis et al.40 reported an increase in soot opacity at high engine 350
loads (80%) and ESR in the range of 30-50%. It is possible that this phenomena occurs due to 351
the greater likelihood of rich combustion as a result of high diesel and NG flow rates during 352
high engine load conditions. PM mass emissions were up to 50% lower at low engine loads, 353
which is more consistent with existing literature and is attributable to the lower sooting 354
tendency of premixed combustion of CH4 compared to diffusion mode combustion of 355
diesel21. 356
18
Results for tailpipe NOx emissions suggest that the change in exhaust gas composition in dual 357
fuel operation could interfere with the efficacy of the OEM SCR system, which is optimised 358
for diesel operation. Post-turbo and tailpipe exhaust gas temperatures (shown in the SI) are 359
generally higher in the transient dual fuel tests compared to diesel, which may result from 360
heat release via combustion of unburned hydrocarbons over the oxidation catalyst. At higher 361
exhaust gas temperatures and higher NO2/NOx ratios the conditions in the SCR may be 362
significantly different when the trucks are in dual fuel mode compared to diesel, thus 363
affecting its performance41. Higher N2O emissions for the dual fuel tests compared to diesel 364
tests could be due to (i) higher rates of oxidation of ammonia to N2O by NO2 potentially 365
caused by higher NO2/NOx ratios at temperatures up to 350°C42, (ii) direct oxidation of 366
ammonia by oxygen to N2O at temperatures above 350°C43 or (iii) by thermal decomposition 367
of ammonium nitrate44,45. 368
5 Acknowledgements
369
The authors would like to acknowledge support from the UK Engineering and Physical 370
Sciences Research Council (EP/K00915X/1), the UK Department for Transport, the Office 371
for Low Emission Vehicles and Innovate UK (project reference: 400266) and the industrial 372
partners of the Centre for Sustainable Road Freight. 373
6 Supporting information
374
Additional details describing experimental methods, supplemental results and an uncertainty 375
analysis are included in the Supporting Information (SI). This information is available free of 376
charge via the Internet at http://pubs.acs.org. 377
7 Nomenclature
378
𝜌0 Material density (g/cm3)
𝜌eff Effective density (g/cm3)
AR5 IPCC’s Fourth Assessment Report AR5 IPCC’s Fifth Assessment Report
19
C Combined phases of FIGE drive-cycle CO2e Carbon dioxide equivalent
𝐷m Mass-mobility exponent
𝑑p Particle mobility diameter (nm)
𝑑pp Primary particle diameter (nm) ESR Energy substitution ratio (%)
ETC European transient cycle developed by the FIGE institute FTIR Fourier transform infrared spectroscopy
GHG Greenhouse gas
GWP Global warming potential
HC Unburned hydrocarbons
HGV Heavy goods vehicle
HPDI High-pressure direct injection IPSD Integrated particle size distribution LCV Lower (net) calorific value
LNG Liquefied natural gas
M Motorway (highway) phase of FIGE drive-cycle
𝑚̇CH4,in Mass flow rate of CH4 supplied to the engine (kg/s)
𝑚̇CH4,tailpipe Mass flow rate of CH4 exhausted at the tailpipe (kg/s)
𝑚̇diesel,in Mass flow rate of diesel supplied to the engine (kg/s)
20
NG Natural gas
OEM Original equipment manufacturer
PM Particulate matter
PMP Particle Measurement Programme
PN Particle number
PT Post-turbo (emissions sampling point)
U Urban phase of FIGE drive-cycle
R Rural phase of FIGE drive-cycle
rpm Revolutions per minute
SCR Selective catalytic reduction
T Temperature (°C)
8 References
379
(1) International Energy Agency. Energy Technology Perspectives 2012. Pathways to a
380
Clean Energy System., 2nd ed.; IEA Publications: Paris, France, 2012.
381
(2) Department of Energy & Climate Change. Energy Consumption in the UK (ECUK) 382
Transport data tables 2015 Update https://www.gov.uk/government/statistics/energy-383
consumption-in-the-uk (accessed Aug 6, 2015). 384
(3) Department of Energy & Climate Change. Final UK greenhouse gas emissions 385
national statistics: 1990-2013 https://www.gov.uk/government/statistics/final-uk-386
emissions-estimates (accessed Aug 6, 2015). 387
(4) Ricardo-AEA. Opportunities to overcome the barriers to uptake of low emission
388
technologies for each commercial vehicle duty cycle; London, UK, 2012.
389
(5) Atkins - Cenex. Low Carbon Truck and Refuelling Infrastructure Demonstration Trial
390
Evaluation. Second Annual Report to the DfT. Executive Summary for publication.;
391
2015. 392
(6) European Commission. European Commission : CORDIS : Projects & Results 393
Service : LNG-BC: Liquefied Natural Gas Blue Corridors 394
http://cordis.europa.eu/project/rcn/198035_en.html (accessed Aug 6, 2015). 395
(7) US EPA. Alternative Fuel Conversion 396
http://www.epa.gov/otaq/consumer/fuels/altfuels/altfuels.htm#4 (accessed Aug 6, 397
2015). 398
21
(8) Karim, G. A. A review of combustion processes in the dual fuel engine—The gas 399
diesel engine. Prog. Energy Combust. Sci.1980, 6 (3), 277–285. 400
(9) Souto, J.; Ferrera, M.; Leclerq, N.; Matchett, M.; Magnusson, I. LNG Blue Corridors:
401
LNG Trucks Euro V technical solutions; GC.SST.2012.2-3 GA No. 321592, 2014.
402
(10) Volvo Trucks. Volvo FM MethaneDiesel 403
http://www.volvotrucks.com/trucks/global/en-gb/trucks/new-trucks/Pages/volvo-fm-404
methanediesel.aspx (accessed Jun 3, 2015). 405
(11) Prins Autogas UK Ltd. Prins Autogas UK: Dieselblend System 406
http://www.prinsautogasuk.co.uk/dieselblend.php (accessed Jun 3, 2015). 407
(12) Clean Air Power. Clean Air Power: How it works 408
http://www.cleanairpower.com/howitworks.html (accessed Jun 3, 2015). 409
(13) McTaggart-Cowan, G. P.; Bushe, W. K.; Hill, P. G.; Munshi, S. R. A supercharged 410
heavy-duty diesel single-cylinder research engine for high-pressure direct injection of 411
natural gas. Int. J. Engine Res.2003, 4 (4), 315–330. 412
(14) Karim, G. A. Combustion in Gas Fueled Compression: Ignition Engines of the Dual 413
Fuel Type. J. Eng. Gas Turbines Power2003, 125 (3), 827. 414
(15) Stewart, J.; Clarke, A.; Chen, R. An experimental study of the dual-fuel performance 415
of a small compression ignition diesel engine operating with three gaseous fuels. Proc.
416
Inst. Mech. Eng. Part D J. Automob. Eng.2007, 221 (8), 943–956.
417
(16) Polk, A. C.; Gibson, C. M.; Shoemaker, N. T.; Srinivasan, K. K.; Krishnan, S. R. 418
Detailed characterization of diesel-ignited propane and methane dual-fuel combustion 419
in a turbocharged direct-injection diesel engine. Proc. Inst. Mech. Eng. Part D J.
420
Automob. Eng.2013, 227 (9), 1255–1272.
421
(17) Gatts, T.; Liu, S.; Liew, C.; Ralston, B.; Bell, C.; Li, H. An experimental investigation 422
of incomplete combustion of gaseous fuels of a heavy-duty diesel engine 423
supplemented with hydrogen and natural gas. Int. J. Hydrogen Energy2012, 37 (9), 424
7848–7859. 425
(18) Besch, M. C.; Israel, J.; Thiruvengadam, A.; Kappanna, H.; Carder, D. Emissions 426
Characterization from Different Technology Heavy-Duty Engines Retrofitted for 427
CNG/Diesel Dual-Fuel Operation. SAE Int. J. Engines2015, 8 (3), 2015–01 – 1085. 428
(19) Papagiannakis, R. G.; Rakopoulos, C. D.; Hountalas, D. T.; Rakopoulos, D. C. 429
Emission characteristics of high speed, dual fuel, compression ignition engine 430
operating in a wide range of natural gas/diesel fuel proportions. Fuel2010, 89 (7), 431
1397–1406. 432
(20) Papagiannakis, R. G.; Hountalas, D. T. Combustion and exhaust emission 433
characteristics of a dual fuel compression ignition engine operated with pilot Diesel 434
fuel and natural gas. Energy Convers. Manag.2004, 45 (18-19), 2971–2987. 435
(21) Wei, L.; Geng, P. A review on natural gas/diesel dual fuel combustion, emissions and 436
performance. Fuel Process. Technol.2016, 142, 264–278. 437
(22) Rimmer, J. E.; Johnson, S. L.; Clarke, A. An experimental study into the effect of the 438
pilot injection timing on the performance and emissions of a high-speed common-rail 439
dual-fuel engine. Proc. Inst. Mech. Eng. Part D J. Automob. Eng.2014, 228 (8), 929– 440
942. 441
(23) Sun, L.; Liu, Y.; Zeng, K.; Yang, R.; Hang, Z. Combustion performance and stability 442
of a dual-fuel diesel-natural-gas engine. Proc. Inst. Mech. Eng. Part D J. Automob.
22
Eng.2014, 229 (2), 235–246. 444
(24) Gatts, T.; Liu, S.; Liew, C.; Ralston, B.; Bell, C.; Li, H. An experimental investigation 445
of incomplete combustion of gaseous fuels of a heavy-duty diesel engine 446
supplemented with hydrogen and natural gas. Int. J. Hydrogen Energy2012, 37 (9), 447
7848–7859. 448
(25) Graves, B.; Olfert, J.; Patychuk, B.; Dastanpour, R.; Rogak, S. Characterization of 449
Particulate Matter Morphology and Volatility from a Compression-Ignition Natural-450
Gas Direct-Injection Engine. Aerosol Sci. Technol.2015, 49 (8), 589–598. 451
(26) Barlow, T. J.; Latham, S.; McCrae, I. S.; Boulter, P. G. A reference book of driving
452
cycles for use in the measurement of road vehicle emissions; 2009.
453
(27) Hunt, S. W.; Odhams, A. M. C.; Roebuck, R. L.; Cebon, D. Parameter measurement 454
for heavy-vehicle fuel consumption modelling. Proc. Inst. Mech. Eng. Part D J.
455
Automob. Eng.2011, 225 (5), 567–589.
456
(28) European Union. Directive 1999/96/EC of the European Parliament and of the
457
Council of 13 December 1999 on the approximation of the laws of the Member States
458
relating to measures to be taken against the emission of gaseous pollutants from
459
positive ignition engines fuelled; Official Journal of the European Communities L 44,
460
1999; p L 44/1 – L 44/155. 461
(29) United Nations Economic Commission for Europe (UNECE). Global technical
462
regulation No. 4. Test procedure for compression ignition (C.I.) engines and positive
463
ignition (P.I.) engines fuelled with natural gas (NG) or liquefied petroleum gas (LPG)
464
with regard to the emission of pollutants; ECE/TRANS/180/Add.4, 2007.
465
(30) Maricq, M. M.; Xu, N. The effective density and fractal dimension of soot particles 466
from premixed flames and motor vehicle exhaust. J. Aerosol Sci.2004, 35 (10), 1251– 467
1274. 468
(31) Liu, Z. G.; Vasys, V. N.; Dettmann, M. E.; Schauer, J. J.; Kittelson, D. B.; Swanson, J. 469
Comparison of Strategies for the Measurement of Mass Emissions from Diesel 470
Engines Emitting Ultra-Low Levels of Particulate Matter. Aerosol Sci. Technol.2009, 471
43 (11), 1142–1152. 472
(32) Zheng, Z.; Durbin, T. D.; Xue, J.; Johnson, K. C.; Li, Y.; Hu, S.; Huai, T.; Ayala, A.; 473
Kittelson, D. B.; Jung, H. S. Comparison of particle mass and solid particle number 474
(SPN) emissions from a heavy-duty diesel vehicle under on-road driving conditions 475
and a standard testing cycle. Environ. Sci. Technol.2014, 48 (3), 1779–1786. 476
(33) Mertes, S.; Schröder, F.; Wiedensohler, A. The Particle Detection Efficiency Curve of 477
the TSI-3010 CPC as a Function of the Temperature Difference between Saturator and 478
Condenser. Aerosol Sci. Technol.1995, 23 (2), 257–261. 479
(34) Giechaskiel, B.; Wang, X.; Horn, H.-G.; Spielvogel, J.; Gerhart, C.; Southgate, J.; Jing, 480
L.; Kasper, M.; Drossinos, Y.; Krasenbrink, A. Calibration of Condensation Particle 481
Counters for Legislated Vehicle Number Emission Measurements. Aerosol Sci.
482
Technol.2009, 43 (12), 1164–1173.
483
(35) Giechaskiel, B.; Maricq, M.; Ntziachristos, L.; Dardiotis, C.; Wang, X.; Axmann, H.; 484
Bergmann, A.; Schindler, W. Review of motor vehicle particulate emissions sampling 485
and measurement: From smoke and filter mass to particle number. J. Aerosol Sci.
486
2014, 67, 48–86. 487
(36) Myhre, G.; Shindell, D.; Breon, F.-M.; Collins, W.; Fuglestvedt, J.; Huang, J.; Koch, 488
23
D.; Lamarque, J.-F.; Lee, D.; Mendoza, B.; et al. Anthropogenic and Natural Radiative 489
Forcing. In Climate Change 2013: The Physical Science Basis. Contribution of
490
Working Group I to the Fifth Assessment Report of the Intergovernmental Panel on
491
Climate Change.; Stocker, T. F., Qin, D., Plattner, G.-K., Tignor, M., Allen, S. K.,
492
Boschung, J., Nauels, A., Xia, Y., Bex, V., Midgley, P. M., Eds.; Cambridge 493
University Press: Cambridge, UK and New York, NY, USA, 2013. 494
(37) Gélin, P.; Primet, M. Complete oxidation of methane at low temperature over noble 495
metal based catalysts: a review. Appl. Catal. B Environ.2002, 39 (1), 1–37. 496
(38) Dronniou, N.; Kashdan, J.; Lecointe, B.; Sauve, K.; Soleri, D. Optical Investigation of 497
Dual-fuel CNG/Diesel Combustion Strategies to Reduce CO 2 Emissions. SAE Int. J.
498
Engines2014, 7 (2), 873–887.
499
(39) Cargnello, M.; Delgado Jaén, J. J.; Hernández Garrido, J. C.; Bakhmutsky, K.; 500
Montini, T.; Calvino Gámez, J. J.; Gorte, R. J.; Fornasiero, P. Exceptional activity for 501
methane combustion over modular Pd@CeO2 subunits on functionalized Al2O3. 502
Science2012, 337 (6095), 713–717.
503
(40) Papagiannakis, R. G.; Hountalas, D. T. Experimental investigation concerning the 504
effect of natural gas percentage on performance and emissions of a DI dual fuel diesel 505
engine. Appl. Therm. Eng.2003, 23 (3), 353–365. 506
(41) Koebel, M.; Elsener, M.; Kleemann, M. Urea-SCR: a promising technique to reduce 507
NOx emissions from automotive diesel engines. Catal. Today2000, 59 (3-4), 335–345. 508
(42) Devadas, M.; Krocher, O.; Elsener, M.; Wokaun, A.; Soger, N.; Pfeifer, M.; Demel, 509
Y.; Mussmass, L. Influence of NO2 on the selective catalytic reduction of NO with 510
ammonia over Fe-ZSM5. Appl. Catal. B Environ.2006, 67 (3-4), 187–196. 511
(43) Madia, G.; Koebel, M.; Elsener, M.; Wokaun, A. Side Reactions in the Selective 512
Catalytic Reduction of NO x with Various NO 2 Fractions. Ind. Eng. Chem. Res.2002, 513
41 (16), 4008–4015. 514
(44) Grossale, A.; Nova, I.; Tronconi, E.; Chatterjee, D.; Weibel, M. The chemistry of the 515
NO/NO2–NH3 “fast” SCR reaction over Fe-ZSM5 investigated by transient reaction 516
analysis. J. Catal.2008, 256 (2), 312–322. 517
(45) Grossale, A.; Nova, I.; Tronconi, E.; Chatterjee, D.; Weibel, M. NH3–NO/NO2 SCR 518
for Diesel Exhausts Aftertreatment: Reactivity, Mechanism and Kinetic Modelling of 519
Commercial Fe- and Cu-Promoted Zeolite Catalysts. Top. Catal.2009, 52 (13-20), 520
1837–1841. 521