i
Three Essays on Derivatives Markets
Qianyin Shan
A Thesis
In
The John Molson School of Business
Presented in Partial Fulfillment of the Requirements
For the Degree of
Doctor of Philosophy (Business Administration) at
Concordia University
Montreal, Quebec, Canada
May, 2014
ii
CONCORDIA UNIVERSITY SCHOOL OF GRADUATE STUDIES This is to certify that the thesis prepared
By: Qianyin Shan
Entitled: Three Essays on Derivatives Markets
and submitted in partial fulfillment of the requirements for the degree of PhD in Business Administration – Finance Specialization
complies with the regulations of the University and meets the accepted standards with respect to originality and quality.
Signed by the final examining committee:
Dr. Iraj Fooladi External Examiner
Dr. Bryan Campbell External to Program
Dr. Michele Breton Examiner
Dr. Stylianos Perrakis Examiner
Dr. Lorne N. Switzer Thesis Supervisor
Approved by
Chair of Department or Graduate Program Director
May 28, 2014
iii
ABSTRACT
Three Essays on Derivatives Markets
Qianyin Shan, Ph.D.
Concordia University, 2014
This thesis consists of three essays. The first essay (chapter two) looks at the impact of derivatives regulation on liquidity and mispricing of US derivatives markets. In particular, we test the hypothesis that Dodd Frank derivative provisions may improve the efficiency of the exchange traded markets due to an increase of arbitrage by traders on the exchange traded markets, as opposed to the OTC markets. We examine the impact of key Dodd Frank events on market activity for financial derivatives (futures and option contracts on US T bonds, Eurodollar futures and options, and S&P 500 Futures contracts) and on foreign exchange derivatives (futures and options contracts on EUROs, British Pounds, and Canadian dollars). First, we look at how liquidity on the markets has been affected. Next, we test for mispricing of derivatives contracts. We find that measured liquidity does fall for US financial futures and options but rises for foreign exchange futures and options subsequent to the introduction of the Treasury guidelines for OTC trading. We also find that the efficiency of the U.S. exchange traded futures markets has improved, as reflected by a reduction in mispricing in the S&P futures contracts; some improvement in pricing efficiency is also shown for nearby Eurodollar futures contracts. These results are consistent with an increase of arbitrage by
iv
traders on the exchange traded markets, as opposed to the OTC markets, in contrast to the “noise” model.
The second essay (chapter three) provides a description and comparison between OTC and exchange-traded derivatives market activity. It compares the turnover in OTC derivatives among three regions: Americas, Europe, and Asia/Pacific. Similar analysis is also conducted for non-financial customers. The empirical results show that the growth rate of exchange-traded derivatives leads growth rate of OTC derivatives. The conclusion still holds for derivatives of different risk categories.
The third essay (chapter four) examines the futures market efficiency of the VIX and the relative merits of the VIX and VIX futures contracts in forecasting future S&P 500 excess returns the future Russell 2000 excess returns, and the future small-cap premium. We find that the current VIX is significantly negatively related to S&P 500 index excess returns and positively related to the Russell 2000 index excess returns. These results suggest that the VIX predicts asset returns based on size based portfolios asymmetrically – with higher (lower) values of the VIX associated with lower (higher) values of small-cap (large cap) returns in the future. However, the VIX and VIX modeled by an ARIMA process are not significantly related to future values of the small-cap premium. In contrast, VIX futures show forecasting prowess for the S&P 500 excess return, the Russell 2000 excess return and the small-cap premium. VIX futures are significantly negatively related to these series. The results for the speculative efficiency of the VIX futures contracts are mixed, however. Overall, the analyses support the hypothesis of informational advantages of the futures markets relative to the spot market in the price discovery process not just for size based asset returns, but on the size premium as well.
v
ACKNOWLEDGEMENTS
I would like to express my appreciation to my major supervisor, Dr. Lorne N. Switzer, for his guidance and support. I would also like to thank my other committee members, Dr. Stylianos Perrakis, Dr. Michele Breton, Dr. Bryan Campbell, and Dr. Iraj Fooladi for their suggestions and support.
I would like to thank my Ph.D. colleagues and all the friends in Montreal for their friendship and support.
I would like to dedicate this thesis to my family back in China for their encouragement and support.
vi
TABLE OF CONTENTS
CHAPTER ONE
1
INTRODUCTION
1
CHAPTER TWO
3
IMPACT OF DERIVATIVES REGULATIONS ON THE LIQUIDITY AND PRICING EFFICIENCY OF EXCHANGE TRADED DERIVATIVES
3
2.1 INTRODUCTION
3
2.2 DODD-FRANK AND THE LIQUIDITY OF DERIVATIVES MARKETS
4
2.2.1 Data Description
8
2.2.2 Empirical Results and Discussion
9
2.3 THE IMPACT OF DODD-FRANK ON MISPRICING OF S&P FUTURES CONTRACTS
12
2.3.1 Empirical Modeling
13
2.3.2 Data Description14
2.3.3 Empirical Results14
2.4 DODD-FRANK AND THE DEVIATIONS OF EURODOLLAR FUTURES VS.FORWARD CONTRACTS
16
2.4.1 Data Description
16
2.4.2 Empirical Modeling for Forward and Futures Rates16
vii
2.4.3 Empirical Results
18
2.5 SUMMARY AND CONCLUSIONS
19
CHAPTER THREE
22
POSITION GROWTH RATE INTERACTIONS BETWEEN EXCHANGE TRADED DERIVATIVES AND OTC DERIVATIVES
22
3.1 INTRODUCTION22
3.2 GENERALIZATION OF OTC DERIVATIVES MARKET ACTIVITY
25
3.2.1 Notional Amounts Outstanding for OTC Derivatives
25
3.2.2 Gross Market Values for OTC Derivatives
27
3.2.3 Turnover for OTC Derivatives
28
3.3 INTERACTION BETWEEN OTC AND EXCHANGE TRADED DERIVATIVES
31
3.3.1 Data Description31
3.3.2 Methodology and Empirical Results
32
3.4 GENERALIZATION OF OTC DERIVATIVES BY USING NON-FINANCIAL CUSTOMERS AS COUNTERPARTIES
36
3.4.1 Notional Amounts Outstanding for Non-Financial Reporters36
3.4.2 Gross Market Values for Non-Financial Reporters
37
3.4.3 Turnover for Non-Financial Reporters
38
viii
CHAPTER FOUR
40
VOLATILITY, THE SIZE PREMIUM, AND THE INFORMATION QUALITY OF THE VIX: NEW EVIDENCE
40
4.1 INTRODUCTION40
4.2 METHODOLOGY
42
4.3 DATA DESCRIPTION
44
4.4 FORECAST PERFORMANCE OF THE VIX FOR LARGE-CAP AND SMALL-CAP RETURNS AND THE SMALL-SMALL-CAP PREMIUM
46
4.5 TESTING EFFICIENCY OF VIX FUTURES49
4.5.1 Testing Speculative Market Efficiency
49
4.5.2 Testing Efficiency of VIX Futures
51
4.6 SUMMARY
53
REFERENCES
54
ix
LIST OF TABLES AND FIGURES
Table 2.1. Open Interest Regressions for Futures Contracts
61
Table 2.2. Open Interest Regressions for Call Options
64
Table 2.3. Open Interest Regressions for Put Options
67
Table 2.4. Mispricing Series for S&P 500 Futures February 2004- August 2012 Pre vs. Post OTC Guidelines
70
Table 2.5. Estimates of S&P 500 Daily Futures Mispricing71
Table 2.6. Futures-Forward Yield Differences – with Treasury Date Breakpoint
72
Table 2.7. Futures-Forward Yield Differences – with Conference Date Breakpoint
73
Table 3.1. Global Positions in (Notional Amounts Outstanding) OTC Derivatives Markets by Type of Instrument
74
Table 3.2. Global Positions in (Gross Market Values) OTC Derivatives Markets by Type of Instrument75
Table 3.3. Global OTC derivatives market turnover76
Table 3.4. Geographical distribution of reported OTC derivatives market activity
77
Table 3.5. Data Descriptive Statistics
78
Table 3.6. Contemporaneous Correlation between Series
79
Table 3.7. Unit Root Tests
80
x
Table 3.9: Bootstrapped Wald Statistics for the Pair-Wise Causality Regressions Table 3.10. Amounts Outstanding of OTC Foreign Exchange and Interest Rate
Derivatives with Non-Financial Customers
84
86
Table 3.11. Gross Market Values of OTC Foreign Exchange and Interest Rate
Derivatives with Non-Financial Customers
87
Table 3.12. Geographical distribution of reported OTC derivatives market activity
with non-financial customers
88
Table 4.1. Descriptive Statistics
89
Table 4.2. Estimation results for small cap size premium with squared current VIX90
Table 4.3. Estimation results for small cap size premium with squared VIX modeled
by ARMA (5, 3) process
91
Table 4.4. Estimation results for small cap size premium without VIX
92
Table 4.5. Estimation results for S&P 500 index excess return with squared currentVIX
93
Table 4.6. Estimation results for S&P 500 index excess return with squared VIX
modeled by ARMA (5, 3) process
94
Table 4.7. Estimation results for S&P 500 index excess return without VIX
95
Table 4.8. Estimation results for Russell 2000 index excess return with squared currentVIX
96
Table 4.9. Estimation results for Russell 2000 index excess return with squared VIX
modeled by ARMA (5, 3) process
97
xi
Table 4.11. Unit Root Test Statistics for Series
99
Table 4.12. Results of Fama (1984) model
100
Table 4.13. Wald test results of Fama (1984) model
101
Table 4.14. VIX futures contracts as predictors of futures spot VIX: daily data
102
Table 4.15. Estimation results for future small cap size premium with squared current VIX futures price
103
Table 4.16. Estimation results for future S&P 500 index excess return with squared current VIX futures price104
Table 4.17. Estimation results for future Russell 2000 index excess return with squared current VIX futures price105
Table 4.18. Estimation results for small cap size premium, S&P 500 index excess return, and Russell 2000 index excess return with lagged squared VIX futures prices (monthly basis)106
Figure 2.1. Mispricing of S&P 500 Futures-Pre vs. Post Dodd Frank107
Figure 4.1. Small Cap Premium and VIX: weekly data
108
1
CHAPTER 1
INTRODUCTION
My dissertation explores the impact of derivatives regulations on the exchange traded derivatives by examining the market liquidity and price discovery efficiency pre and post the events surrounding key Dodd Frank regulations. The interactions of position growth rates between exchange traded derivatives and OTC derivatives across different risk categories are studied. It also examines the futures market efficiency of the VIX and the relative merits of the VIX and VIX futures contracts in forecasting not only future size based asset returns, but future size premium as well.
As a response to the late 2000s recession, the Dodd-Frank Wall Street Reform and Consumer Protection Act was passed by the United States government. It brought the most significant changes to financial regulation in the U.S. The section 13 of the Bank Holding Company Act (the “Volcker Rule”) prohibits any banking entity from engaging in proprietary trading. This type of trading activity includes the buying and selling of securities, derivatives, bonds or other financial products to earn returns. Banks involved in proprietary trading are acting like hedge funds in seeking high returns on investments. Financial firms will need to create comprehensive record-keeping and reporting systems to provide both company-wide and segment-specific trading and financial data to comply with the regulations, which have not been finalized. A variety of critics have attacked the law. One of the criticisms is the uncertainty of its provisions. My first essay studies how the regulatory changes can affect the behaviour of market participants by examining the liquidity of US financial derivatives markets and pricing efficiency of the US exchange traded futures markets.
2
Trades in the OTC derivatives market are typically much larger than trades in the exchange-traded derivatives market. In the OTC derivatives market, dealers negotiate directly with each other to tailor the amount and expiration date to their own needs. There is no exchange or central clearing house to support the OTC transactions. Therefore, each counterparty takes the credit risk that the contract might not be honoured. In the exchange-traded derivatives market, the contracts are highly liquid with standardized unit size and fixed expiration date. The execution of the contract is guaranteed by marking to market mechanism. According to the triennial global central bank surveys of foreign exchange and derivatives market activity by Bank for International settlements, growth in the notional amounts outstanding in OTC derivatives market and exchange-traded derivatives market has been rapid. My second essay examines the interaction between the growth rates of positions between these two markets across different risk categories.
Substantial work has tested the relationship between volatility and returns with mixed results. Most of them focus on the contemporaneous relationship between realized volatility and the risk premium. Since 2000, economically and statistically significant abnormal performance is observed for small cap stocks in the United States and Canada. The riskiness of the market might explain the differential performance for size based asset portfolios. We hypothesize that VIX may contain information in forecasting future portfolio returns. My third essay examines the futures market efficiency of the VIX and the information quality of the VIX and VIX futures in forecasting future size based portfolio excess returns and small-cap premium.
3
CHAPTER TWO
IMPACT OF DERIVATIVES REGULATIONS ON THE LIQUIDITY OF
EXCHANGED TRADED DERIVATIVES
2.1 INTRODUCTION
The financial crisis has given rise to increased regulatory activism around the world. In the United States, policy makers responded to widespread calls for regulatory reform to address perceived supervisory deficiencies with the Dodd-Frank Wall Street Reform and Consumer Protection Act (Dodd-Frank). One of the criticisms of Dodd-Frank is that the uncertainty of its provisions, such as section 13 of the Bank Holding Company Act (the “Volker Rule”), will increase volatility and adversely affect market efficiency. Some commentators, for example Greenspan (2011) and Duffie (2012), have suggested that Dodd-Frank will have undesirable implications to the markets in general, by lowering the quality of information about fundamentals, which would reduce efficient price discovery as well as through a reduction of liquidity. However, this may be offset through a migration of market making and investment activities to other trading venues. Duffie (2012) discusses problems associated with migration to non-bank firms such as hedge funds and insurance companies. We look at the implications of another possible conduit for trade migration: the redirection
of trades from the OTC markets to that of exchange traded derivatives. Such a redirection
could be expected to the extent that the exchange traded markets substitute for the OTC markets (see e.g. Switzer and Fan (2007)). A migration from the OTC markets that increases
4
activity in exchange traded derivatives in general, which benefit from volatility, might be posited to improve the efficiency of the latter.
How regulatory changes per se affect market liquidity and efficiency remain open questions in the literature. The events surrounding key Dodd Frank regulations provide a useful setting to add to the literature on how the regulatory process can affect the behavior of market participants, as reflected in trading volume or open interest and efficient pricing of exchange traded derivatives. The remainder of this paper is organized as follows. In the next section, we look at the impact of key Dodd Frank event dates on the liquidity of US financial derivatives markets. In section 2.3 we look at pricing efficiency based on the cost-of carry for S&P futures contracts. In section 2.4, we look at deviations of futures from implied forward prices for Eurodollar contracts. The paper concludes with a summary in section 2.5.
2.2 DODD-FRANK AND THE LIQUIDITY OF DERIVATIVES MARKETS
In this section, we look at the impact of Dodd Frank on the liquidity US derivatives markets. A key driver in previous studies of market liquidity is volatility, which as mentioned previously, might be expected to increase, given the uncertainty in the implementation of Dodd-Frank regulations. Clark (1973) asserts that an unobservable factor that reflects new information arrival affects both volume and volatility. Tauchen and Pitts (1983) propose two theoretical explanations for the co-movement of volatility and trade volume in markets. Chen, Cuny, and Haugen (1995) examine how volatility affects the basis and open interest of stock index futures. When examining the relationship between volatility and open interest, they include lags of the open interest variable to take into account the time-series behavior of open interest and find that much of today’s open interest comes from the
5
“carry over” from yesterday’s open interest. In their model, an increase in volatility entices more traders into the market to share the risk. Rather than reducing risk exposure through selling stocks, investors take advantage of the derivatives markets –e.g. they share risk by selling the S&P 500 futures, which causes open interest to increase. Their results are consistent with this model. When there is a large positive shift in volatility, a strong positive relation between volatility and open interest is observed. Bhargava and Malhotra (2007) use both volume and open interest to distinguish between speculators and hedgers. They examine the relationship between trading activity in foreign currency futures and exchange rate volatility. They find that speculators and day traders destabilize the market for futures with lower demand for futures in response to increased volatility. Whether hedgers stabilize or destabilize the market is inconclusive since the demand from hedgers shows mixed results.
Our model re-examines the linkages for volume and volatility extending the Chen, Cuny, and Haugen (1995) and Bhargava and Malhotra (2007) studies using more recent data. We also incorporate structural shifts associated with key Dodd Frank announcement days for a wider variety of derivative products into the models. We look at financial derivatives: futures and option contracts on US T bonds and Eurodollars as well as S&P 500 futures contracts. We also look at foreign exchange derivatives: futures and options contracts on EUROs, British Pounds, and Canadian Dollars. Our objective is to look at a full range of market derivative products as they might be affected by Dodd-Frank. We chose to look at the derivative products separately, which allows us to abstract from possible distortionary effects that may affect specific instruments. For example futures contracts would not be subject to “moneyness” biases such as are typically found in exchange traded options.
6
The basic regression of open interest extends Chen, Cuny, and Haugan (1995) and Bhargava and Malhotra (2007) and is as follows:
0 1 2
t t t t
OpenInterest HistoricalVar DoddFrank (2.1)
where OpenInterest is the sum of open interest across the relevant contracts, and
HistoricalVar is the historical variance of the underlying asset. DoddFrank is a dummy variable equal to one at the date of and subsequent to three “watershed” Dodd-Frank announcement dates1. We use open interest, rather than trading volume as our measure of liquidity to capture how restrictions on OTC markets entice new participants to migrate to the exchange traded markets. This is in the same spirit as Chen, Cuny and Haugen (1995) who focus on the role of volatility in inducing new market participants. Using volume as a measure of liquidity would not necessarily capture market migration effects. Trading volume could increase in a market due to entry or exit, which would not allow us to isolate the direction of the migration effect. The selection of key announcement dates involved the consideration of a number of issues relevant to testing for the impact of financial regulations. First, we wanted to ensure that the announcement dates do not coincide with any other major regulatory announcements, or financial industry specific announcements. In addition, we wanted to identify major events in which specific measures by which regulatory intent will be implemented. Dodd-Frank follows standard procedure in the development of US financial regulation: its promulgation is a consideration for politicians, while its implementation is the
1
The Dodd-Frank dummy variables are equal to one beginning on the date of each announcement until the end of the sample period. This allows us to test if the announcements have separate effects, as well as to identify when the Dodd-Frank measures get imparted into the markets. For example, if each of the breakpoint dummy variables is significant, this would suggest that Dodd-Frank is a continuous process with distinct episodes.
7
responsibility of the regulatory agencies mandated by the legislation itself (Fullenkamp and Sharma (2012)). As a result one must draw a distinction between regulatory events relating to Dodd-Frank, which we will refer to as “mandates”, i.e. those which specify what regulatory deficiency is to be addressed and by whom, versus “implementation” related events which specify actions which will be taken, or specify measures to be included in rules enforced by regulators. We choose as announcement events” implementation” date events, since they are most relevant to market participants.
Our first event occurs on August 11, 2009, when the Treasury formally submitted to Congress, a “Proposed OTC Derivatives Act” which, called for central clearing and more strict oversight of OTC markets through stricter recordkeeping and data-reporting requirements. In addition, the Treasury proposal outlined the need for greater capital and margin requirements for OTC market participants, with the intention of increasing the overall stability of the financial system. This event represents an important moment in defining the shape of OTC legislation, and was the basis for much of what would later become the OTC portion of HR 4173 (the House version of what would later become Dodd-Frank). This proposal was highly implementation-related, and provided financial institutions around the world a foretaste of forthcoming OTC regulation, and the concomitant compliance costs.
The second selected event occurs on June 25, 2010 with the completion of the reconciliation of the House and Senate versions of the bill. By the afternoon of the 25th an outline of the final version of Dodd-Frank was released to the public. The implementation of the Act was widely expected to have a negative impact on the operation of many financial institutions. However, the impact of the announcement on the markets might be expected to be somewhat muted, given the advanced scrutiny of market participants of the House and
8
Senate proposals. Furthermore, many components of the reconciled version of the bill were considered as favorable news, since they were less harsh than initially proposed in the original House and Senate versions (Paletta, 2010.).
Our third selected event is October 6, 2011, which is the first trading day following the leak of a memorandum containing a draft of the Volcker Rule, ahead of the scheduled (October 11) FDIC conference (McGrane and Patterson (2011)). The Volcker Rule prohibits banks or institutions that own banks from engaging in proprietary trading on their own account – i.e. trading that that is not at the behest of clients. Furthermore, banks are proscribed from, owning or investing in hedge funds or private equity funds. From a financial economics perspective, the rule may seem to undermine market completeness, by potentially eliminating arbitrage activities by important financial agents. The Volker rule leak event is a surprise that contains salient material information that was confirmed at the formal release date. In an efficient market, one might expect the market response to this event subsumes the effects of the formal release date announcement. Switzer and Sheahan-Lee (2013) show that this is indeed the case in their study of bank stock price reactions to the Volker rule.
2.2.1 Data Description
Daily data of open interest for futures and options are collected from Bloomberg. The data cover the period from January 2007 to June 2012 (1436 observations). The underlying assets include Eurodollar, 10 year Treasury Bond, S&P 500, and three foreign currencies (the EUROs, the British Pounds, and the Canadian dollars). The variances are estimated by
9
historical 90 day and 10 day volatility of the underlying assets and are obtained from Bloomberg.
2.2.2 Empirical Results and Discussion
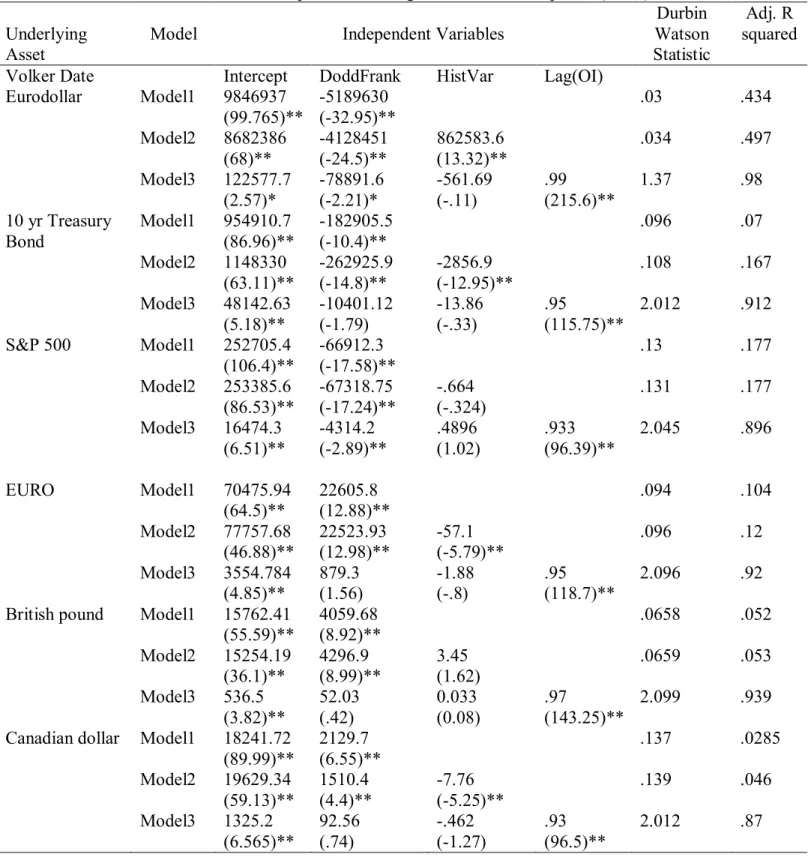
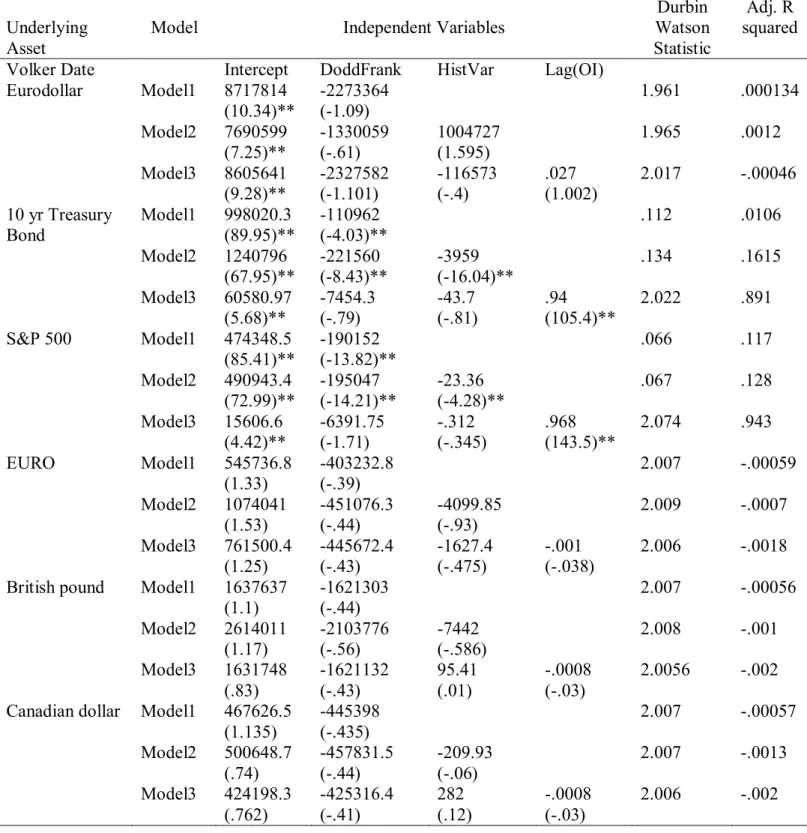
Table 2.1 below shows the estimation results for three variants of (2.1) for the futures contracts. The panels denoted: Treasury Date, Conference Date, and Volker Date provide the results when the Dodd-Frank announcement date is Aug.11, 2009, Jun.25, 2010, and Oct. 6, 2011, respectively.
Three variants of (2.1) are estimated: Model1:
0 1
t t t
OpenInterest DoddFrank (1a) Model 2:
0 1 2
t t t t
OpenInterest HistoricalVar DoddFrank (1b) Model3:
0 1 2 ( ) 3
t t t t
OpenInterest HistoricalVar Lag OI DoddFrank (1c)
[Please insert Table 2.1 about here]
On the whole, the results show some variation in the goodness of fit of the models across the different derivatives products examined, with better fits observed for the initial US treasury proposal on derivatives (August 11, 2009), so our discussion will focus on these results. Similar to Chen, Cuny, and Haugen (1995), we observe a positive effect of volatility on open interest for the S&P 500 futures contracts, when including lagged open interest in
10
the equation (Model 3). This is consistent with the hypothesis that market volatility helps to induce participation in the S&P 500 futures contracts. However the result is not statistically significant. In addition, it does not hold for the other futures contracts. On the contrary, volatility appears to reduce open interest for Eurodollar futures, T bond futures, and the three currencies examined.
The Dodd Frank structural breakpoints appear to be negatively associated with open interest, but only for the financial futures, i.e. Eurodollar futures contract, T-bond future contracts and the S&P futures contracts. However, this relationship is not significant for the Eurodollar contracts and the T-bond contracts.2 For two of the foreign currency futures contracts - the EUROs and British pounds, open interest actually increases significantly subsequent to Dodd-Frank dates. For the Canadian dollar futures contracts, the open interest enhancing effects of Dodd Frank are not significant, after taking into account historical
2 It may be the case that the Dodd Frank variable should not be expected to be the most significant factor underlying the secular decline in liquidity of the Eurodollar futures contract, which we further document in section 4 below. This decline may be related to other important but extraneous factors, including the extremely low Federal funds rate (approximately zero) since January 2009. This may explain why, as we show in Table 1, the Dodd-Frank dummy variable becomes insignificant when we include historical volatility and lagged open interest as regressors. Another extraneous factor that may be important is the impact of LIBOR manipulation (the LIBOR scandal). In this vein Park and Switzer (1995) document evidence of market manipulation through private information in LIBOR
settlement over the period June 1982-June 1992, many years before the formal exposure of the LIBOR scandal. If such manipulation is persistent through time, its effects along with any secular decline in open interest would be internalized in the lagged open interest variable, which is significant. We explore this issue further in section 4 below The first fines imposed concerning the LIBOR scandal occur on June 27, 2012 after our event date and estimation period date, when by Barclays Bank was fined $200 million by the Commodity Futures Trading Commission, $160 million by the United States Department of Justice and £59.5 million by the UK Financial Services Authority. Awareness of the breadth of the
11
volatility and lagged open interest effects. In sum, the results suggest that the assertion that Dodd-Frank has detrimental liquidity effects across all exchange traded derivatives products is not sustained.
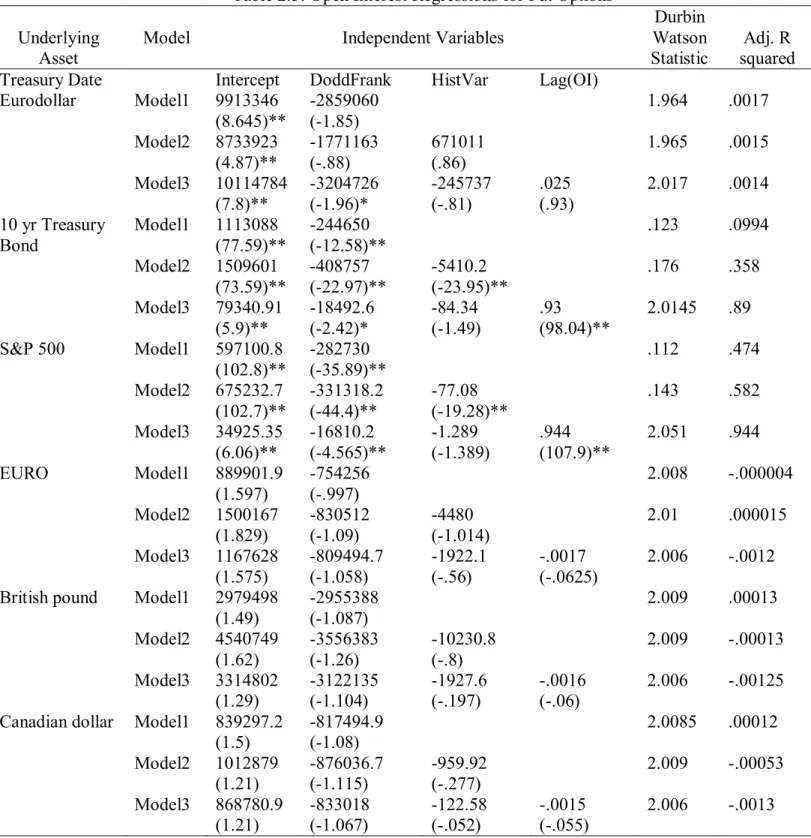
Table 2.2 provides the estimates of the open interest regressions for the call option contracts. The results for call options are for the most part, qualitatively similar to those of the futures contracts, with some exceptions. Historical volatility is positively associated with open interest for the S&P 500 contracts, as in Chen, Cuny, and Haugen (1995), but this effect is not significant when lagged open interest is included. Lagged open interest also appears to subsume volatility effects for the other contracts. Dodd-Frank dummy variables remain significantly negative, but only for the financial futures contracts. They are positive for the currency call options.
[Please insert Table 2.2 about here]
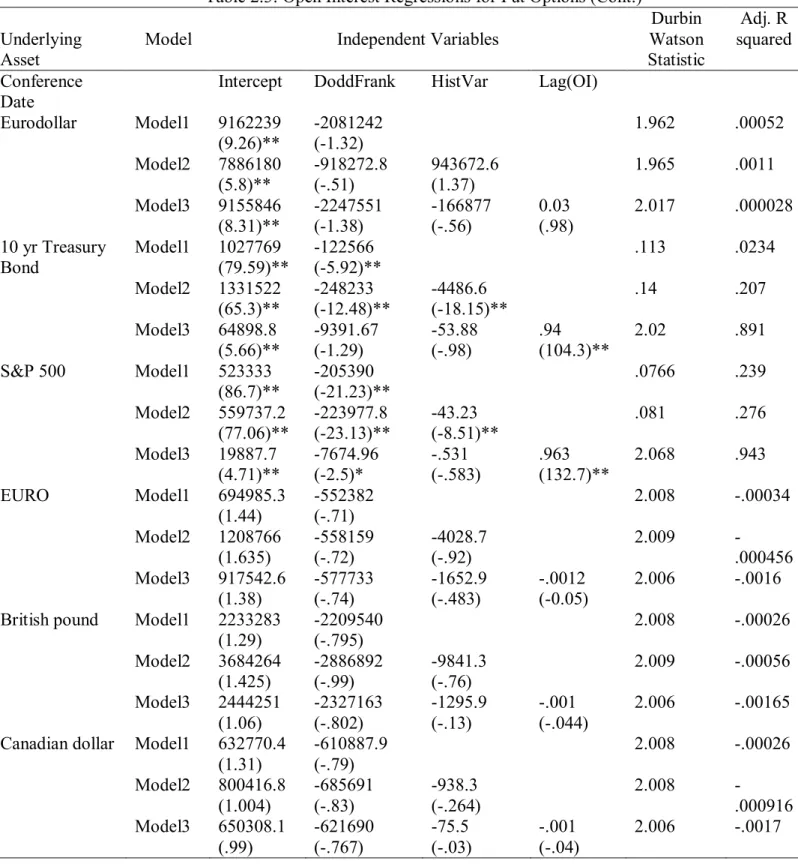
Table 2.3 provides the estimates of the Open Interest regressions for the Put Option contracts. The results differ for these contracts relative to the futures contracts and the call options contracts. In contrast with the call options, volatility has a negative effect on open interest, but similar to the call options regressions it is insignificant in the full model (Model 3) when lagged open interest is added as a regressor. Similar to the call options and futures contracts, the Dodd-Frank structural break points are associated with significantly declining open interest levels for the S&P futures and T-Bond futures contracts. However, the Dodd Frank dummy variables are not significant for any of the other market traded derivatives contracts.
12
To summarize, based on these results, measured liquidity does appear to fall for many US financial futures and options. Interestingly, the relationship is not significant for US T-bond futures or call options. This result may be due to expectations that T-bonds would be exempted from Dodd-Frank and the Volker rule. Such expectations have been justified by subsequent regulatory rulings. The significantly negative association of Dodd-Frank with the liquidity of the other financial derivative products is consistent with Duffie (2012). Increased liquidity of foreign currency derivatives, however, is not consistent with the fear expressed by Greenspan (2011), that “a significant proportion of the foreign exchange derivatives market would leave the US.” However, this result need not rule out increased participation in the US foreign exchange derivative markets due to planned migration of asset holders and investors to foreign venues in order to escape the regulatory tax (Houston, Lin, and Ma (2012)).
In the next section, we will examine the effects of Dodd Frank on the efficiency of exchange traded futures contracts.
2.3 THE IMPACT OF DODD FRANK ON MISPRICING OF S&P FUTURES CONTRACTS
In this section, we test the hypothesis that Dodd Frank derivative provisions may improve the efficiency of the exchange traded markets due to an increase of arbitrage by traders on the exchange traded markets, as opposed to the OTC markets. The alternative hypothesis is that Dodd-Frank adversely affects the OTC markets relative to the exchange traded markets, as trading in both the former and the latter may be confounded due to additional “noise” (see e.g. Verma (2012)).
13
The approach we take is to test for changes in mispricing of derivative contracts as a result of the introduction of Dodd-Frank regulations pertinent to derivatives markets.
2.3.1 Empirical Modeling
As in Switzer, Varson and Zghidi (2000) the theoretical futures price used to test for market efficiency is the Cost of Carry relationship. As noted therein, the relationship is obtained from an arbitrage strategy that consists of a long position in the index portfolio, with a price P0 and a short position in an equal amount of index futures, priced at F0.
Over time, the hedged strategy will yield a fixed capital gain of F0 - P0, as well as a flow of
dividends. In the absence of dividend risk, the position is riskless and hence should earn the riskless rate of interest. To prevent profitable arbitrage, the theoretical equilibrium futures price at time t Ftecan be written as:
( )
( , ) e r T t
t t t T
F Pe D (2.2)
where T is the maturity date and D(t,T ) is the cumulative value of dividends paid assuming reinvestment at the riskless rate of interest r up to date T is held until the futures contract expires.
We adopt a commonly used formula for mispricing for index futures (e.g., MacKinlay and Ramaswamy (1988), Bhatt and Cakici (1990), Switzer, Varson and Zghidi (2000), Andane, Lafuente and Novales (2009); and others). Assuming a constant dividend yield d
mispricing is measured as the difference between the actual futures price and its theoretical equilibrium price, deflated by the underlying index
( ( , ) e) /
t t t
14
where F(t,T ) is the actual index futures price, and e (r d T t)( )
t t
F Pe .
2.3.2 Data Description
The futures data used in this study are for the nearby Chicago Mercantile Exchange (CMER) S&P 500 Index futures contracts for the period February 1, 2004 through July 31, 2012. We perform the analyses using daily data (2161 observations). We use the actual daily dividend series for the S&P 500 obtained from Standard and Poor’s. Daily three-month Treasury bill rates from Bloomberg are used for the riskless rate of interest.
2.3.3 Empirical Results
[Please insert Figure 2.1 about here.]
Figure 2.1 shows the path of mispricing over the sample period. As is noted therein, during the most severe periods of the financial crisis in 2008 were associated with extremely large levels of mispricing. The structural break point that we use is the onset of the Dodd-Frank regulatory period, which we define as the date of the Treasury submission of specific legislative proposals regarding derivatives to Congress, August 11, 2009. Our hypothesis is that arbitrage activities in the exchange traded markets would increase in anticipation of the final mandated restrictions on using OTC markets for this purpose. There is evidence of market participants reacting to anticipated changes in the regulatory environment. Indeed, an internal report from Deutsche Bank’s head of government affairs for the Americas states, than was leaked to the media on July 7, 2010 states that “opportunities for global regulatory
15
arbitrage could be significant.3” We noted in the previous section that this date appeared most significant as a watershed for open interest variations associated with Dodd Frank across a wide variety of exchange traded contracts. Some evidence of a reduction of mispricing can be observed, in the shaded area to the right of the August 11, 2009 vertical line. This is confirmed in the statistical analyses. Table 2.4 shows that average mispricing has declined in the period subsequent to Dodd Frank. Indeed the t statistics for a reduction in mispricing and a reduction in absolute mispricing are both significant at the 1% level.
[Please insert Table 2.4 about here]
Table 2.5 shows regression results for the signed mispricing series and for the absolute mispricing on a dummy variable that is equal to 1 on the day of and subsequent to the Treasury OTC report release date dummy variable. Panel A shows the results for the signed mispricing regression, while Panel B uses the absolute mispricing series as the dependent variable. In both cases, the dummy variable coefficients are significant at the 1% level. These results provide further confirmation of the improved efficiency hypothesis, as opposed to the induced noise hypothesis. It is observed that there was a very significant increase in mispricing prior to the Dodd-Frank related events that can be linked to the global financial crisis. Our basic point is that this mispricing has come down coincidental to the new legislative efforts to regulate the markets. We might conjecture that given the high degree of volatility lingering in the markets, which may in part be associated with the continued regulative uncertainty that it may be a long while before markets return to pre-crisis mispricing levels.
3
See http://www.foxbusiness.com/markets/2010/07/07/deutsche-bank-rips-financial-reform/#ixzz2HmqZt0pX
16
[Please insert Table 2.5 about here]
2.4 DODD FRANK AND THE DEVIATIONS OF EURODOLLAR FUTURES VS.
FORWARD CONTRACTS 2.4.1 Data Description
As a final test, we explore the impact of Dodd-Frank on pricing efficiency using the metric of the deviation of Eurodollar futures yields from implied forward contract rates. We use Eurodollar futures prices and 1, 3, 6, 9, and 12 month LIBOR quotations in the analysis. Daily Eurodollar futures prices and daily spot LIBOR quotations are obtained from the Bloomberg. Our sample period is from January 2007 through June 2012.
2.4.2 Empirical Modeling for Forward and Futures Rates
Three-month implied forward rates are computed from LIBOR spot quotations based on the Grinblatt and Jegadeesh (1996) formula (with time measured in years)
( , .25) ( , .25)*[ (0, ) / (0, .25) 1]
f s s d s s P s P s (2.4) where f(s, y) is the annualized Eurodollar forward rate at time 0 over the period s to y; d(s,y) is the LIBOR conversion factor, computed as 360/number of days between s and y and P(s,y) = 1/[1+Ls(y-s)/d(s,y)] is the time s price of $1 paid out at y in the Eurodollar
market, and Ls(y-s) is the (y-s) year LIBOR rate prevailing at time s.
We compute the 3-month forward rates f(.25, .5), f(.5, .75), and f(.75, 1) using the 3-, 6-, 9-, and 12-month spot quotations of LIBOR rates.
The futures rate is computed with the daily closing price of the futures contract (Futures Pricet) that matures on date s from the expression:
( , .25; ) 1 _ Pr t/100
17
where F(s,y,t) is the annualized Eurodollar futures rate at time t for the interval s to y.
We focus on futures contracts maturing in March, June, September, and December in our sample period. Since futures contracts mature in a quarterly cycle, the futures rate intervals do not in general coincide with the forward rate intervals. For comparisons of futures rates with forward rates, we replicate the two interpolation methods used by Grinblatt and Jegadeesh (1996) to align the intervals.
With the futures interpolation method, we fit a cubic spline to the futures rates of the four nearest maturing contracts to construct an interpolated term structure of futures rates. For each sampling date, we use the futures prices of the four nearest maturing contracts on that date to fit a curve, and pick interpolated futures rates for intervals that coincide with the forward rate intervals to get F(0.25, 0.5), F(0.5, 0.75), and F(0.75, 1). We interpolated the four nearest maturity futures contracts starting from 01/02/2007 to 03/19/2012 to obtain F(.25, .5), F(.5, .75), and F(.75, 1). We interpolated the three nearest maturity futures contracts starting from 03/20/2012 to 06/19/2012 to obtain F (.25, .5) and F(.5, .75).We then compare these interpolated rates with the implied forward rates, f(0.25, 0.5), f(0.5, 0.75), and f(0.75, 1).
With the spot LIBOR interpolation method, we use the 1-, 3-, 6-, 9-, and 12-month LIBOR quotations to fit a cubic spline to obtain the entire term structure of spot LIBOR rates for each date in our sample period. The implied forward rate, f(s, s+0.25), is computed from those interpolated LIBOR rates using equation (2.4). Futures rate F(s, s+0.25) of each of the three nearest maturing futures contracts is directly computed from closing prices with equation (2.5).
18
2.4.3 Empirical Results
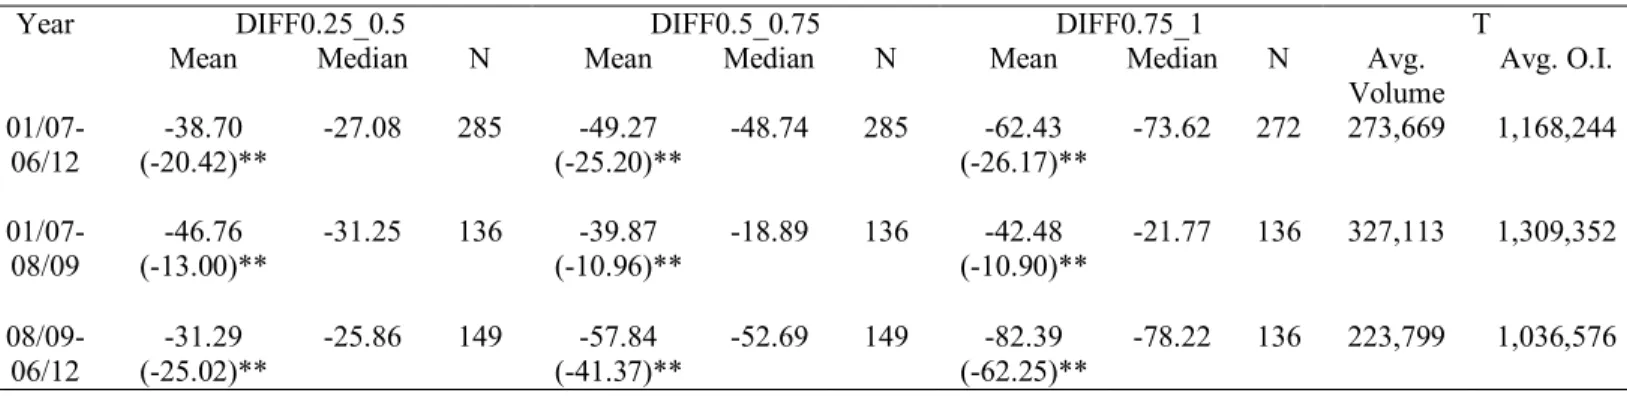
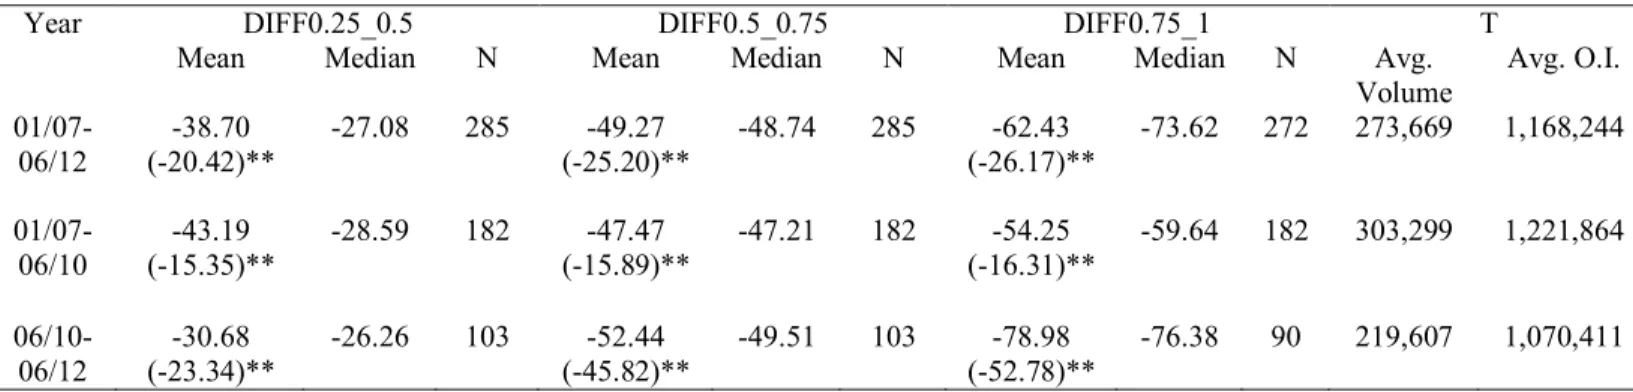
The analysis is performed using two breakpoints. Table 2.6 below uses the Treasury Date (08/11/2009) as the breakpoint, while Table 2.7 shows the results using the Conference Date (06/25/2010) as the breakpoint. These tables present the differences between the futures and forward Eurodollar yields expressed in basis points employing weekly (Thursday) data from January 2007 through June 2012. We also include the average volume and average open interest of weekly (Thursday) data of the four (or three) nearest maturity futures contracts for different sample periods.
In Panel A of Tables 2.6 and 2.7, implied forward yields are computed from quoted LIBOR rates and futures yields are obtained by interpolating between the futures transaction prices. DIFF0.25_0.5 is the time t difference between the annualized futures and forward yields for the interval t+0.25 to t+0.5; DIFF0.5_0.75 and DIFF0.75_1 are the time t yield difference for the intervals t+0.5 to t+0.75 and t+0.75 to t+1, respectively; N is the number of observations.
Panel B of Tables 2.6 and 2.7 report the results using the spot LIBOR interpolation method to compute the implied forward rates. DIFF1 is the difference between the annualized 3-month futures and forward yields on the date of maturity of the nearest maturity futures contract. DIFF2 is the difference between annualized 3-month futures and forward yields on the date of maturity of the next-to-nearest maturity futures contract. DIFF3 is the difference between annualized 3-month futures and forward yields on the date of maturity of the third-to-nearest maturity futures contracts.
19
As is shown in these tables, aggregate trading volume and open interest in the Eurodollar contracts decline in the period of the study. Again, this is in part likely a consequence of the low Fed funds rate since January 2009. In general, we find that futures rates are below forward rates throughout the sample. This phenomenon is also observed in the latter part of the Grinblatt and Jegadeesh (1996) sample, which covers the period 1987-92. The downward bias appears to be exacerbated in our sample, amounting to over 30 basis points for nearby contracts, and considerably more for the more distant contracts.
Some evidence of improved price efficiency is shown for the Dodd Frank breakpoints for nearby contracts – ranging between 13 and 15 basis points, depending on whether we use the Treasury or Conference dates as breakpoints. The differential between futures and forward rates widens, however, for more distant contracts. The latter may be due to a shift to shorter maturity preferences for futures traders, with the increase in market uncertainty.
2.5SUMMARY AND CONCLUSIONS
This report provides new evidence on the impact of key Dodd Frank events on market activity for financial derivatives (futures and option contracts on US T bonds, Eurodollar futures and options, and S&P 500 Futures contracts) and on foreign exchange derivatives (futures and options contracts on EURO, British Pounds, and Canadian dollars). First, we look at how liquidity on the markets has been affected. Next, we test for mispricing of derivatives contracts. We find that measured liquidity does fall for US financial futures and options but rises for foreign exchange futures and options subsequent to the introduction of
20
the treasury guidelines for OTC trading. Specifically, the Dodd Frank structural breakpoints appear to be negatively associated with open interest, but only for certain financial futures. However, this relationship is not significant for the Eurodollar contracts and the T-bond contracts. The lack of significance for the Eurodollar contracts may be due to the overwhelming effects of a decline in interest rates over the sample period – with the Fed maintaining the Fed funds rate at close to zero since January 2009. The lack of significance for T-bonds could be due to the expectation (which has been subsequently justified) of an exemption of T-bonds from Dodd-Frank and the Volker Rule.
The significantly negative association of Dodd-Frank with the other financial derivative products is consistent with Duffie’s (2012) hypothesis of a withdrawal of participants in markets for US assets (OTC and exchange traded) due to a reduction of quality of fundamentals. The increased liquidity of foreign currency derivatives, however is not consistent with Greenspan’s (2011) warning of an exodus of foreign exchange derivatives from the US. However, our result may not preclude increased participation in the US foreign exchange derivative markets due to planned migration of asset holders and investors to foreign venues in order to escape the regulatory tax (Houston, Lin, and Ma (2012)).
Finally, our study shows mixed results on how Dodd Frank derivative provisions affect the efficiency of the exchange traded markets. An increase in efficiency reflected by lower deviations of futures prices from their cost of carry is observed for the S&P futures contracts. This may reflect an increase of arbitrage by traders on the exchange traded markets, as opposed to the OTC markets. Increased pricing efficiency based on lower spreads
21
between futures and implied forwards for nearby Eurodollar contracts is also observed. This is not the case, however, for more distant futures.
At this juncture in time, the implementation of the individual provisions of Dodd-Frank has been piecemeal and heavily delayed. The implications of such delays are certainly worth investigating as topics for future research, along with additional comparative impact studies of Dodd-Frank on US vs. foreign derivatives markets and financial institutions.
22
CHAPTER THREE
POSITION
GROWTH
RATE
INTERACTIONS
BETWEEN
EXCHANGE-TRADED DERIVATIVES AND OTC DERIVATIVES
3.1. INTRODUCTION
Starting from April 1989, every three years the Bank for International Settlements coordinates a global central bank survey of foreign exchange and derivatives market activity on behalf of the Markets Committee and the Committee on the Global Financial System. The objective of the survey is to provide the most comprehensive and internationally consistent information on the size and structure of global foreign exchange markets and other derivatives markets, allowing policymakers and market participants to better monitor patterns of activity in the global financial system. Coordinated by the BIS, each participating institution collects data in April from the reporting dealers in its jurisdiction and calculates aggregate national data. In addition, participating institutions around the world report data on notional amounts outstanding at end-June of each survey year. The triennial survey has been conducted every three years since April 1989, covering data on amounts outstanding since 1995. In this paper, we provide the analysis of OTC derivatives market activity across different risk categories for different years. We also grouped the data into different district segments and made comparisons of the derivatives market activity in those regions across different years. We also checked the OTC derivatives market activity by global non-financial reporters since researchers also pay attention to surveys of derivatives utilization by non-financial firms.
23
Trades in the OTC market are typically much larger than trades in the exchange-traded market. In OTC market the terms of a contract do not need to be specified as in an exchange. Market participants are free to negotiate any mutually attractive deal. But there is some credit risk in an OTC trade as the contract might not be honored. Due to the lack of data, it is not easy to assess the interaction between OTC and exchange-traded derivative products. Some work has been done on the relationships between exchange-traded futures vs. spot markets. Chan et al. (1991) examined the relationship between returns and returns volatility in the stock index and stock index futures markets. They found that price innovations that originate in either the stock or futures markets can predict the future volatility in the other market. Chan (1992) checked the lead-lag relation between returns of market index and returns of the market index futures and found strong evidence that the futures leads the index and weak evidence that the index leads the futures. Ng and Pirrong (1996) found that spreads between spot and futures prices explain all spot return volatility innovations for gasoline and heating oil, and spot returns are more volatile when spot prices exceed futures prices. Koutmos and Tucker (1996) found that innovations originating in the futures markets increase volatility in the stock market in an asymmetric fashion: bad news increases volatility more than good news. And innovations in the stock market have no impact in the volatility of the futures market. Min and Najand (1999) found a bi-directional causality between volatilities between cash and futures markets in Korea. They also found that the trading volume has significant explanatory power for volatility changes in both spot and futures markets. Scholars also used trading volume to study the effects of competition between exchanges and trading venues. Silber (1981) studied the competition between competitive contract modifications and an existing high-volume contract on different
24
exchange. Holder et al. (2002) used the volumes of corn and soybean futures contracts traded in different exchanges to examine the interactions between those contracts, and found that they exhibit a complementary relationship rather than substitutes. Some scholars also studied the relationship between trading volume and volatility. Switzer and Fan (2008) found that trading activity in exchange-traded futures market leads the OTC markets. Compared with OTC market, the exchange-traded market shows greater responsiveness to changes in market-wide risk. And these two markets behave as substitutes rather than complements.
In this paper, our objective is to examine the interaction between the growth rates of positions between exchange-traded market and OTC market. Here, we use the data of the statistics on positions in the global OTC derivatives market and exchange-traded derivatives market obtained from the Triennial Central Bank Survey of Foreign Exchange and Derivatives Market Activity and the regular semiannual survey of positions in the global OTC derivatives market by Bank for International Settlements starting from June 1998 to December 2012. Those surveys cover the notional amounts outstanding and gross market values of foreign exchange, interest rate, equity, commodity and credit derivatives traded in OTC markets. They refer to the worldwide consolidated positions of reporting dealers. The triennial survey is more comprehensive, covering more than 400 market participants in a total of 47 jurisdictions. The semiannual survey is based on data from 59 major dealers in the G10 countries and Switzerland.
The remainder of the paper is organized as follows: A generalization of the global OTC derivatives markets activity is given in section 3.2. Section 3.3 provides a description of the research methodology and the empirical results. Section 3.4 provides the analysis of the
25
OTC derivatives had non-financial customers as counterparties. The paper concludes with a summary in section 3.5.
3.2. GENERALIZATION OF OTC DERIVATIVES MARKET ACTIVITY
We provide the analysis and comparison of notional amounts outstanding, gross market values, and turnover in global OTC derivatives across different risk categories in different survey year. Data of the statistics on positions in OTC derivatives market are obtained from triennial surveys of positions in the global OTC derivatives market by Bank for International Settlements from 1998 to 2010. It covers the notional amounts outstanding and gross market values of foreign exchange, interest rate, equity, commodity and credit derivatives traded in OTC markets. They refer to the worldwide consolidated positions of reporting dealers. The triennial survey covers more than 400 market participants in a total of 47 jurisdictions.
3.2.1 OTC Derivatives: Notional Amounts Outstanding
Nominal or notional amounts outstanding provide a measure of market size. Table 3.1 provides the notional amounts outstanding of OTC derivatives net of inter-dealer double-counting. The 1998 survey data confirmed the predominance of OTC over exchange-traded positions, and within the OTC market, the overwhelming importance of interest rate instruments over foreign exchange contracts (67% and 31% of notional amounts respectively).
26
At the end of June 2001, global OTC positions in all categories of market risk increased by 38% to nearly $100 trillion, with interest rate product growing sharply (58%) and foreign exchange instruments contracting (7%).
At end-June 2004, the notional amounts of outstanding OTC contracts rose by 121% to $221 trillion. It was a much faster rate of expansion than the 38% recorded in the three years between 1998 and 2001. Reflecting the developments in turnover, expansion was stronger for interest rate products (134%) than for exchange rate products (54%). Positions in OTC derivatives grew at an even more rapid pace than turnover.
Notional amounts outstanding went up by 135% to $516 trillion at the end of June 2007. Positions in the credit segment of the OTC derivatives market expanded from $5 trillion to $51 trillion. Notional amounts outstanding of commodity derivatives rose more than sixfold to $8 trillion. Open positions in interest rate contracts increased by 119% to $389 trillion, and those in equity contracts by 111% to $11 trillion. Growth in foreign exchange derivatives was less brisk at 83%. Positions in OTC derivatives are dominated by interest rate contracts, which accounted for 75% of total notional amounts.
The 2010 survey shows that the growth in the positions of OTC foreign exchange instruments was moderate at 9%, compared with an increase of 83% in notional amounts outstanding of currency instruments in the 2004-2007 period. The 2007 and 2010 BIS triennial surveys bracket a period of strong growth in amounts outstanding. Notional amounts outstanding in all instruments peaked in June 2008, declined thereafter (due in part to trade compression) and recovered somewhat by June 2010. Currency swaps increased to almost $19 trillion outstanding, growing by a third relative to 2007. Currency options outstanding fell by 12 % to $12 trillion.
27
From the triennial survey data in Table 3.1, we can see that compared with other risk categories, interest rate contracts dominated the positions in OTC derivatives. The same phenomenon was observed in exchange-traded derivatives. Interest rate contracts dominated the positions in exchange-traded derivatives.
[Please insert Table 3.1 about here.]
3.2.2 OTC Derivatives: Gross Market Values
Notional amounts outstanding provide useful information on the structure of the OTC derivatives market but should not be interpreted as a measure of the riskiness of these positions. Gross market value provides useful information, which is the cost of replacing all open contracts at the prevailing market prices.
Table 3.2 provides gross market values of OTC derivatives markets. Gross market values rose from $2.6 trillion to $3 trillion at the end of June 2001, but declined relative to notional amounts outstanding. The reduction in the aggregate ratio mainly resulted from interest rate products and equity-related instruments, although short-term interest rates began a steep descent and the volatility of equity markets increased substantially from the beginning of 2001.
Gross market values are more than doubled, increasing from $3 trillion at end-June 2001 to $6.4 trillion at end-June 2004. The growth rate was lower than the corresponding increasing rate in notional amounts outstanding. The growth in gross market values was mainly due to interest rate products, which was largely derived from higher interest rate volatility in mid-2004. Drop in the volatility of equity markets and the stability of the main
28
stock indices contributed to the decline in the market to notional ratio of equity-linked contracts.
Gross market value increased at a considerably lower rate (74%) than notional amounts to $11 trillion at the end of June 2007. The reasons why the replacement values of derivatives positions increased at a lower rate than face values might be due to the stable long-term interest rates and implied volatility. Long-term interest rates are the main driver of the market value of interest rate swaps. And implied volatilities are an important input for the market value of options.
Gross market value increased from $11 trillion to $24.7 trillion at the end of June 2010. The ratio of market value to notional amounts rose to 4.2%, from 2.2% in 2007. The ratio grew across almost all the risk categories except equity-linked contracts. The decline in stock prices during the crisis resulted in much smaller positions in the equity segment of the OTC derivatives market. Interest rate risk remains by far the largest type of risk traded on the OTC derivatives market in terms of both notional amounts and gross market values.
[Please insert Table 3.2 about here.]
3.2.3 OTC Derivatives: Turnover
Turnover data provide a measure of market activity as well as an indication of market liquidity. Table 3.3 provides the turnover data of the two main segments of the OTC derivatives market: interest rate and currency products, had all the counterparties and non-financial customers as the counterparty. The reported OTC turnover data show adjustments for double-counting in local and cross-border transactions. For 1998 survey, notional amounts outstanding have been higher for interest rate contracts than for foreign exchange
29
contracts, the turnover has been greater for the latter. It maybe because foreign exchange contracts have tended to have considerably shorter terms than interest rate contracts. Swaps dominate turnover in both foreign exchange and interest rate segments of the OTC market.
In 2001, the global daily turnover in foreign exchange and interest rate derivatives contracts increased by 10% to nearly $1.4 trillion. Business in foreign exchange products declined by 12% and in interest rate instruments rose by 86%. The slowdown reflected a number of structural influences affecting the foreign exchange segment. Higher volume of business in interest rate products resulted largely from changes in hedging and trading practices in the interest rate swap market.
Global daily turnover in foreign exchange and interest rate derivatives contracts rose by 74% to $2.4 trillion in April 2004. Growth in interest rate segment (110%) continued to exceed growth in foreign exchange segment (51%). Daily activity in exchange-traded derivatives expanded by 114% to $4.5 trillion.
Average daily turnover in OTC foreign exchange and interest rate contracts went up by 73% to $4.2 trillion in April 2007. Activity in foreign exchange derivatives rose by 78%. More moderate growth was recorded in the interest rate segment, where turnover went up by 64%. For the first time since 1995, growth in turnover in the OTC market outstripped that in exchange-traded interest rate and currency derivatives (36%). Growth in the FX segment accelerated since 2004 and, for the first time outstripped growth in interest rate segment.
The 2010 survey only reports turnover data in the global foreign exchange markets. Turnover of outright forwards, foreign exchange swaps, currency swaps, currency options
30
and other OTC foreign exchange products continues to be many times larger than the volumes traded on organized exchanges. Daily turnover for currency instruments on organized exchanges was $168 billion, less than 7% of the $2.5 trillion average daily turnover in those instruments.
[Please insert Table 3.3 about here.]
BIS also provides geographical distribution of OTC average daily turnover for more than 50 countries. We grouped those countries into three regions: the Americas, Europe, and Asia and Pacific. Table 3.4 provides the geographical distribution of daily average net turnover of total reported OTC derivatives market of the three regions for triennial surveys conducted in 2004, 2007, and 2010, respectively. For those three regions, turnovers on both foreign exchange contracts and interest rate contracts keep rising these years. It can be seen from the 2004 and 2007 surveys that in Americas, the turnover has been slightly greater for interest rate derivatives than for foreign exchange derivatives. While in Europe and Asia and Pacific region, it has been greater for foreign exchange instruments than for interest rate instruments. Especially in Asia and Pacific region, the turnover in OTC derivatives has been dominated by foreign exchange contracts, which accounted for more than 75% of the total turnover. It is quite similar in the three regions that swaps outstripped other instruments with the largest turnover in both OTC foreign exchange contracts and OTC interest rate contracts. Sharp increase can be seen in the turnover of swaps in OTC derivatives market in both Europe and Asia and Pacific region from 2004 to 2007.
31
3.3. INTERACTION BETWEEN OTC AND EXCHANGE TRADED DERIVATIVES 3.3.1 Data Description
Data of the statistics on positions in OTC and exchange-traded derivatives market are obtained from the semiannual survey of positions in the global OTC derivatives market by Bank for International Settlements starting from June 1998 to December 2012. The semiannual survey covers the notional amounts outstanding and gross market values of derivatives across different risk categories traded in OTC markets and exchange-traded markets. They refer to the worldwide consolidated positions of reporting dealers. The survey is based on data from 59 major dealers in the G10 countries and Switzerland.
To obtain the growth rate of the positions in OTC derivatives and exchange-traded derivatives, we divided notional amounts outstanding of current period by notional amounts outstanding of previous period. A total of 30 semi-annual notional amounts outstanding of the total derivatives market and derivatives market of different risk categories including foreign exchange, interest rate, equity-linked derivatives from June 1998 to December 2012 are used. Therefore, we obtain 29 semi-annual growth rates of the positions for the total derivatives and derivatives of each risk category. Our objective is to examine the positions growth rate interactions between OTC derivatives and exchange-traded derivatives both in total and in different risk categories. First, we use the original sample of 29 observations to test for whether the growth rate in positions of exchange-traded derivatives tend to lead the growth rate in positions of the OTC derivatives, or vice versa.
The basic variables that we use in our analyses are defined as follows:
OTC_rate: semi-annual growth rate of total notional amounts outstanding in global
32
Futures_rate: semi-annual growth rate of total notional amounts outstanding in
exchange-traded market.
OTC_fx: semi-annual growth rate of notional amounts outstanding of the risk
category of foreign exchange derivatives in global OTC market.
Futures_fx: semi-annual growth rate of notional amounts outstanding of the risk
category of foreign exchange derivatives in global exchange-traded market.
OTC_ir: semi-annual growth rate of notional amounts outstanding of the risk
category of interest rate derivatives in global OTC market.
Futures_ir: semi-annual growth rate of notional amounts outstanding of the risk
category of interest rate derivatives in global exchange-traded market.
OTC_eq: semi-annual growth rate of notional amounts outstanding of the risk
category of equity-linked derivatives in global OTC market.
Futures_eq: semi-annual growth rate of notional amounts outstanding of the risk
category of equity-linked derivatives in global exchange-traded market. [Please insert Table 3.5 about here.]
Table 3.5 shows the descriptive statistics for the variables used in the tests. We also examined ARCH/GARCH effects for all the series, based on standard chi-squared tests using one and four lags. As is shown in the table, all those series do not show ARCH/GARCH effects. So we can check Granger Causality tests based on OLS.
3.3.2 Methodology and Empirical Results